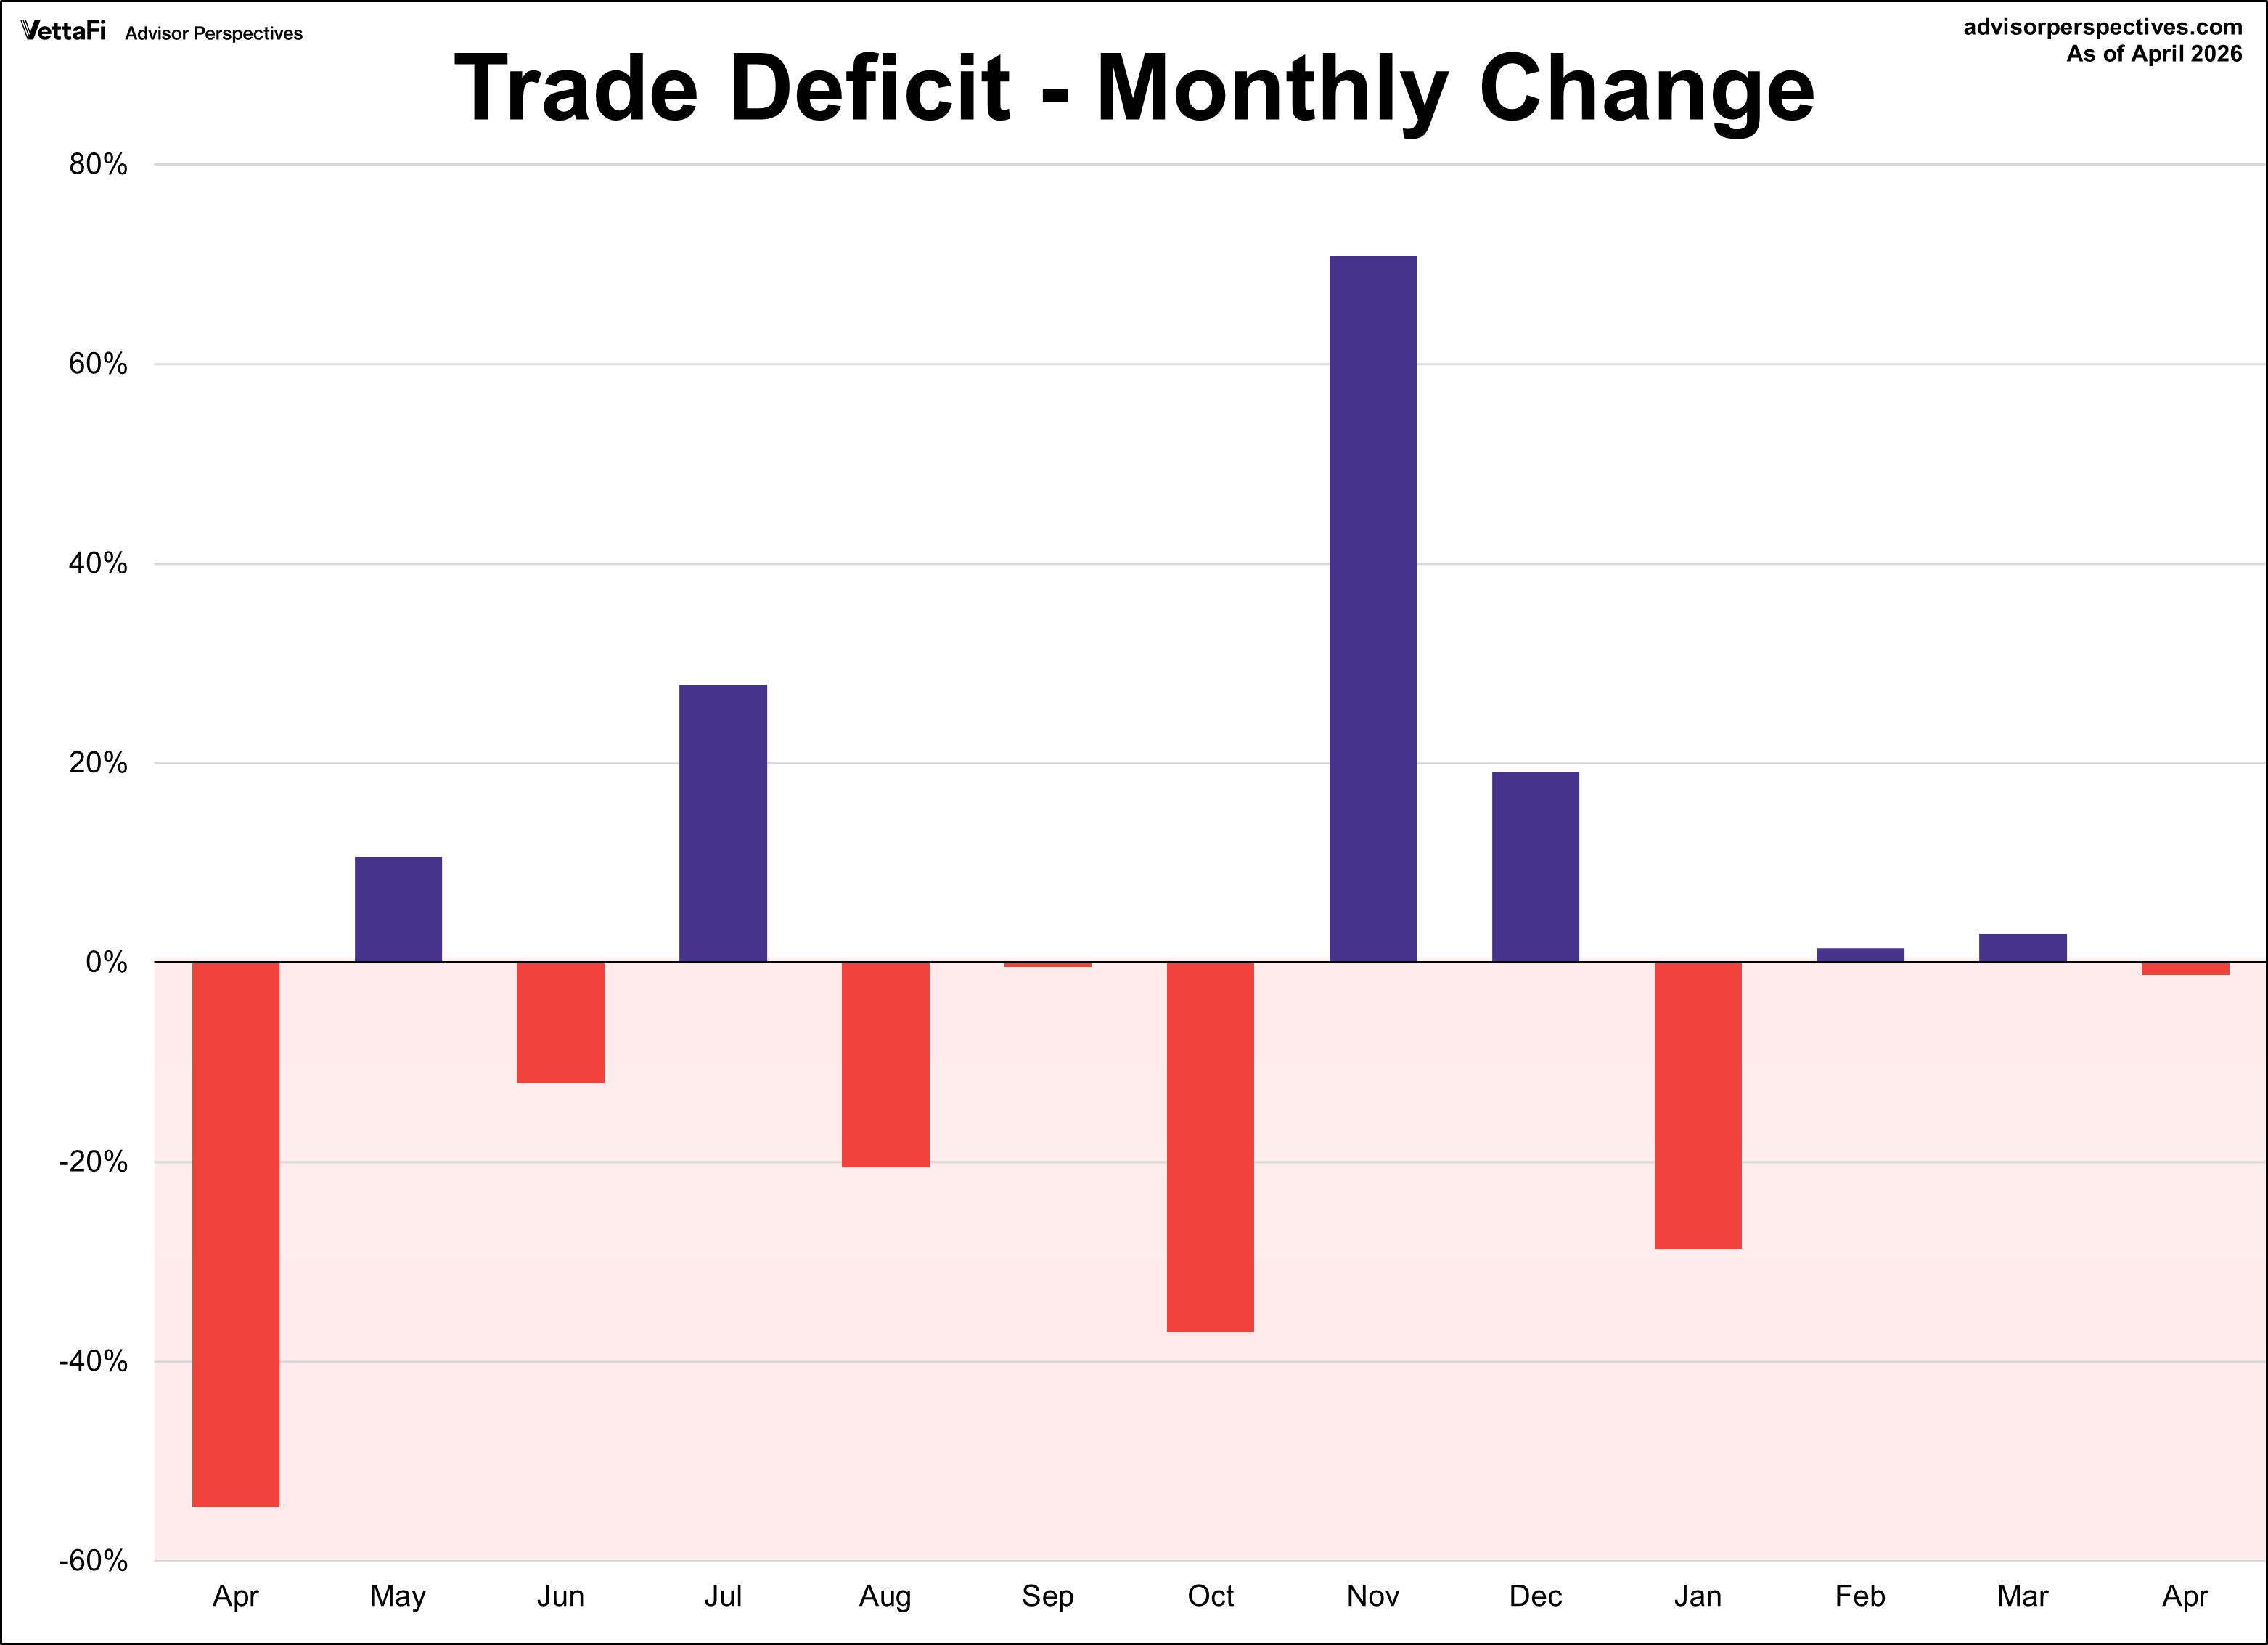
The U.S. trade deficit shrunk just over 1% in April to $55.88B after expanding nearly 3% the previous month. The latest reading barely missed the forecast of -$56.20B. Compared to a year ago, the trade deficit is 7.4% smaller.
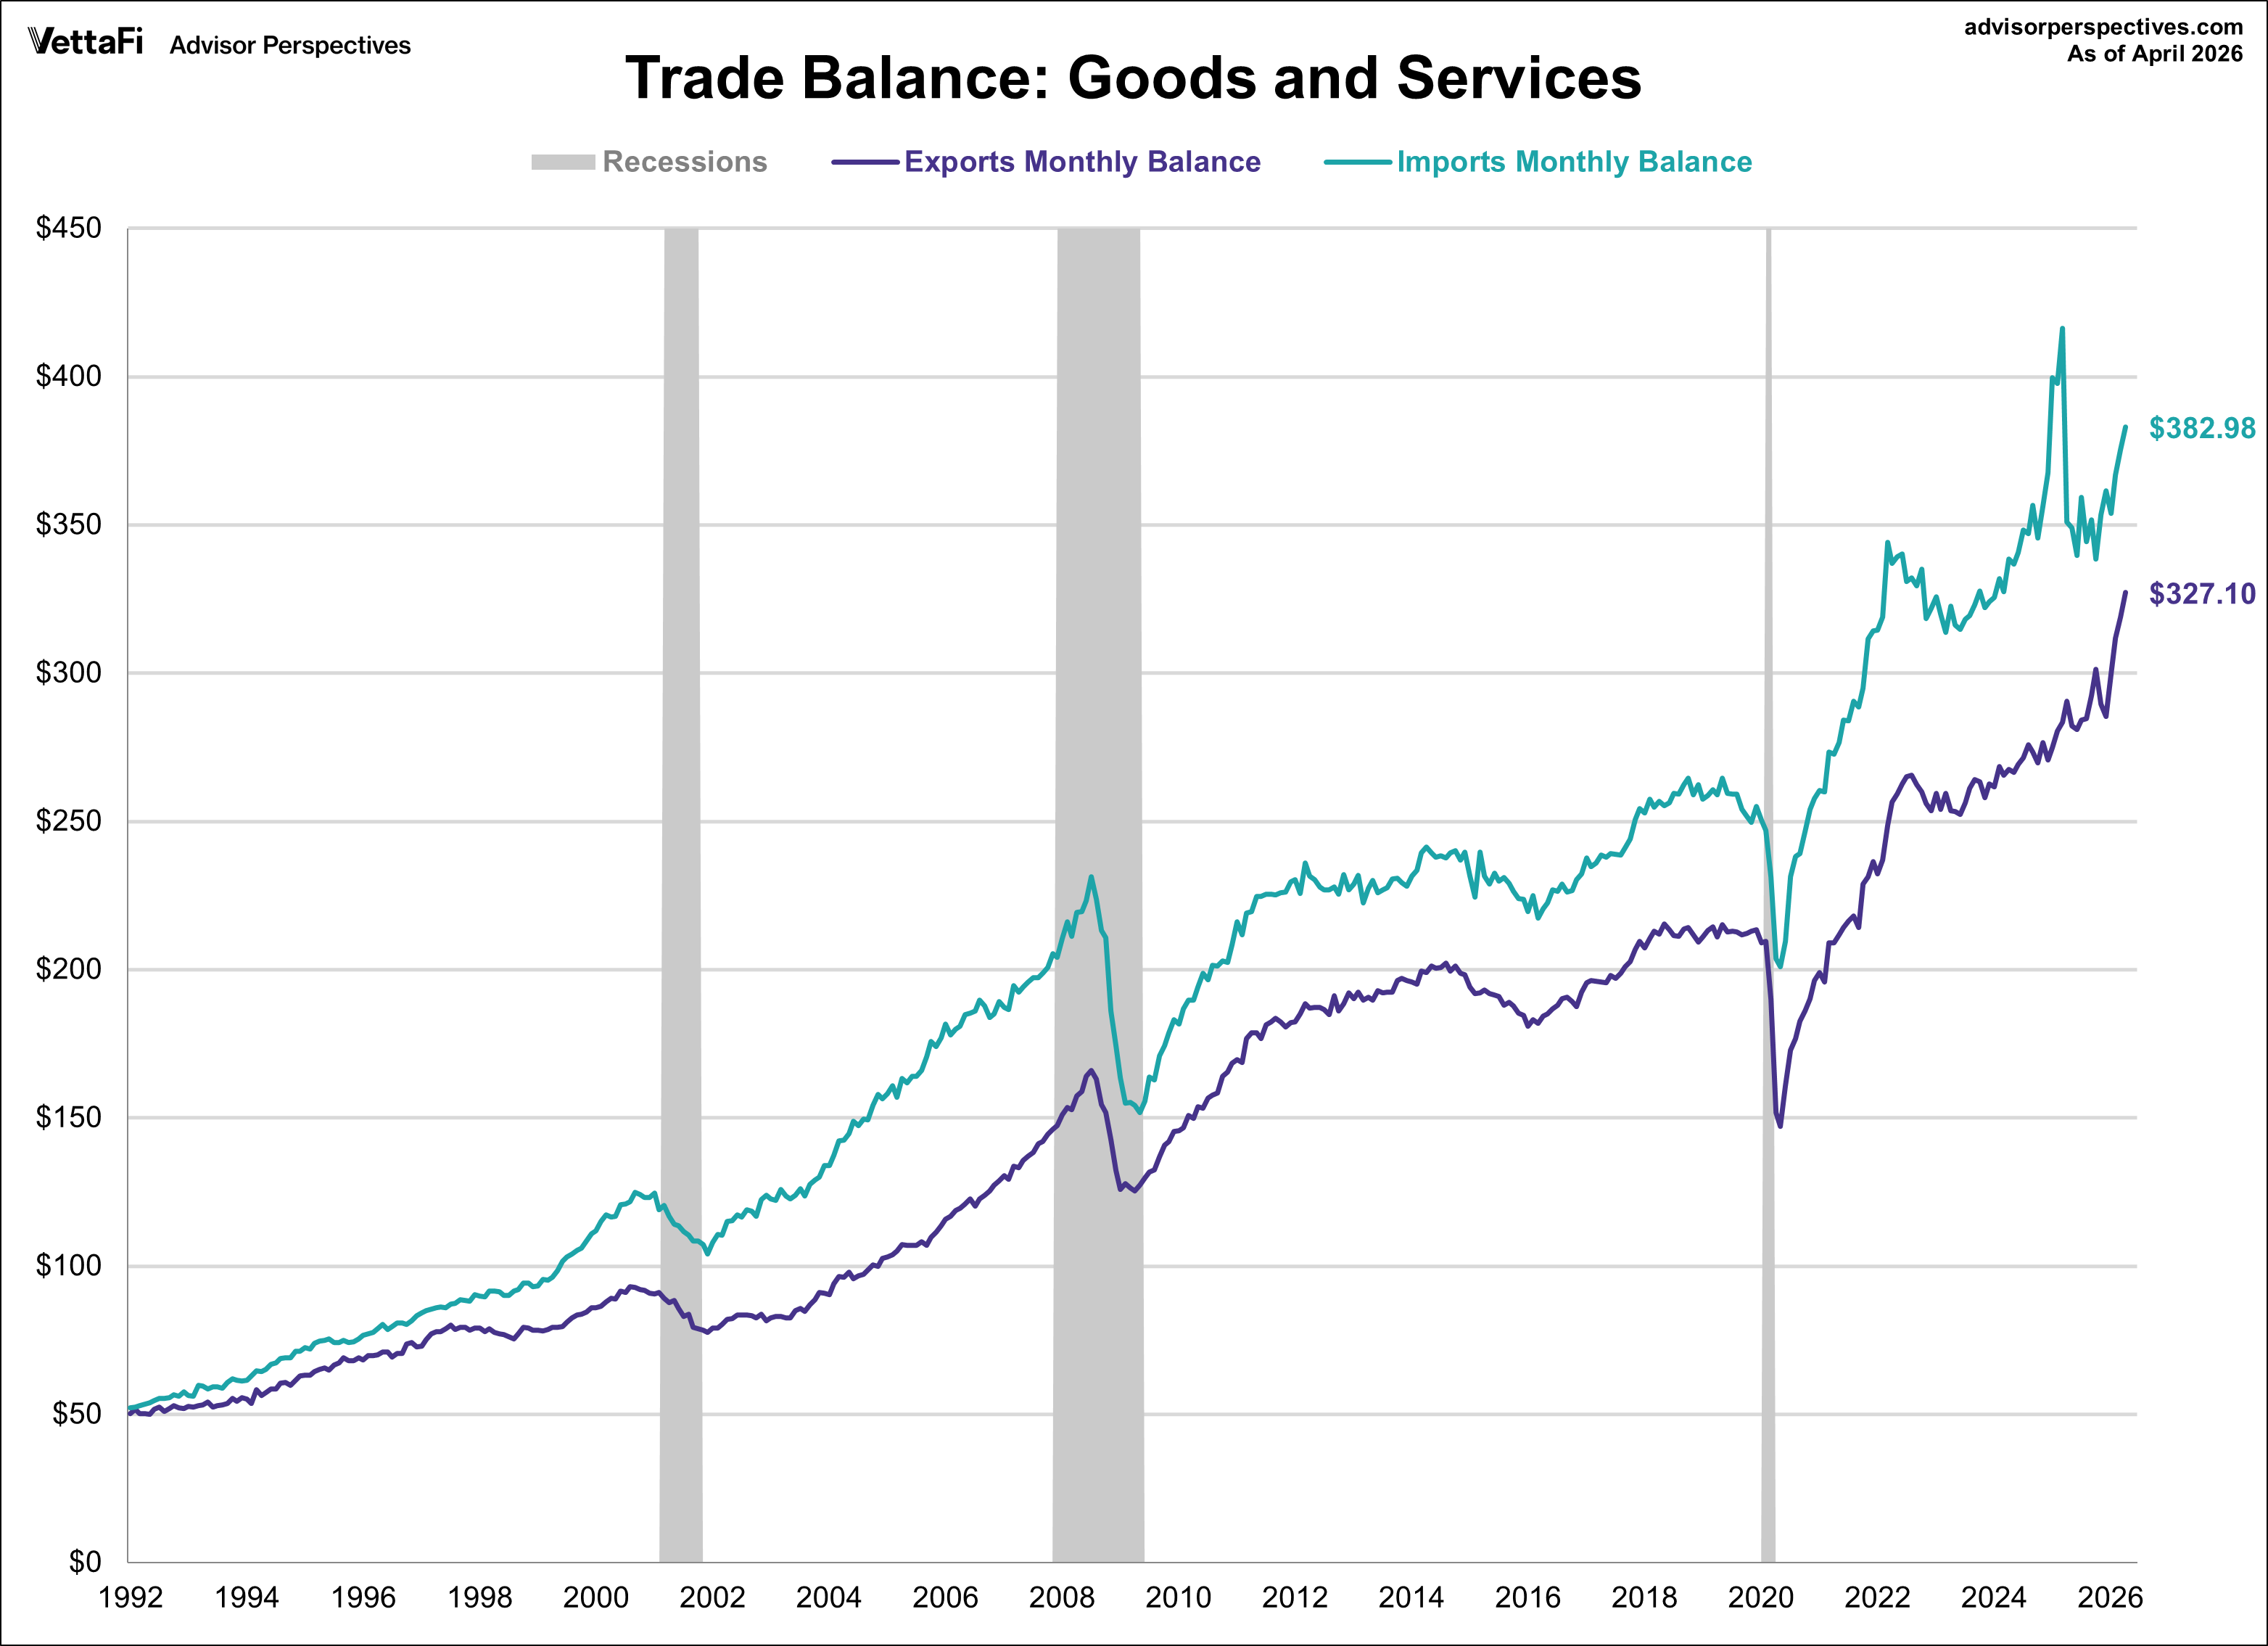
The U.S. international trade in goods and services, also known as the FT-900, is published monthly by the Bureau of Economic Analysis with data going back to 1992. The monthly reports include revisions that go back several months. This trade balance measures the difference in value between imported and exported goods and services.
Here is an excerpt from the latest report:
The U.S. monthly international trade deficit decreased in April 2026 according to the U.S. Bureau of Economic Analysis and the U.S. Census Bureau. The deficit decreased from $56.6 billion in March (revised) to $55.9 billion in April, as exports increased more than imports. The goods deficit decreased $2.4 billion in April to $83.7 billion. The services surplus decreased $1.7 billion in April to $27.8 billion.
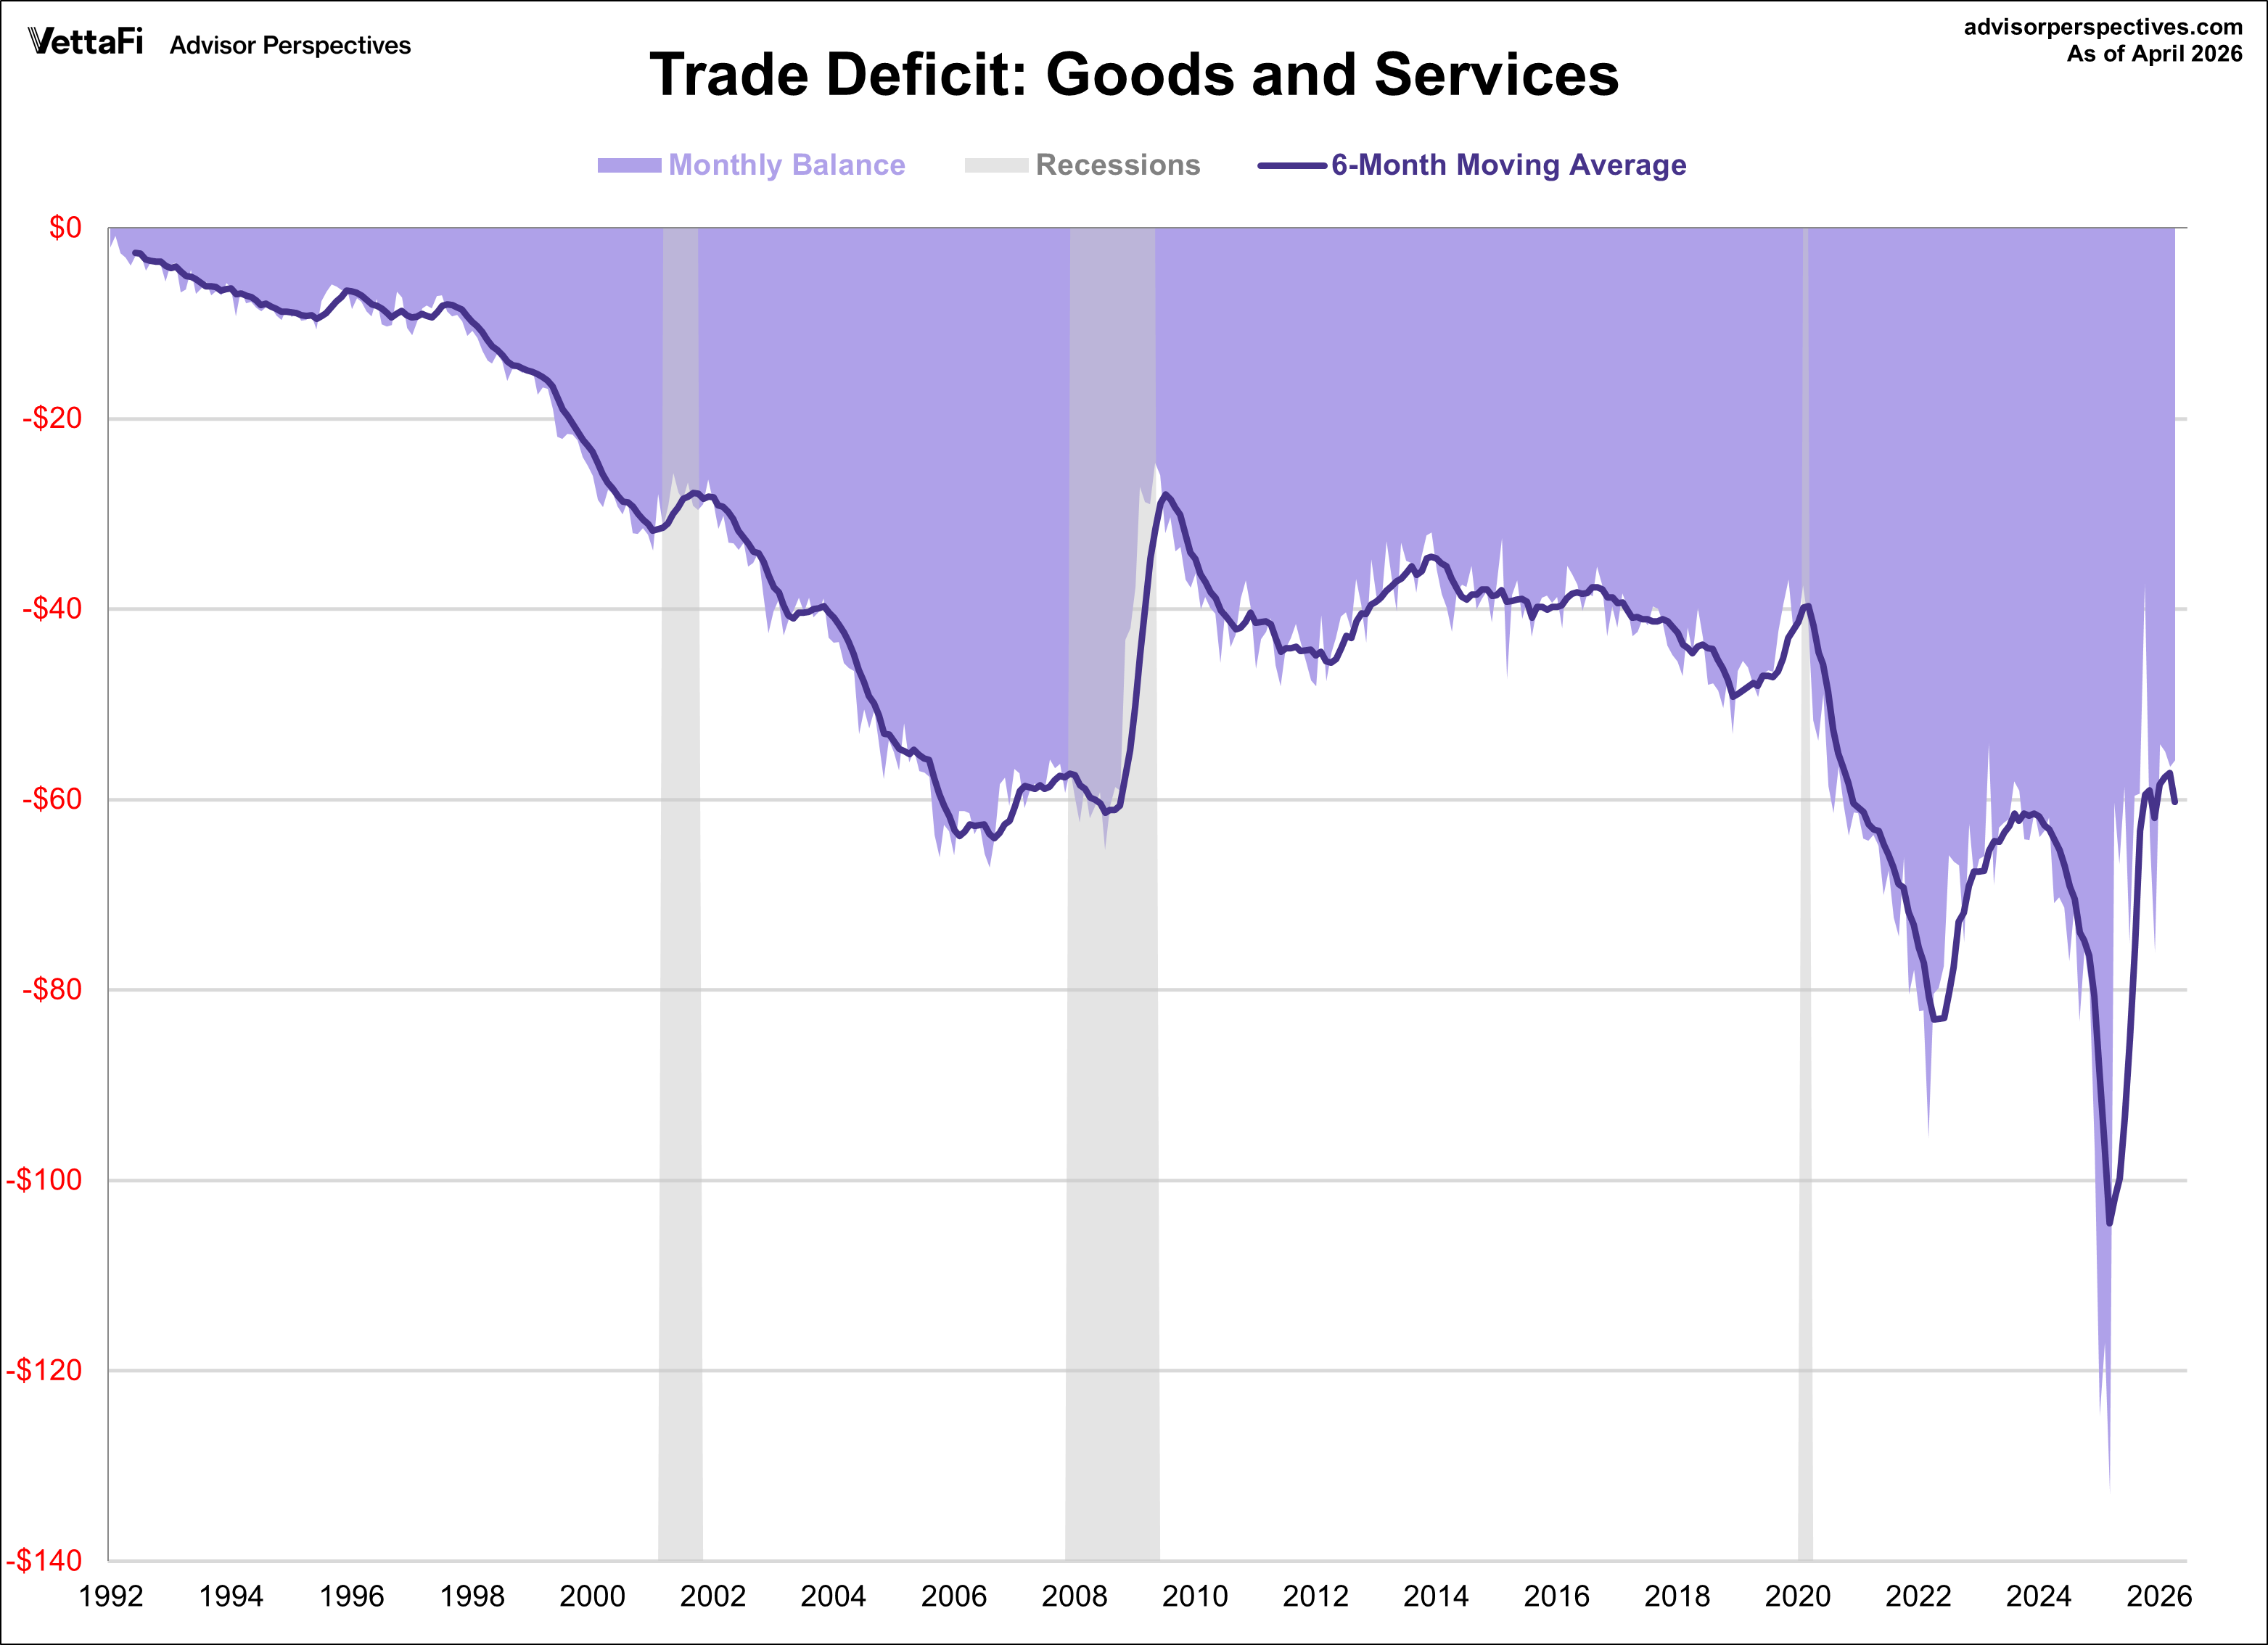
This indicator is somewhat volatile, with an 9.2% absolute average monthly change. The latest data point saw a 1.2% month-over-month change. Here is a snapshot that includes the six-month moving average which gives a better sense of the overall trend. The latest six-month moving average is at -$60.26B.
As mentioned earlier, the trade balance measures the difference in value between imported and exported goods and services. In April, imports were up $8.33 billion (2.6%) to $327.10B. Meanwhile, exports increased by $7.62 billion (2.0%) to $382.98B. Since exports increased more than imports, the trade deficit decreased.