Advisor Perspectives welcomes guest contributions. The views presented here do not necessarily represent those of Advisor Perspectives
Everybody is ignorant, only on different subjects. Will Rogers
Introduction
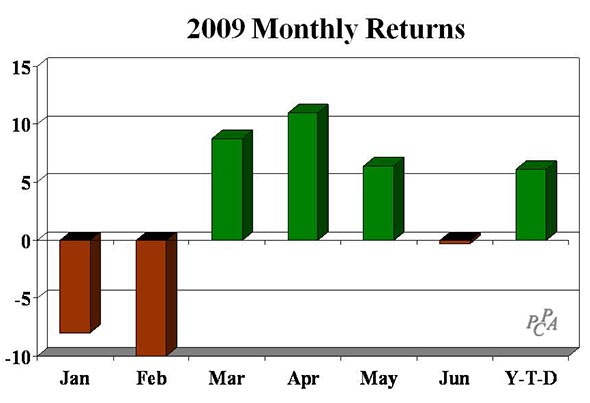
My first quarter commentary provided a glimmer of hope, primarily because March brought a positive 9% return for the US markets, following a 9-month cumulative loss of 47%. I speculated that we might be on our way to recovery, although it would take a whopping 90% cumulative gain to recover to where we were last June.
That glimmer continued into the first two months of the second quarter, but petered out in June. So what went wrong, or was June just a “breather”? In keeping with Will Rogers’ insight, I am still seeking explanations. One thing is for certain: these are very troubling times.

After I review first half stock market performance around the world, I’ll turn to the past decade, so we can set expectations accordingly. Have markets become cheap enough yet? I will conclude with a realistic and sobering look at our current debt problems - a cause for concern for both young and old.
The first half of 2009
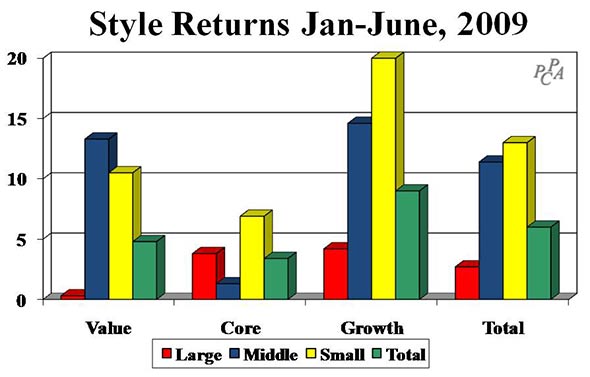
As the next chart shows, every US style made a profit in the first half of 2009, in stark contrast to the devastation in the second half of 2008. Smaller companies fared best, as did growth stocks, led by Information Technology. I use Surz Styles and Country indexes throughout this commentary, as described at <Surz Styles>.
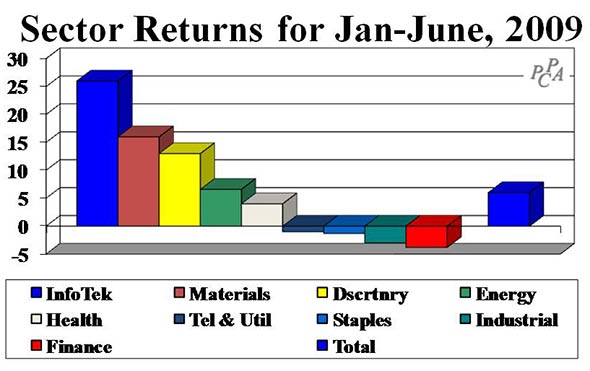
On the sector front, Information Technology delivered a terrific 25% return, which contrasts to 3% and 4% losses in Industrials and Financials respectively. Making a lot of money in these markets has been possible.
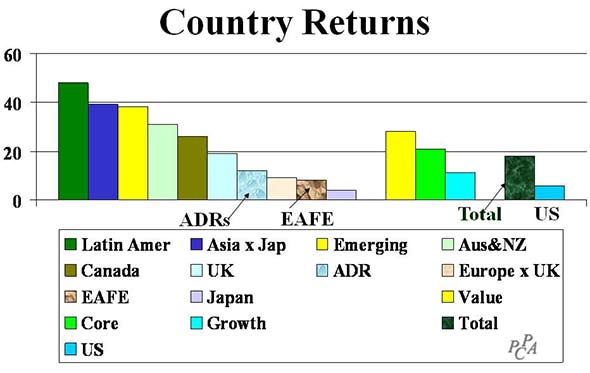
Now let’s turn our attention outside the US, where markets have been much better. The total foreign market returned 18% in the first half, tripling the return on US stocks. Latin America led the way with a 48% return, followed by Asia ex-Japan and Emerging markets with 39% and 38% returns respectively. EAFE lagged with an 8% return, as did ADRs with a 12% return. On the style front, value has been in favor, which contrasts to the US where growth has fared best.
Observers will say diversification “worked” in the first half of 2009 because the definition of “works” has come to mean “foreign markets perform better than US markets.” Several articles have been written recently about the failure of diversification to “work” in the second half of 2008. A careful read of these articles reveals that “not working” has essentially come to be defined as not winning with better performance. That is, adding diversifying assets beyond US stocks did not produce a return in excess of US stocks in the second half of 2008. Although I do not agree, this is an interesting definition of diversification “working” and one that is likely to persist. Diversification combines disparate assets with varying return patterns to stabilize returns over a long period of time. It “works” primarily by lowering volatility although it may also improve performance.
The Decrepit Decade
Recent stock market losses present challenges to the job of evaluating long-term equity performance. How can good performance be identified among a universe characterized by bad performance? Investment managers are supposed to be evaluated over long enough timeframes to be given a fair chance. But in this current 10-year timeframe a successful equity manager will have lost less than some standard - but what standard? And could a really good equity manager have delivered a positive result over the past decade? Most importantly, clients are much more cynical and critical of active management in this environment, so we need the best yardstick possible. The following exhibit provides that yardstick. It uses the PODS simulation approach described in previous commentaries.
The rightmost bar of the exhibit shows that managers benchmarked to the S&P500 are expected to have lost 2.2% per year over the past decade, which is the return on the index. A top quartile manager will have lost less than half that amount, or .9% per year, and an excellent manager (in the top 5%) would have eked out a positive 1.8% return per year, positive but still lagging inflation.
Many attribution and evaluation systems spew out scads of numbers, but much of what we see does not matter – it’s just noise. As paying clients of these systems, we need to know what numbers in our reports are statistically significant. That is, we need to know what information can be relied upon - what an engineer would call “signal” rather than just “noise.” For example, we must know whether an alpha is statistically significant; otherwise it’s just another number that should not be relied upon.
The reality, however, is that it takes decades to establish statistical confidence using traditional antiquated regression methods (such as those that produce alphas and betas), because those methods test performance hypotheses across time. By contrast, Portfolio Opportunity Distributions (PODs) solve this problem by testing hypotheses using the cross-section of all possible outcomes. PODs are classical hypothesis testing. An event is significant if it falls in the extremes (top or bottom decile for example) of all the possible outcomes, even if the result is for a period as short as one month. For example, if our only observation is a one-month return of 1,000%, it cannot be judged as statistically significant using traditional methods, but cross-sectional testing does reveal its significance.
Accordingly, you can rely on the rankings you obtain by plotting results in the graph above. Differentiating between signal and noise is extremely important. No other analysis system provides this very important perspective.
Everyone knows the trouble we’re in
It’s no secret that Americans and our government love to spend money. That’s part of what got us into this mess. But the really scary part is that we plan to spend our way out of our dilemma – more of the same, albeit mostly by the government in the form of economic stimuli and budgetary deficit spending.
The following picture puts the situation into sobering perspective. Our national debt stands at 370% of GDP, far higher than its previous high of 299% at the height of the Great Depression. The double-whammy is that GDP has been decreasing at the same time debt was increasing. But the most troubling aspect of the graph is its persistent rise beginning in the 1980s, with no signs of a change in this trend. It suggests a process out–of-control.
The good news is that our government can print money, inflating us out of our debt predicament, but someone will pay for inflation, namely creditors and the poor. If we see rampant inflation, those on fixed incomes, principally retirees, will be hardest hit, and the pain will be doubly felt following recent market losses. This is one of the reasons that the DOL and SEC held their first joint hearings ever, to review the situation with target date funds, a popular choice in defined contribution retirement plans.
The June 18 DOL and SEC hearings on Target Date Funds
The recent SEC and DOL hearings actually produced a few substantive agreements on target date funds:
- Plan sponsors are responsible for selecting and monitoring target date funds - no one else.
- The distinction between “To” and “Through” funds needs to be recognized, and fund companies need to clearly label their products accordingly. “To” funds are designed to end at the target date, and might be called “Accumulation-only” funds. “Through” funds are designed to continue beyond target date, potentially to death, and might be called “Target Death” or “Lifetime” funds.
- A crying need remains for standards, so plan sponsors and their advisors can make informed decisions. The definition of quality is “meets or exceeds standards,” so we need standards that describe the way target date funds should be structured.
Although some might not agree, target date funds are not all that complicated. For example, there is currently only one standard for “To” funds, so either it should be embraced or alternatives should be brought forward. Somewhat more complicated, there are three index series vying for acceptance as “Through” standards, and the key distinction among them is whether they utilize active or passive benchmarks. Hopefully the DOL will select appropriate standards because it really doesn’t have to be all that complicated.
Dow Jones introduced their indexes first, in April 2005. Our firm, Target Date Analytics (TDA), introduced its indexes in October 2007. Standard & Poor’s launched their indexes in late 2008 followed in early 2009 by Morningstar with their Lifetime Allocation Indexes. The TDA indexes are the only “To” indexes, ending entirely in safe assets at the target date, namely Treasury bills and Treasury Inflation Protected Securities (TIPS). The S&P indexes are the only “active” indexes because they are a composite of existing target date funds. The following table summarizes the choices:
Choosing a standard for Target Date Fund investments
|
Safety
To |
Growth
Through |
|
Active |
Passive |
Dow |
|
X |
|
|
X |
TDA |
X |
|
|
|
X |
S&P |
|
X |
|
X |
|
Morningstar |
|
X |
|
|
X |
Conclusion
I believe the US stock market is now fairly valued for a couple of reasons. Price/earnings ratios have declined over the past year from 26 to 16, which is in line with historical norms. Also, America remains the leading economic power in the world, at least for now. When we sneeze the world gets a cold.
I also believe that clients should require, and are requiring, higher standards of practice from their consultants and investment managers. Almost any advice is good during good times, but these are not good times. Clients need and want better protection and assurances that risk will be rewarded. They want the best. Differentiation is the name of the game. Superior advice and guidance is the prize. It’s a win-win.
Read more articles by Ron Surz