Advisor Perspectives welcomes guest contributions. The views presented here do not necessarily represent those of Advisor Perspectives.
Professors Michael Drew and Anup Basu argue that portfolio risk should increase as retirement nears, rather than decrease, as is the practice of lifecycle funds. In a recent paper, “Portfolio Size Effects in Retirement Accounts: What Does it Imply for Lifecycle Asset Allocation”, published in the April, 2009 issue of the Journal of Portfolio Management, the professors present research to support their conclusion that investors with a 40-year horizon are 12.5% richer on average with a “glide path” that operates in the opposite direction of lifecycle funds, increasing rather than decreasing equity allocation through time. They also conclude that there is a 90% probability of being richer with an increasing equity glide path.
Drew is a professor of finance and economics at Griffith University, Brisbane, Australia and Basu is a professor at Queensland University of Technology, also in Brisbane. To reach their conclusions the co-authors ran 10,000 simulations of 40-year returns, using data from 1900 to 2004.
Reactions to the professors’ findings vary based on one’s feelings about risk and its appropriateness near retirement. “Risk, after all, has a friend called pain,” Don Ezra of Russell told Pensions and Investments, when they reported on the study last month In other words, Professors Drew and Basu have merely rediscovered that investors, unsurprisingly, tend to get rewarded for taking risk. If risk weren’t rewarded with some reasonable regularity, no one would take it.
The real issue is whether the reward is commensurate with the risk. To examine this trade-off, I’ve evaluated the increase in risk that accompanies an increasing equity allocation. I take the position that the amount of a potential loss is what matters, rather than the percentage loss relative to one’s existing portfolio. In other words, losing $100,000 in a $1 million portfolio is substantially worse than a $1 loss on a $10 portfolio, even though both are 10% losses. Or put another way, a 20% loss suffered today by someone near retirement hurts much more than the same loss 30 years ago when account balances were small.
I also define risk to be the risk of loss, rather than volatility. Combining these concepts, I have calculated the dollar-weighted downside deviation of returns over 40-year periods. The dollar weights are account balances through time. Downside deviation measures the variance below a target, and I use Treasury bills as this target, so it is variance of returns below T-bills.
I contrast a glide path that progresses forward through time with decreasing equities to the same glide path executed in reverse with increasing equity allocations. The glide path is the PLANSPONSOR On-Target Index (OTI), which is entirely in risky assets (equities and bonds) for the first 20 years and then increases its cash allocation over the next 20 years. The proxy for risky assets is 70% S&P500 stocks and 30% Citigroup High Grade Bonds. The proxy for risk-free assets is Treasury bills. The hypothetical investor contributes $1,000 initially and increases this $1,000 by 3% per year (representing the average inflation rate), so he contributes $1,030 in the 2nd year, $1,061 in the 3rd year, etc.
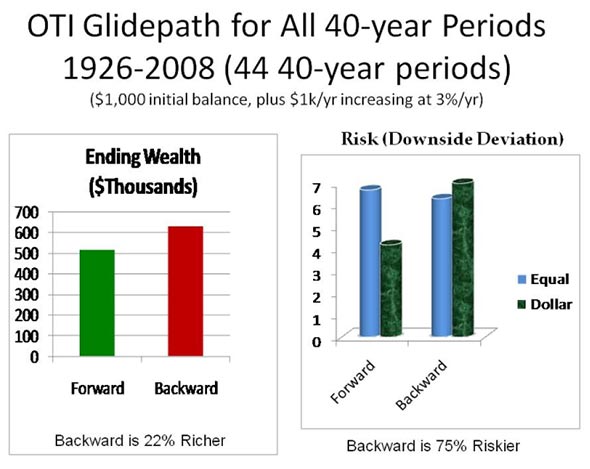
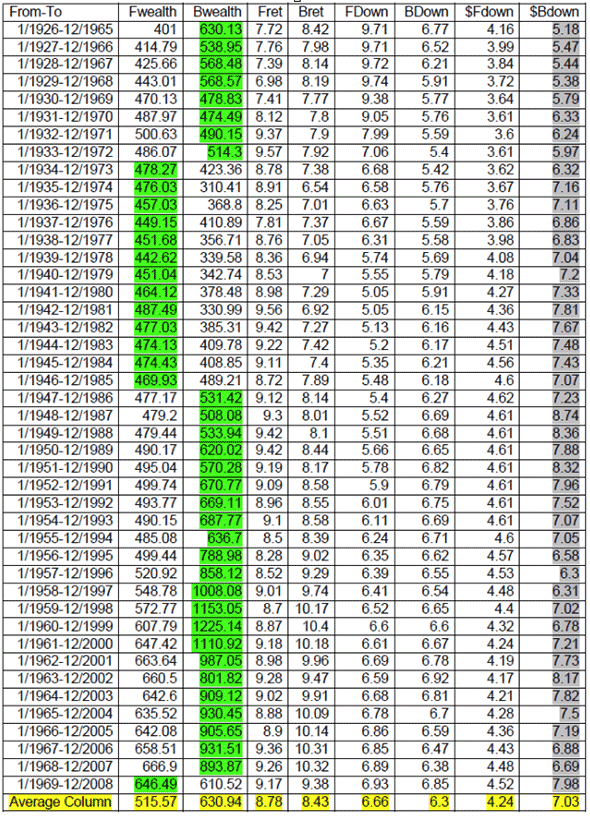
At the end of this article you can find details on the 44 40-year calendar periods from 1926-2008 displayed in a table. There is a lot to be learned from this table. Here are some highlights:
• Average ending wealth for the backward path is $630,940, and is 22% greater than the corresponding $515,570 ending wealth for the forward path, even larger than the professors’ 12.5% improvement.
• Forward beats backward in 13 of the 44 40-year periods, which is 30%, substantially greater than the 10% in the study.
• Annualized returns and equal-weighted downside risks are about the same moving forward or backward.
- Dollar-weighted downside deviation for the backward path is substantially higher in all periods, averaging 75% higher than the Forward path. Compare the last column in the table to the column just left of it.
- Dollar-weighting risk reduces the forward path’s downside measure below its equal-weighted number, and increases the backward path’s risk. This approach converts risk from a measure of fractional loss to one of wealth loss. Compare columns FDown and BDown to $FDown and $BDown.
In other words, increasing one’s equity allocation creates 12.5% (the professors’ result) to 22% (my research) greater wealth, but at a whopping 75% increase in risk. That’s a lot of pain for not all that much gain.
Some believe that I’ve concocted a measure – dollar-weighted downside deviation – to make a point, but that’s simply not true. I want to use a metric that captures the risk of loss of wealth rather than the fluctuation in returns. Although the unweighted volatility of returns for the backward path is similar to that of the forward path, the volatilities of wealth along the glide paths are quite different. We know that the backward approach is a higher risk wealth path because it exposes assets to more risk when account balances are high. Unweighted return volatility does not capture this fact; dollar weighting does. After all, isn’t it wealth that concerns us most?
The following exhibit summarizes the key conclusions.

In a similar vein, some have suggested what I would call “contingent glide paths,” designed to react to the investment and savings experience, specifically targeting objectives. You take less risk if your objectives have been achieved, and more risk if they have not. This may make sense, but can only be applied to individual accounts. The Pension Protection Act of 2006 specifies three Qualified Default Investment Alternatives (QDIAs): Target Date Funds, Balanced Funds, and separate accounts. The first two QDIAs – Target and Balanced – are comingled vehicles (mutual funds and commingled trusts).
Separate accounts are individualized and could adopt a contingent glide path. These solutions are usually more appropriate for the wealthy, since they typically have significant minimum account balance requirements.
Conclusion
The issue is measuring risk in target date funds. Few if any would recommend a 100% equity exposure at retirement, yet traditional risk and reward measures indicate that a glide path with increasing equities, rather than decreasing, results in greater wealth with about the same risk – a significant winner for those saving for retirement.
Our intuition tells us that retirees can’t “afford” taking that much risk, but traditional risk measures argue otherwise. We need an alternative risk measure that captures the importance of protecting account balances near retirement, because retirees have limited opportunities to make up losses by working longer.
Additionally, the pain of loss increases as retirement nears. 2008 is a good example. The recent joint hearings of the SEC and DOL focused on losses in 2010 funds rather than 2050 funds, even though losses were greater in 2050 funds. 2010 funds are intended for participants at or near retirement while 2050 funds are for those who are currently 25 years old.
If a retiree has $500,000 for five to 10 years as retirement approaches, he will get used to that and plan around that number. If the number is $600,000, the retiree will probably be not much happier because he hasn’t been assessing their situation relative to the $500,000 alternative path. Rather, he deals with the current reality, and adapts to it. But in either case a 20% loss is devastating, much more devastating than a 20% loss would have been 30 years earlier. The challenge is to create a risk measure that captures this spirit. Dollar-weighted downside deviation accomplishes this, because account balances are higher as retirement nears.
Here are details for the last three years of the 40-year paths that end in December, 2008.
This brings home the idea of wealth risk:
Ending wealth ($Thousands)
|
Decreasing Equities |
Increasing Equities |
2006 |
607 |
772 |
2007 |
640 |
812 |
2008 |
646 |
611 |
Yes, 2008 was an extreme, but it can teach us a lot. Both paths above end in about the same place, but I’d personally prefer the path on the left.
Comparisons of 40-Year Glide Paths: Decreasing (Forward) versus
Increasing (Backward) Equity Allocations
The columns in the following table are as follows:
Fwealth: Ending wealth when the glide path moves forward, ending at zero in risky assets
Bwealth: Ending wealth when the glide path moves backward, ending at 100% risky assets
Fret: Annualized return using the forward glide path
Bret: Annualized return using backward glide path
FDown: Equal-weighted downside deviation for forward path
BDown: Equal-weighted downside deviation for backward path
$Fdown: Dollar-weighted downside deviation for forward path
$Bdown: Dollar-weighted downside deviation for backward path