Advisor Perspectives welcomes guest contributions. The views presented here do not necessarily represent those of Advisor Perspectives.

That's inches away from being millimeter perfect.
Ted Lowe, retired BBC snooker commentator
Introduction
September has historically been the worst performing month for US stock markets, losing 1% on average over the past 85 years, while the average return in the other 11 months was a positive 1.3%. Not so this September, with its 9% gain, bringing the year-to-date return up to 5%, and reversing a 4% cumulative loss through August. This September was the best September since 1939.
So much for history repeating itself.
In the following, I review year-to-date stock market performance around the world and remind you that investment manager due diligence will benefit immensely by replacing peer groups with a scientific alternative. I give you the information you need - PODs - to accurately evaluate your managers’ investment performance. I also give you an excellent interactive tool - Style Scan - to understand the current stock holdings of your portfolios
Client-facing consultants should be worried about the due diligence that you and your clients rely upon. We can and should be “millimeter perfect,” rather than settling for being inches away, as observed in the quote that introduces this commentary. Annual end-of-year reporting season is around the corner so now is the time to seek out the best. If you’ve been concerned about the accuracy and depth of your performance reporting now is the time to fix it.
Following the discussion of performance evaluation tools, I conclude with a brief description of the confusion and controversy surrounding target date funds, which are increasingly more popular and important.
As always, feedback is much appreciated.
Year-to-date stock market performance
The US stock market’s 5% return in the first nine months of 2010 was below its historical average, but it’s good to see positive returns, and many segments of the markets have performed quite well. For contrast, the Citigroup high-grade corporate bond index was up 16.4% year-to-date, which is quite extraordinary.
As the chart below shows, large-cap US companies have lagged the overall market with a 2% return, while mid- and small-sized companies have done substantially better, earning more than 11%. Smaller companies led the 2009 rally and continue to dominate in 2010. I use Surz Style Pure® style and country definitions throughout this commentary, as described here.
Smaller has been better, which is somewhat surprising given the current angst about the economy; you’d think investors would feel safer with larger companies, and those companies would attract more capital. Smaller companies have now outperformed large for the past 21 months.
Here’s my explanation for this smaller company dominance. Investors perceive that larger companies are more exposed to looming pitfalls, like tax and inflation increases; “too big to fail” is no longer the order of the day. In this environment, revenue and momentum, not size, is king.
Within the large company segment of the US market the various style indexes have different results, as shown in the next exhibit. Style definitions mattered in 2010. For a detailed discussion of the different style definitions being used by index providers please see Style Conscious. These differences are important because they affect our perceptions of manager success or failure. Which indexes do you use?
On the sector front, Consumer Discretionary stocks fared best with a 15.5% return, followed by Industrials with a 12% return and Materials with an 11% return. All other sectors had single-digit performance. Industrials lagged in the 2009 recovery, so their relatively good performance is consistent with a catch-up, or regression toward the mean. By contrast, the good performance in the Consumer Discretionary sector is a continuation of good results in 2009, representing momentum and investor confidence in the consumer. Healthcare, Technology, Energy and Consumer Staples lagged, earning less than 2%.
Let’s look outside the US, where 2009 market performance far exceeded domestic returns. The first nine months of 2010 has been a repeat story, with foreign markets returning 10% (in US dollars) in aggregate, doubling the US 5% return. Like the US markets, smaller foreign companies fared best, with mid- and small-foreign stocks returning 16% while large companies returned only 7%. Even more dramatically, EAFE and ADRs lagged with just 2% returns because of the combined effects of smaller companies and disadvantageous country allocations. Latin America led the first nine months of 2010 with a 28% USD return, followed by 19% and 16% returns in Emerging Markets and Asia-ex-Japan.
Getting real about performance evaluation: ditch peer groups
As usual, there will be challenges in fairly evaluating investment managers through September, 2010. Most advisors know that traditional peer groups are pathetic barometers of success or failure, but they still believe that there are no better choices. They’re wrong, and it’s not just my opinion. I was recently reminded that Certified Financial Analysts (CFAs) study the flaws in peer groups. A sample of required readings is as follows (look familiar to you CFAs?):
- Ankrim, Ernest M. “Peer-Relative Active Portfolio Performance: It’s Even Worse Than We Thought.” The Journal of Performance Measurement, Summer 1998, pp 6-11.
- Bailey, Jeffrey V. “Are Manager Universes Acceptable Performance Benchmarks?” Journal of Portfolio Management, Spring 1992, pp 9-13.
- Bleiberg, Steve. “The Nature of the Universe.” Financial Analysts Journal, March/April 1986, pp 13-14.
- Eley, Randall R. “Database Dysfunction.” Pensions & Investments, September 6, 2004, page 12.
My contribution not only documents the problems but also provides an alternative and is available for your reading pleasure at Peer Group Article.
We’ve known for a long time that peer groups don’t work. Client-facing consultants should refuse to use peer group because they’re much more likely to mislead than to inform. Peer group comparisons lead to bad decisions.
Hypothesis testing is a far better approach. Success or failure is determined by comparing the manager’s actual result to all of the other choices he could have made. After all, performance evaluation is a test of the manager’s judgments. Can the manager outperform the hypothetical monkeys playing his game? All of the possible portfolios that a manager could have held are created using simulation techniques. Importantly, this approach enables the determination of statistical significance over short periods of time, whereas regression analyses require decades to reach similar conclusions. In the following exhibit we provide Portfolio Opportunity Distributions (PODs) for the S&P500. Hypothesis testing for periods ending 9/30/10 are available now, whereas most peer groups won’t be released for a month. As David Loeper, President of FinanceWare says:
“It escapes me why so many wait for biased and inaccurate, or at least misleading, universe data when they can get unbiased data almost immediately following any calendar quarter or month.”
Use the table and graphic below to evaluate your investment managers. For example, a return of 10% for the year ending September, which would appear to be good on its surface, is in fact merely the median return. But examine longer time periods and a mere breakeven (zero) return is a winner, with the exception of the seven years ending 9/30/10. It’s been ugly.
And I have another gift for you as well – free holdings-based style analysis. Please bring portfolio holdings, or just a few stocks that you like, to the portal at Style Scan. You’ll get an X-Y style scatter and a detailed report of the style and sector composition of your portfolio. The next step after performance evaluation is attribution, which determines why performance is good or bad, and style analysis is a key component.
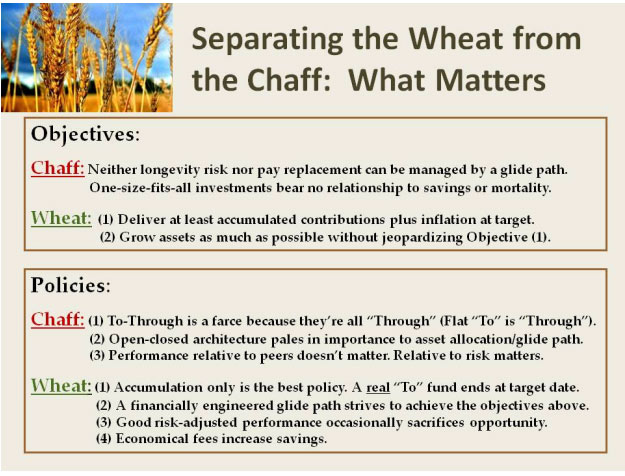
A quick look at the confusion and controversy in target date funds
Target date funds are growing in popularity and importance despite the significant confusion that surrounds them. That’s why we’ve scheduled a Webinar for 2:00 EST on Wednesday 10/28, so mark your calendars. Entitled “Fiduciary Best Practices in Target Date Funds,” we’ll separate the wheat from the chaff because much of the confusion revolves around the chaff - the garbage that just doesn’t matter. Fiduciaries have the responsibility to set objectives for target date funds and to select funds that are appropriate for achieving those objectives. The next exhibit gives some examples of the “wheat” and “chaff”:
Read more articles by Ron Surz