Current account deficits cannot be sustained because a country will ultimately exhaust liquidity assets or borrowing capacity. Surpluses in the balance of payments of a country are more easily supported, but put pressure on other countries and parameters in the system.
Charles P. Kindleberger
Historical Economist
The mutual fund industry grew explosively from the 1980s on a rare tonic of a low-inflation credit expansion powered indirectly by international trade flows. That run reached a peak in 2008 when the application of quantitative easing (QE) served to prevent industry collapse with a softer form of transition, which continues today but must end when inflation returns.
Inflation, a direct concern for fixed income investors, presents an even larger issue for the fund industry because when it does appear, it will be indicative of trend reversals in international trade and capital flows, which have been supportive of the fund industry expansion. This reversal, caused by QE, will usher in a multi-year shrinkage in the fund industry, which will become apparent as early as year-end.
Passive investing will be a loser relative to active investing in the downtrend. The revival of active investing will take hold as it becomes increasingly clear the ability that skilled active managers can demonstrate as the tide shifts will generate an outsized positive response. Successful active managers tend to be capital-preservation focused, unconstrained, and operate within a framework grounded in history, politics and common sense.
This is the final essay in a 3 part series. Part 1 detailed the demographic tailwinds that benefited the development of the mutual fund industry and challenge its future.
Part 2 provided the historical framework which explained how expanding credit, which peaked in the years 1930 and 2008 was, in both the Great Depression and current eras, supported by years of unbalanced trade leading to asset bubbles. The focus of Part 2 was the Great Depression and how the gold standard did not serve its purpose of moderating these imbalances and was thus abandoned.
Part 3 picks up the timeline from1945 and explains how in the move to a full fiat-based monetary system, the inflation and high interest rates of the 1970s were providing a similar check as gold. The policy means used to circumvent these checks have led to even larger systemic imbalances, necessitating QE as a policy measure to unwind them.
QE will have implications for the mutual fund industry. The trends QE will eventually reverse have been supportive to its formation and growth.
To appreciate how mutual fund industry growth is tied in to a persistent trade deficit requires a brief overview of these economic developments and government policy from where we left off in part 2. Thereafter, I review implications today for bond- and equity-fund flows.
1980s mutual fund boom grew from fallout of the 1970s
Prior to the 1970s, there was little need to tinker with a naturally strong and expanding economy. The period from 1945 to 1971 saw GDP increase by a factor of 3.6 compared to government debt, which only rose by a factor of 0.7. US trade surpluses and a massive increase in private debt levels of 11.8 kept unemployment low and saw personal incomes steadily rise. Baby Boomers born into these favorable conditions benefited from the exceptional wealth creation legacy of the era and the force of their numbers helped drive the mutual fund industry.
Under the Bretton Woods construct, the US dollar, fully convertible to gold, continued its climb as the international reserve currency. By the late 1960s there was consensus that the dollar exchange standard was in need of revision in order to properly reflect the changed global landscape and shifting balances. The growing impracticality of maintaining the system led to the closure of the gold window in 1971. Conventional wisdom suggested this was caused by the pursuit of unsound US fiscal policy. (Appendix 1 provides a different perspective).
1970s tinkering to improve trade unleashes inflation
The 1970s, as will be demonstrated, was not a period of growth for the mutual fund industry primarily because of inflation. Goods inflation worked in a manner and played a role that one would expect it to in a fiat monetary system acting as a check against poor policy.
It is important to understand how this differs from today. To improve a marginally deteriorating trade position and employment in the early 1970s, Nixon purposefully led two devaluations of the dollar. In this period, Japan recorded its first trade surplus with the US on the surge of low cost electronics and the start of the Japanese auto invasion (1971 marked the historic entry of the affordable Honda 600). Today’s more popular view that small current account deficits are benign was not mainstream. In fact, growing protectionist sentiment pressured Japanese companies to begin manufacturing products in the US and led to a voluntary imposition of export quotas. The rules of the gold standard (reviewed inpart 2of this series) continued in principle to be understood between trading nations. Specifically, trade partners were not as accepting as they are today of countries that rely upon sustained trade surpluses for their own economic growth and development.
The Philips Curve provided flawed support for Nixon’s plan to boost unemployment by accepting a small amount of inflation. Instead of this benign outcome, the market anticipated rising prices and priced in higher interest rates in advance. Spiraling inflation and increased unemployment resulted.
Until that point in time, Gibson’s Paradox, made popular by Keynes in the 1930s, and supported with data from periods during the gold standard, supposed interest rates did not behave in this manner. Inflation was understood to be a transitory event and part of a properly working fixed exchange rate financial system. Rates therefore did not factor a premium for the expectation of inflation. Unlike under a gold standard, where cycles of inflation and deflation were the norm, after WWII prices slowly moved upward without correction. Once the dollar was no longer anchored to gold, a government policy of this nature was understood to be permanent. Once expectations are built into prices, the inflation rate, spiraled beyond the small measure of devaluation that was intended by policy makers.
In addition to high inflation, unemployment and reduced real purchasing power, the 1970s produced no increase in real GDP. Despite marginally small trade surpluses in 1973 and 1975, the policies impoverished Americans and drew them with even greater need to embrace lower cost imports. The eventual “solution” delivered by Paul Volker in the 1980s proved also to be an elixir for the mutual fund industry, and would herald the “Return of Gibson’s Paradox” where expectations of inflation were no longer factored into expected interest rates - even without a gold standard.
But there were a few twists and turns before we could get to that point.
Volcker’s inflation fighting leads to an even greater need to address trade deficits
Ideas, knowledge, science, hospitality, travel — these are the things which should of their nature be international. But let goods be homespun whenever it is reasonably and conveniently possible, and, above all, let finance be primarily national.
John Maynard Keynes
Extraordinary efforts to fight inflation were not coupled with restrictive trade policy. This led to further trade imbalances and eventually the need to increase employment in the US by fostering the growth of an economy that increasingly came to rely upon rising capital asset prices - including mutual funds. Volcker’s 20% Fed Funds rate in 1982 finally broke the inflation spiral and saved the US currency.
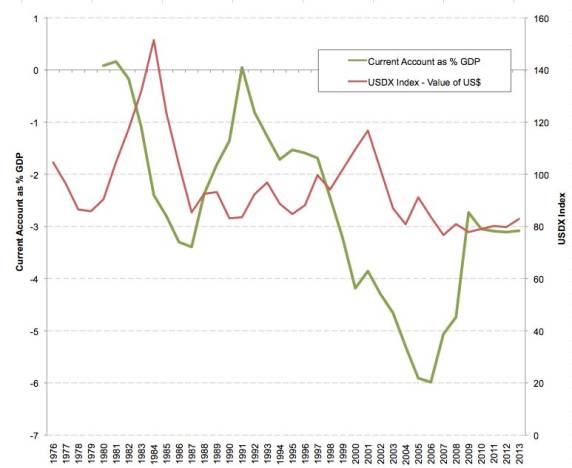
In the fixed exchange rate standard prior to 1971, the deflating impact to the economy would have likely balanced the US trade position. However, the freely floating US dollar skyrocketed in value. This strong dollar quickened the pace of imports resulting in the first current account deficit-to-GDP ratio of greater than 3% (Figure 1) below. Entire industries were ravaged by low cost imports. By 1984 the big three US auto companies were verging on bankruptcy, forcing Reagan’s hand in the Plaza Accord of 1985.
Under a gold standard, imports would have remained just as expensive as they were prior to Volcker’s shock therapy and US trade partners would not have expanded manufacturing capacity to the extent that they did (in response to increasing demand from a strong dollar). Instead, foreigners would have spent more money on lower cost US products leading to an increased need for capital investment in the US.
Reagan’s solution was not to contract the US economy a second time, but to have the major trading nations expand their economies and strengthen their currencies – thus the realization of Reagan’s Free Trade platform which was intended to build markets for US exporters. This globally coordinated effort set the precedent for all major trading nations, regardless of their balance of payments positions, to inflate their economies in unison during a time of peace and for central banks to play an active role in regulating currency values.
Figure 1 - US Current Account Deficit % GDP
Value of US Dollar – USDX Index

The current account responded in mixed fashion to the Plaza and Louvre accords. While a $2.9 billion current account surplus was reached in 1991, the trade of goods portion was still negative at $31 billion, having shown no correction in trend.
Reagan’s policies, aimed at making the investment landscape more attractive to capital investment (less regulation, small government, less powerful unions, lower lending standards, lower taxes), had the impact of stimulating the economy and capital investment, but relied upon a steadily increasing level of private debt relative to GDP.
Mutual fund boom grows out of global coordinated efforts towards US trade deficit
The increase in the trade deficit, a result of the global coordination initiated by Reagan, set off a chain of events which resulted in the US trade position being worse off. The Japanese economy suffered in the aftermath of the expansionary policies called for under Plaza. Prior to the agreement Japan was already straining under the fragile twin stock and real estate bubbles. This further expansion led to a collapse in both from which it has still not recovered. This provided no long-term increased demand for US exports sufficient to offset imports.
Japanese policy also led to the 1997 Asian currency crisis. Excess Japanese liquidity was redirected as low interest loans and ill-advised direct investment in South Korea, Thailand, Malaysia, and Indonesia. The result of the collapse of these currencies would later exacerbate the US trade deficit.
China and Mexico had already devalued their currencies in 1994. By following these two currencies lower, the entire low cost manufacturing capability of the world, whose capacity had already ramped up in response to false demand signals engineered by policymakers, was ratcheted even higher. Virtually every manufacturing concern in the developed world could now lower costs by outsourcing a meaningful component of their business to the third world.
“Mutual fund tonic” = capital flows + accommodative monetary policy + low interest rates + expanding credit
The foregoing events led to the “mutual fund tonic” referenced in the opening paragraph, beginning in the 1980s, which consisted of four elements reviewed below i) capital flows, ii) accommodative monetary policy, iii) low interest rates, and iv) expanding credit.
Capital flows
The US became indifferent to the offshoring of manufacturing and increasing trade deficits, given returning capital flows that grew GDP and employment, lowered inflation rapidly expanded financial services industries such as mutual funds.
The program to replicate the Japanese export-driven growth miracle for China and SE Asia required that they fix their currencies to the US dollar. Doing so created an endless demand for dollar-denominated assets as trade surpluses had to be recycled to maintain the pegs. In the early 1980s, the surge in Japanese demand for high interest paying Treasury bonds brought welcomed relief from high interest rates and inflation to the US. The trend of declining interest rates supported the growth of credit in the US, serving the pent-up housing needs of baby boomers, thus fueling housing bubbles in the US. The follow-on surge in demand for US fixed-income assets from Asian trading partners beginning in the mid 1990s was supportive of risk assets generally and led to the tech and telecom bubbles and overvaluation of many segments of the stock market.
Accommodative Fed policy
A 1987 research piece by the Richmond Fed embodied the changed views for the proper role of monetary policy that were shaped in the post-war period. The Fed was no longer tasked with deflating the economy in order to return the money supply or price levels to earlier lows. “Given their responsibility for macroeconomic stabilization, central banks regard price level instability as costly … it is desirable for the Central Bank to regard past money growth, in part, as ‘bygones’ so that the money stock and the price level wander over time,” claimed the author of that report. The Fed was left to “smooth price level and nominal interest rate movements occasioned by transitory disturbances to money demand, aggregate supply, and the real interest rate.”
Low interest rates (and more accommodative policy)
In a series of speeches beginning in the late 1990s Alan Greenspan stated that low cost offshore production was the reason behind the low inflation rate. With this he also saw the risk to the financial system that unsustainable debt levels could cause:
To sustain good inflation performance, we need to understand the other factors that lie behind our recent success, … emerging nations, especially in Asia and Latin America, have become increasingly important as production sites and markets and thus as competitors. Faced with this broadened foreign competition, firms in many countries now find it less easy than in the past to raise prices during periods of rising demand at home.
This concern broadened over time to include the transformation of the US workforce, industrial economy, and challenges for monetary policy that importation of deflation brought. In 2004 he began referring to recycled capital funds from trade surplus partners as the world’s “savings glut” when it became clear that deflation was a greater concern than inflation evidenced by the Fed’ s inability to influence an increase in the 10-year Treasury yield as it previously was able to through increasing the Fed Funds rate.
By 2006, when Bernanke became chairman of the Federal Reserve, the US economy had been powered for over 30 years by monetary policy that bore no resemblance to earlier forms that focused on long-term price stabilization and sustainable credit growth. Given how highly dependent the financial system had become upon asset-based leverage and rising prices, the only reasonable expectation to be placed on one in his role was to somehow avoid systemic collapse and manage transition to an economy based on stable trends. His identification of the trade and capital flow dynamic as a destabilizer through its connection to increasing asset prices is critical to understanding QE in its fuller context as a trade policy and the implications for the mutual fund industry:
For the world as a whole, total savings must equal investment, and the sum of national current account balances must be zero. Accordingly, in the industrial economies, realized saving rates had to fall relative to investment, and current account deficits had to emerge as counterparts to the developing countries' surpluses. This adjustment could be achieved only by declines in real interest rates (as well as increases in asset prices), as we observed.
Expanding credit
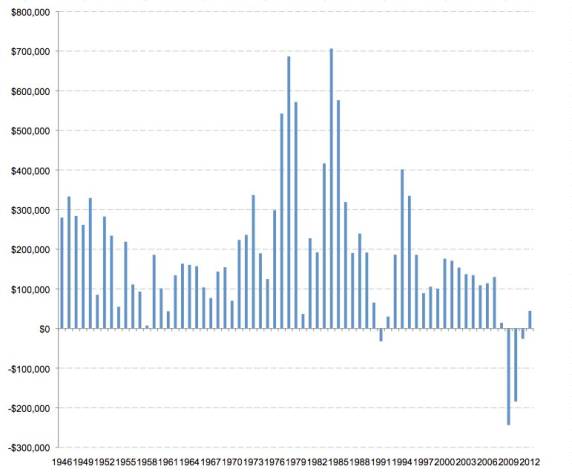
With the sole exception of 1991, the consumer added debt every year from 1946 to 2008.
Figure 2 - Change In consumer debt ex student loans 1946 - 2012
2012 dollars
Source: Federal Reserve Z-1 Release, Consumer Credit, Professor Robert Schiller CPI data series
The mutual fund tonic in action – buying behavior completely transforms
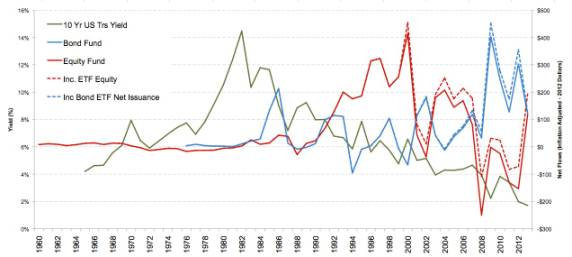
In Warren Buffett’s view, the inflation of the 1970s was not supportive of equity returns, which was reflected in net outflows for equity mutual funds (Figure 3) during this period. Blanket statements suggesting that equities provide superior protection during inflation need to be scrutinized even in today’s ultra low rate environment. Also, the universal assumption that an inflationary event will be met with a transfer of flows from fixed income into equities ought to be tempered – first, because of the reasons expressed in this paper and secondly, because our collective instincts have been trained by 31 years of conditioning to know that interest rate increases are temporary and followed in quick succession by a lower low in long term rates and stimulus (conditions which may not hold in the future).
Further, today’s household balance sheets may be less practical during a period of rising or even flat interest rates, especially if capital asset prices are not keeping pace with inflation. In such cases, any shift toward equities from fixed income assets will be preceded by a decision whether or not to use those proceeds instead to pay down debt. Bond-fund flows, while sluggish, were positive in the 1970s.
Once the period of high long-term interest rates was reversed in 1982, the steady flows for mutual funds were replaced with our more familiar experience of multi-year boom and bust (but mostly boom) in terms of both the performance of investments and flows into funds. While bond funds were an unpopular choice during the tech/telecom craze and following 1994 (the worst year for bond performance in the US), they have yet to encounter the severe prolonged selloffs more common to equity funds. Adding data for ETFs (dashed lines) does not affect the trends.
Figure 3
Net flows into mutual funds
Inflation-adjusted - 2012 dollars
Source: ICI Private Data Series, Mutual Fund Historic Net Inflows, ETF Historic Net Issuance, 2013 estimate only based on YTD data using Jan, Feb representing 43% 2013 data point, Robert Shiller CPI Data Series
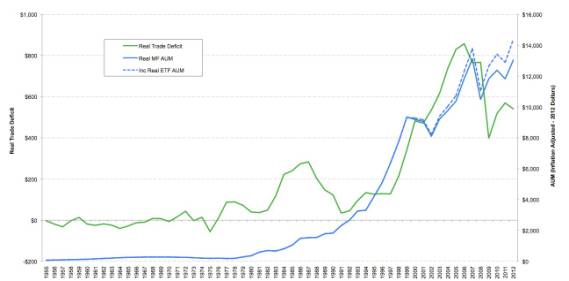
The mutual fund industry has seen an explosive growth since the 1980s which for reasons already explained has occurred alongside a widening trade deficit (Figure 4).
Figure 4
Mutual fund industry total assets
US trade deficit
Inflation-adjusted 2012 dollars
Source: Concept Paul Franchi, BEA International Transactions, ICI, Professor Robert Schiller CPI Data Series online
The current downturn in the trade deficit, shown in the figure above, will continue. For reasons I will further detail, it will not be followed by supportive capital flows similar to 1991. At some point, mutual fund AUM will be lower as well.
Expect a major outflow event in traditional bond funds - not “if” but “when”
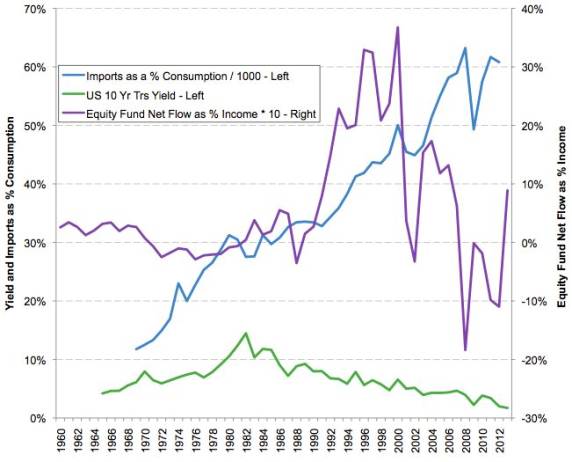
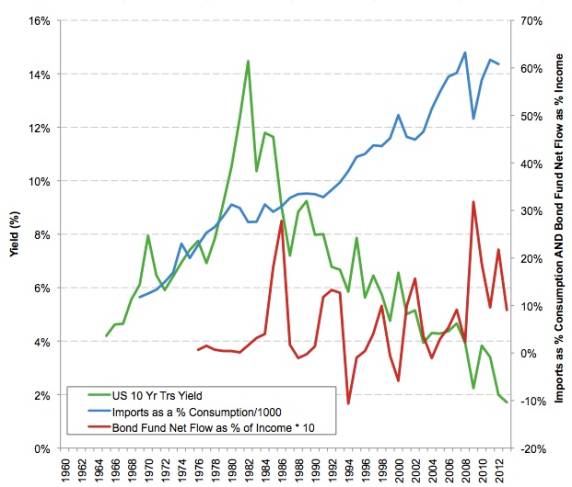
In Figure 5 below, I show the relationship between bond net fund flows, patterns of import consumption, and the 10-year Treasury bond yield. Imports as a percent of consumption (blue line) increased over the entire period under review. Greenspan’s conclusion that imports were responsible for containing inflation is reflected in the 10-year US Treasury yield (green line) which broke in 1982 and has fallen ever since.
The red line, the ratio of total net flows for bond mutual funds as a percentage of national income is a measure of aggregate bond fund investor behavior and demonstrates the change in behavior post 1980. The bond fund industry AUM was built on a series of violent multi-year herd-like “surges” which ended each time at different equilibrium levels.
Figure 5
Bond mutual fund net flows relative to income
Imports relative to total consumption
Source: Concept Paul Franchi, Bureau of Economic Analysis, GDP, National Income and Product Accounts, Professor Robert Shiller fixed income yield data series, ICI Private Data Series, Mutual Fund Historic Net Inflows, ETF Historic Net Issuance, 2013 estimate only based on YTD data using Jan, Feb representing 43% 2013 data point
After a low reached in the 1994 bond debacle, it took until 2004 and two separate surges before the cyclical low point sustained above the 1970 level. Successive surges continued and ended at higher and higher low points. One reason for this behavior is because greater than 75% of mutual fund investors are aging baby boomers interested in scaling risk down as they enter retirement.
When the import consumption trend turns down, imports will no longer work as effectively in containing inflation for reasons further explained below. This will lead to a shakeout in bond funds (red line turning down) which will exceed the 1994 decline. In 1994, while long-term bonds did temporarily fall in price by 20%, not only did they ultimately recover – they also paid 7-8% coupons, rewarding loyal investors while they waited. Despite this, the skittish multi-year behavior that followed shows that in any interest rate-driven selloff from current nose bleed heights, affected investors will clamor for an alternative. Many will leave fund investing altogether and purchase fixed annuities over the objections of their advisors.
The coming rush to active, opportunistic, unconstrained and alternative bond mutual funds
Throughout the downturn, the private sector marketing machine will take aim at the index fund and ETF industries. Active managers with good numbers throughout the selloff will be deluged, thereby tempering the speed of the decline in AUM - but slicing through the 1994 level is a given.
Any major mutual fund company today that limits itself to a traditional broad lineup with little in the way of opportunistic and alternative bond funds (or does not at least have one or two such funds in incubation) should reconsider its strategy. Over the period of a rising interest rates, shorter duration bond funds will be held, especially when long-term rates cross the magic 5%.
Interest rates to pick up as QE impacts trade
We have seen a number of episodes in which international capital flows have brought with them challenges for macroeconomic adjustment, financial stability, or both. Such challenges have tended to arise … when the “rules of the game” of the international monetary system–the policy responses that countries are expected to take to help foster a balanced global economy over time–are either poorly articulated or not observed by key countries.
Ben Bernanke Feb 18, 2011
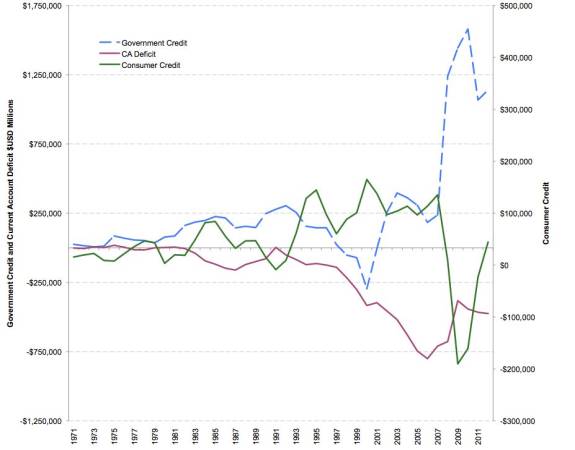
The greater risk to the mutual fund industry that inflation brings is the loss of overall support for capital assets which QE will cause as it unwinds the trade deficit (which will be the event that sparks inflation). The figure below plots the nominal current account deficit (red line) against consumer credit (green line). As the current account sank to its low at the height of the credit bubble, spending and the green line of credit collapsed. As shown (in Figure 2 above), this is a multi-generational event which, left unchecked, would have marked the onset of the second Great Depression.
The blue dashed line plots the change in total government credit instruments. Henry Paulson, under Bernanke’s guiding hand, purposefully injected government credit into the financial system that symmetrically matched the collapse in private credit supporting the nominal prices of asset based leveraged credits. The deflationary collapse thus averted, economic activity returned and consumer credit bottomed and returns to a positive.
Figure 6
Consumer credit, federal government credit, current account deficit
Source: Concept Paul Franchi, Federal Reserve Flow Of Funds Z1, consumer credit, Federal Government Credit Instruments Liability, Bureau of Economic Analysis Balance of Payments
However, the current account deficit did not correct to surplus. An historically large trade and current account deficit persisted, but are now supported by government debt expansion which is also unsustainable (especially in light of the fact that the government is not using the debt to finance return-generating activity). The government cannot stop expanding debt in the near term or private debt deleveraging will resume.
Quantitative easing a transition tool … to something different
Credit securities acquired through QE are not “true debt” taken on by the government because the Fed is growing its balance sheet in close measure to the incremental debt assumed (printing money). This holds the financial system in place at a low rate of inflation because surplus trading nations will mop up excess liquidity … for now.
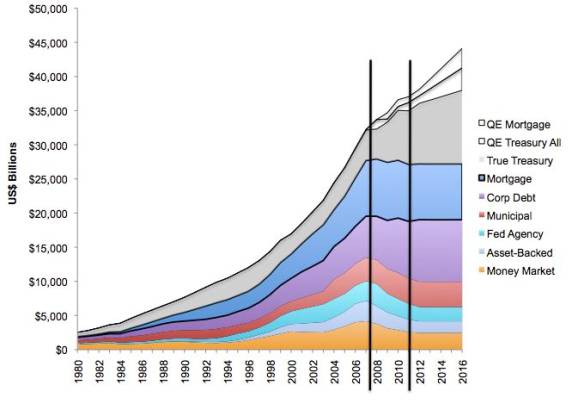
In an ideal case (Figure 7), US households could decrease debt as they began to do in 2007 (reflected by the first six layers in the chart which represent privately issued debt). Government debt (the top layer) will continue to increase as I have projected to 2016 but a good deal of the debt will be owed to itself. The two hollow sections represent the actual and stated planned amounts of Treasury securities the Fed has committed to remove from the market both directly in Treasury purchases and by earmarking proceeds of mortgage back securities for future Treasury purchases.
Figure 7
Outstanding US bond market debt USD billions
Source: Concept Paul Franchi; Federal Reserve Annual Reports; SIFMA
As Kindleberger opined in the opening quote to this paper, a trade deficit cannot be sustained indefinitely since a country ultimately exhausts its borrowing capacity, an event we have already experienced during the Depression.
The globalized system of financial trade and capital flows has already demonstrated that it is unable, on its own, to self-correct. The remedy of expanding government debt has also demonstrated that it does not, as a lone measure, permit the unwinding of the current account deficit (Figure 6). However, by adding QE to the mix, a reversal of the unsustainable trends is guaranteed. While deflationary collapse is avoided, the alternative forced unwind will carry a cost of its own.
Foreign trade partners will eliminate our current account deficit to protect their own self interest
Trade surplus partners with fixed exchange rates must constantly weigh the opportunity cost of continuing to export capital to the US (and thereby maintaining their hard won export income infrastructure) against the alternative of allowing their currencies to rise (fueling reciprocal trade and possible trade deficits). Over time the cost of foreign central banks acquiring US dollar instruments will become much greater than the benefit. In order for a foreign central bank to hold down the value of its currency, it must issue local currency to buy US dollars and then mop up the same amount of local currency with local currency bonds to minimize the risk of inflation. These actions will have an increasing cost since the interest rates paid on domestic debt are typically higher than that paid on US debt securities.
Today, there are two primary bidders for US debt securities: the foreign central banks of those countries with trade surpluses with the US (who draw the US dollars at a high cost from the local economy), and the US Federal Reserve. The first bidder must sell products at artificially low prices in an economy where domestic consumption has been suppressed by policy (see here), while the other bidder electronically “prints” US dollars.
At some point this process will cease, unwind and then gather pace. Increasing debt on the US end and purchasing more imports will not serve to contain inflation as it has done in the past. Imported goods will increase in price as a result of the rising value of foreign currencies. More importantly the natural support to the full spectrum of risk assets from these actions of foreign central banks will become less reliable. The unwinding, already beginning at the margin, will not happen suddenly. For some emerging market countries, the cost of maintaining an artificially low currency will continue to be outweighed by higher costs associated with the alternative – for some time.
Equity fund investors are already shaken - no mass exodus, just a shrinking opportunity set
Net flows to equity funds as a percentage of personal income (Figure 8 scaled slightly differently) show five clear phases in investor behavior. In the 1960s, equity fund investors dedicated a consistent portion of income to equity funds. The inflationary 1970s was marked by similar consistency, this time in net outflows. In phase 3 (1981-1984), the dollar marked its historic surge and imports jumped (Figure 1), taking the current account deep into deficit. The pull back in the blue line in the figure below was as a result of the numerator (imports) decreasing in price. Foreign capital surpluses returning to the US helped increase the appetite for equity risk creating the first asset bubble related surge of this nature. The flow was reversed after the 1987 crash. Phase 4, the 1990s stock market bubble, was a repeat of phase 3 on a grander scale. The import ratio soared from 30% to 50% and the same mechanics fed unprecedented flows into equity funds.
The pull back following the tech and telecom collapse and 9/11 marked a significant mutual fund industry turning point. Despite a reversal to a strong downtrend in the US dollar (Fig 1), there was only a ripple of a pullback in the current account deficit – it did not correct – nor did consumer credit (Fig 2). As a result of this, the equity and import lines continued to climb, suffering only a short pullback. Phase 5 was marked by a weakening US dollar and an import ratio that responded in a manner that one would not expect it to do by soaring above 60% and taking the current account deficit to depths never before encountered. The commitment to equity funds in this strange mix now reached a lower high followed by both equity and import ratios declining, along with consumer credit to never before lows in the 2008 financial crisis (phase 6). The current account deficit pulled back and held constant to 2013 to a much less severe level – but one that would have been considered dangerously high during the Reagan era.
We are currently in phase 6. The import ratio trend is broken. The power of the smaller current account deficit to fuel the mutual fund industry is weaker but it is being augmented with the addition of QE. Equity fund flows picked up in January as they tend to do seasonally. If that pace were maintained, the equity flow line would jet to a higher point than phase 5. It has not and I expect the equity fund flow measure will meander for a few years as it did between 1996 and 2000 and from 2003 to 2007 at a lower high, turn down again and bounce.
Figure 8
Equity mutual fund net flows relative to income
Imports relative to total consumption
Source: Concept Paul Franchi, Bureau of Economic Analysis, GDP, National Income and Product Accounts, Professor Robert Shiller fixed income yield data series, ICI Private Data Series, Mutual Fund Historic Net Inflows, ETF Historic Net Issuance, 2013 estimate only based on YTD data using Jan, Feb representing 43% 2013 data point
In the near future, the flow dowtrend for equity fund investors will not mirror the more violent reversal I described for bond funds. These shocks happened earlier for equities as the end point of the long term trends described came into clearer focus. This is reflected in the lower low points in Figure 8. Volatility will continue to moderate and the flow ratio will not likely plunge to the depths we just experienced.
Longer term, as QE is removed, trade and capital flows will be forming more stable trends, the cost of credit will rise over time, and the relative universe of asset-based investment return opportunities will shift from steady expansion to a gradual contraction, and the overall level of private debt to GDP will decline. The mutual fund and the broader financial services industries, relative to the total economy, will decline. To better visualize this I have included as Appendix II charts created by Professor Thomas Philippon, who has done a lot of work on the long-term trend of expansion and contraction of the financial services industry.
Over the longer term, the equity flow ratio may return to its 1960s and 1970s trends. While this will not feel good for the majority of fund companies, those which effectively leverage the investing opportunities offered by the growing productive economy of the US as well as the changing dynamic internationally will flourish.
True active equity fund managers will return
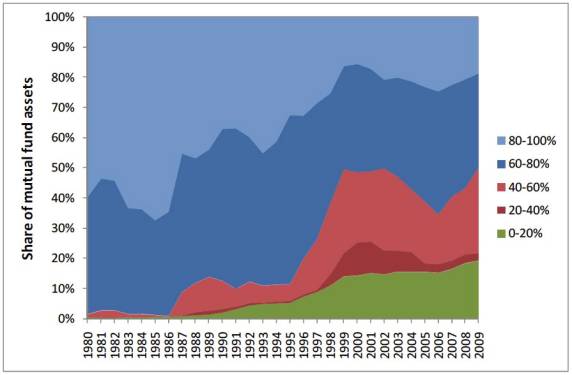
A product of the credit-induced asset price and trade trend has been the rise of the “closet index” fund manager. In a rising asset price environment, it is easier to forgive poor relative performance to a benchmark. In their now famous research, Martijn Cremers and Antti Petajisto found that, as assets in the mutual fund industry have grown, US equity mutual funds have become less active, moving from an active share of 95% to less than 50% today (Figure 9). While 20% of the total can be ascribed to true index funds, the balance is the result of closet index funds. The most active of funds (80% to 100% of weighted holdings outside their benchmark) have shrunk from 40% to less than 20% of total. These are the investors with the greatest conviction in their holdings and who, according to the research, have significantly outperformed their benchmarks compared to less active funds.
We are seeing a growing chorus of active managers coming to grips with larger, previously ignored macro factors prevailing against the markets. Research and sophistication is growing in directions such as historical and geo-political analysis that have been central to enterprise historically, but of seemingly less relevance for at least a generation. A completely passive approach might not factor a shift in a very long trend as well as an active decision maker might.
The transformation to active management on the equity side will be less a function of switching from index to active funds and more of requiring closet indexers to do more of the active management that they say they do. This discipline will be imposed by the market and many mutual funds will begin shutting on their own when a continuation of lower flow trends comes to be widely recognized as being structural in nature.
Figure 9
Evolution of active share 1980-2009
Fraction of assets in US all-equity mutualfunds in each Active Share category. The bottom category Active Share below 20% contains pure index funds, while the next two categories contain the closet indexers.
Conclusion
The issue faced by the mutual fund industry is systemic in nature, affecting all risk assets. The alternating pattern of bond and equity flows since the 1980s, contentious for reasons in its own right, is not the issue here.
It may seem odd that a $250 billion trade or current account deficit could impact a $13 trillion economy in the manner suggested. However, when viewed within a decades-long framework, the impact to the fund industry becomes clearer.
The problem we face is an old one and would be better understood by the average trade financier in 1850 than by his counterpart today, because it is trade flows grounded in the concept of money and credit which today is common in use, but not understanding. What the trade financier understood was that promises to pay, if they became sufficiently large, can lead to a spiral of self-reinforcing speculative activity that needs to be limited by as simple a means as a gold reserve requirement to avoid serious collapse.
Our financial system’s approach to credit regulation and policy makers’ response to excess credit’s telltale symptoms has led to a very lengthy program of economic transformation which has grown increasingly dependent on asset price inflation being a standard feature.
If the arrangement could last indefinitely whereby workers outside of our system sell us those items we do not want to increase in price and lend us back dollars that we spend and also hold those dollar claims as they depreciate in value and prices reset higher, then we have found a permanent solution that permits us to endlessly create credit for any means.
This arrangement needs to come to an eventual end and we witnessed the start in 2008 when the dollar soared in value. In a credit collapse, the survivors will be the ones with cash in hand. QE has allowed the favorable aspects to continue – but not indefinitely. Jens Parssons famously noted “Everyone loves an early inflation. The effects at the beginning of inflation are all good. There is steepened money expansion, rising government spending, increased government budget deficits, booming stock markets, and spectacular general prosperity, all in the midst of temporarily stable prices. Everyone benefits, and no one pays … In the later inflation, on the other hand, the effects are all bad.”
For many trading partners, the business case supporting the need to support the US dollar grows harder to defend during this transition. As this unfolds, the long-term trends discussed will shift. Financial services, including the mutual fund industry, will decline and form a smaller part of the total economy. Active management will grow in popularity as it becomes clear that some money managers have a command of these changing forces and can protect wealth better than a passive approach.
Investing will return to what it has always been about throughout history – preserving capital and the opportunity to be paid a premium for making riskier investments with it.
Appendix 1 and 2 appear on page 4 of this article.
Paul Franchi, is the founder of Strive-Equity.com, a consulting firm that assists mutual funds in executing their distribution strategies. His experience in the mutual fund industry spans a variety of roles including industry analysis, product development, marketing, sales and sales management.
Appendix 1
1965 - 1971 The real issue was gold supply
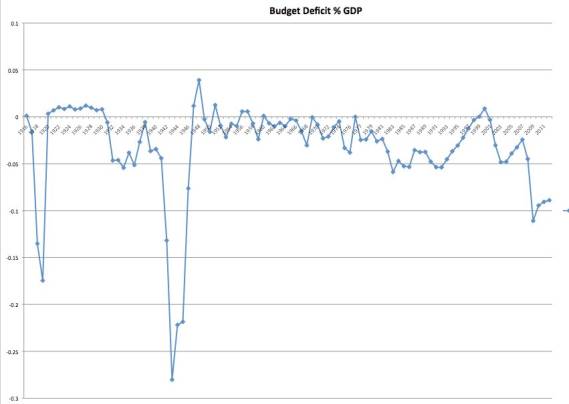
Kennedy, Johnson, Ford and Nixon were, by today’s measure, angels of fiscal prudence. Under each of their terms total US debt to GDP showed a favorable downward trend. Federal budget deficits to GDP were miniscule compared to historical lows. The bump for the Vietnam war was negligible by comparison to the two earlier wars.
Figure 10
Source:CBOE, BEA
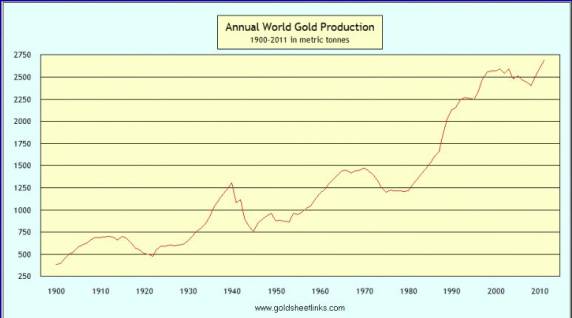
The source of the problem that triggered the inflationary 1970s had everything to do with the mishandled response to lack of gold supply. Production fell off after WWII and 1940 levels were not seen until the late 1960s.
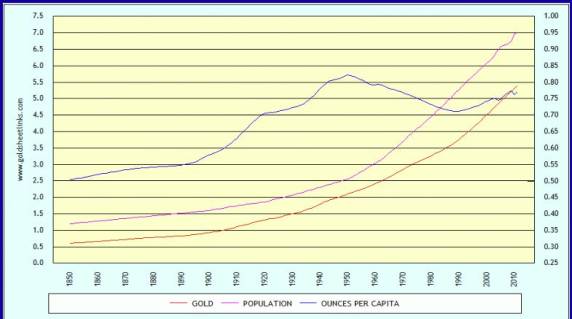
Figure 11 - Annual World Gold Production
Source: Goldsheetlinks.com
Global gold production per capita was declining steadily during a period of record economic expansion.
Figure 12 Worldwide Monetary Gold Ounces Per Person
Source: Goldsheetlinks.com
The loss of convertibility of gold for most of the world in the 1920s and the US in 1933 diluted demand for the metal. Previously, the public held more than 50% of monetary gold and Central Banks held a small share of the total, but by 1930 the public accounted for only 5%. The gold exchange standard between countries prior to 1971 functioned well. Central Banks absorbed 45% of new supply between 1948 and 1964. Gold flowed from the US to newly prosperous nations in Europe.
By the 1960s, with a continuous but slow increase in the price level and the scarcity in total supply of gold, the $35 gold fix came under pressure. Fast-growing economies demanded more reserves. However, at $35 per ounce, it was insufficient to draw a supply response. The US dollar was very clearly overvalued. This was not a novel problem, but for the US with no experience leading a gold standard financial system, the issue proved insurmountable. Rather than coordinating a system-wide revaluation of all currencies to gold, or to losing US gold, trade partners were pressured to sell their central bank gold reserves to meet demand at $35 via the “Gold Pool”. In the late 1960s, as a result, US dollar reserves held by global central banks increased above the 30% mark for the first time and gold reserves declined from 65% to 45%.
An artificially strong US dollar bid up prices of consumer items by a noticeable level in 1967. There were miniscule twin trade deficits in 1968 and 1969. In 1968 Congress passed legislation permitting the Fed to expand money supply beyond the limitations of its gold reserves. This was necessary and typical but generally only in a time of war. However, in conjunction with the closing of the gold window in 1971 this ended the role of gold as a credit creation check in the monetary system. When the gold window shut in 1971 the US was in excellent financial health.
Appendix II
There will be less “finance” in the economy
The new international financial system … has been… a major factor in the marked increase in living standards for those economies that have chosen to participate in it. It has done so by facilitating cross-border trade in goods and services that has enhanced competition and expanded the benefits of the international division of labor. Indeed, the growing importance of finance in fostering those rising living standards, especially in the United States, is the major reason the share of national incomes accruing to finance has been increasing since the mid-1970s…
Alan Greenspan - 1998
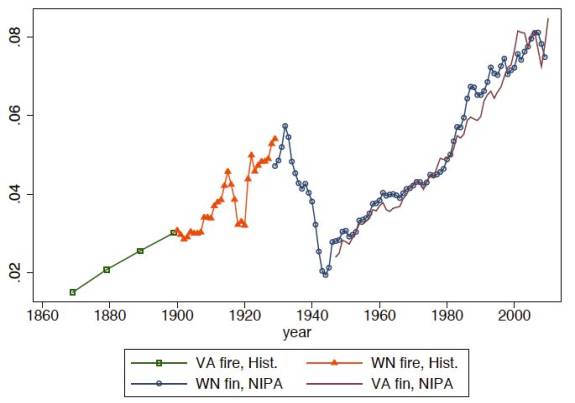
Simon Johnson, former Chief Economist for the IMF, notes that from 1973 to 1985 the financial sector never garnered more than 16% of domestic corporate profits. In 1986 this crossed 19% and in the 1990s it ranged from 21-30%. By the 2000s it reached 41%. The long term trend of overall prominence of finance in the economy is captured by measuring relative income produced from all sources relative to GDP. Figure 13 plots this data in a series prepared by Professor Thomas Philippon. As I expect it would do, Philippon’s data very closely compares to my own private debt to GDP chart directly below it.
Figure 13
Income Share of Finance Industry
Total US Private Debt to GDP
Source: Thomas Philippon, Has The US Finance Industry Become Less Efficient - VA value added, WN compensation of employees, “fin” means finance and insurance, “fire” means finance, insurance, and real estate, For NIPA the data source is the BEA, and for Hist the source is Hist Statistics of the United States
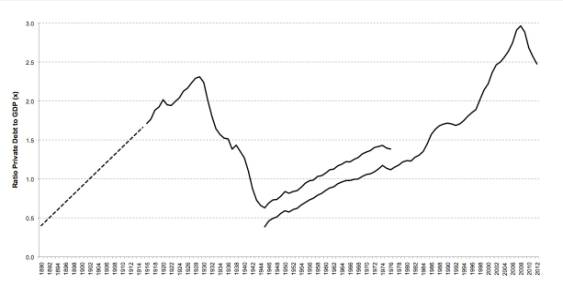
Figure 14
Private debt-to-GDP 1890-2012
(1890-1916 estimated and 1916-1929 smoothed)
Source: Concept Paul Franchi, 1916-1976 series One Office of Economic Analysis now BEA: Survey of Current Business 1969 Private Debt Series Two 1945-2012 Federal Reserve Board Flow of Funds - Non-Public Categories as of February 2013, Nominal GDP Historical Statistics of the United States Table Ca9-19 Private Debt 1890-1916 Estimate only using linear equation with 0.4 start point, Calculations - straight line linear equation - data point 1 X=1.7 X=1916, Point two Y=2.3 X=1928 slope/m =0.05 Y=0 at -94.1=B solve Y=mX+B solving where Y=0.4 x=1890
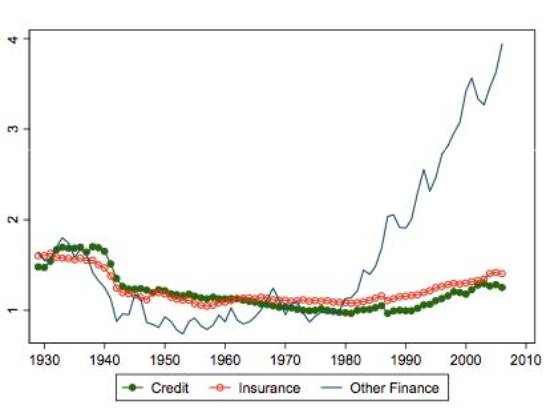
In a separate work Phillipon plots the relative skill and pay level in the US Financial sector relative to the rest of the economy. His conclusion is that “financial jobs were relatively skill intensive, complex and highly paid until the 1930s and after the 1980s, but not in the interim period.”
Figure 15
Finance Wages Relative to Non-Farm Private Sector
Read more articles by Paul Franchi
 Source: