Advisor Perspectives welcomes guest contributions. The views presented here do not necessarily represent those of Advisor Perspectives.
This is part 1 of a two-part series, “The Epidemiology of Volatility Transmission and Management.” In part 1, I use a 1927 mathematical model to illustrate the parallel paths traveled by infectious viruses and market volatility. Part 1 continues with a discussion on the role of superspreaders – in the context of both infectious disease spread and volatility transmission. Part 2 concludes with how investors can use VIX-linked securities as a left-tail risk hedge or a distinct, tradeable asset class.
How a volatility virus and pathogens collided in the COVID crisis
The COVID crisis is a human tragedy that has had an enormous impact on the global investment climate. It’s also an important reminder of the humbling and daunting task for investment professionals. We are tasked with shaping favorable investment outcomes and solutions for the investors and stakeholders we serve. As the pandemic hit, structural shifts in consumer demand due to stay-at-home orders and lockdowns wreaked havoc on prediction models slow to adapt to unusual data patterns.
The novel coronavirus and COVID-19 pandemic changed the way we live, work, eat, communicate and invest. The pandemic has brought into focus parallel paths traveled by infectious viruses and market volatility.1 Volatility, like infectious disease, is transmitted through common sources of infection.
Volatility is transmitted through investor psychology, market contagion and liquidity pressures. Volatility can be and is amplified by social media and central bank action (or inaction), through network dynamics. The COVID crisis has driven an increased appreciation for a systemic perspective and robust model to forecast volatility transmission. Investors and their advisors can gain valuable insight by applying epidemiological models to volatility transmission.
The financial system is a complex, adaptive network. It is complex because financial networks are interconnected through a cacophony of emotions and voices. It is adaptive because when external events strike, fear grips the system which causes reactive behaviors. Confused market participants alternate between panicked selling, liquidity hoarding and volatility propagation.
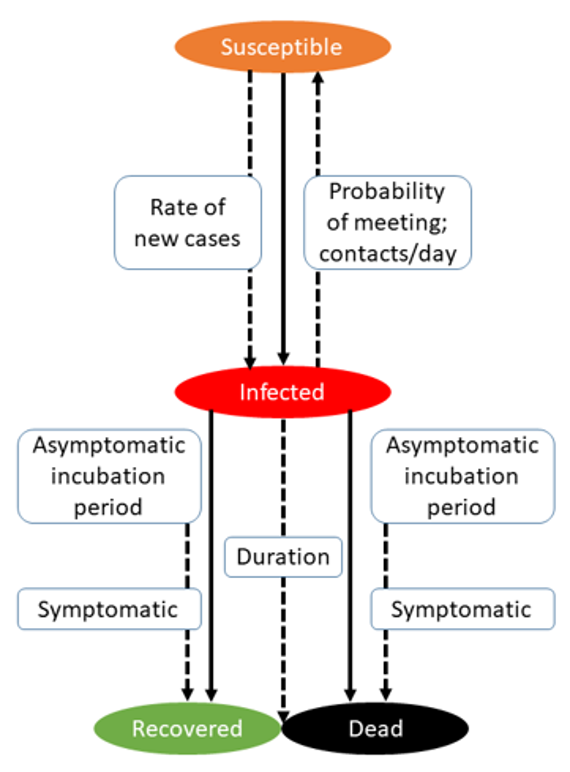
The mathematical study of infectious disease dynamics has a long history. Following the Spanish Flu of 1918-20, two Scotsmen, biochemist William Kermack and physician Anderson McKendrick, created a mathematical model of disease transmission. Epidemiology models try to predict how a disease spreads, the total number infected or the duration of an epidemic. In the Kermack-McKendrick Model (1927), they placed the population into one of three groups:
-
Susceptible. Susceptible represents the individuals not yet infected with the disease. When a susceptible and an infectious individual come into infectious contact, the susceptible individual contracts the disease and transitions to the infectious group.
-
Infectious. Infectious denotes individuals who’ve been infected and are capable of spreading the disease to those in the susceptible category.
-
Removed. The number of removed (and immune) or deceased individuals. These are individuals who have been infected and have either recovered from the disease or died.
Given the names of the three groups, their original model became known as the “SIR Model.” The 1927 Kermack-McKendrick Model is considered the canonical epidemiological model (the criteria by which something is judged). The variables indicate the number of host individuals in different states – susceptive, infective and removed. While there are numerous variations of the basic SIR model, this formulation is the basis of all modeling of the dynamics and spread of infectious diseases. One of the central findings of this classic epidemiology model is the superspreader phenomena, which will be addressed below.
Superspreaders and the 20/xx index
Many early studies on infectious-disease epidemiology assumed that susceptible hosts within a population had equal chances of becoming infected and of transmitting the infection to others.
Subsequently, in what became known as the 20/80 rule, a small percentage of individuals within any population was observed to cause and control most transmission events.
This empirical rule was shown to govern inter-individual transmission dynamics for many pathogens. Those individuals who infect disproportionately more secondary contacts, as compared to others, became known as superspreaders. Superspreading has been recognized as an important phenomenon in individual disease-transmission patterns. The role of superspreading as a significant source of disease transmission has been documented in outbreaks of measles, influenza, rubella, smallpox, ebola, monkeypox, SARS, and SARS-CoV-2 (COVID).2
The 20/80 rule, or Pareto’s rule, is that a distinct minority of individuals (~20%) cause 80% or more of infections. The measure used to estimate the impact of superspreaders is the 20/xx index. The 20/xx index quantifies the proportion of the transmission (xx%) that results from the most infectious 20% of the population.3
The same phenomenon occurs in the transmission of volatility. There is a distinct minority of prominent investors (“lead steers”) and media (traditional and social) that move markets and trigger regimes of higher or lower market volatility. John Maynard Keynes coined the term “animal spirits” in 1936. Animal spirits were awakened in 2020 by a zoonotic infection.
Many “lead steers” are the usual suspects – Warren Buffett, Jay Powell, Ray Dalio and Jamie Dimon. There are dozens of other superspreading apostles and prophets of doom and gloom or (ir)rationally exuberant touts (Mad Money’s Jim Cramer). Superspreading market movers exert outsized influence on the direction of equity, fixed income and currency markets.
News-implied volatility (NVIX) during the COVID era
Business press and social media are vital viral vectors in superspreading bouts of volatility.
The Wall Street Journal (WSJ), New York Times (NYT) and CNBC are superspreader media. Machine learning algorithms that analyzed front-page articles in the WSJ found that news-implied volatility (NVIX) peaked during stock market crashes, times of policy-related uncertainty, world wars, pandemics and financial crises. In U.S. post-WWII data, periods when NVIX was high were followed by periods of above-average stock returns, even after controlling for forward-looking measures of stock market volatility. News coverage related to wars and government policy explained most of the time variation in risk premia the measure identifies.4
Over a longer (1890–2009) period that includes the Great Depression and two world wars, high NVIX predicted high future returns in normal times, and rose just before transitions into economic disasters. The evidence is consistent with recent theories emphasizing time variation in rare disaster risk as a source of aggregate asset prices fluctuations. Those researchers concluded, “NVIX is a statistically powerful predictor of the actual VIX Index®.5
The coronavirus crisis is exhibit A for under- and over-reaction while digesting new information and its effect on volatility. Starting on February 24, 2020, VIX futures prices fell below contemporaneous statistical forecasts of the VIX index® for more than two weeks.6 VIX futures market investors were slow to appreciate the growing risks as the coronavirus pandemic spread and overly optimistic about how volatility would subside.
Then investors reacted to “new” market information when the S&P 500 index ® suffered its fastest 30% drop on record. Following its rapid descent, the S&P 500 Index® had its fastest recovery on record (126 trading days from Feb 19-Aug 18, 2020).7 This ties back to superspreaders and herd behavior. Investors exhibited emotional responses to new information, which caused securities to be oversold or overbought.
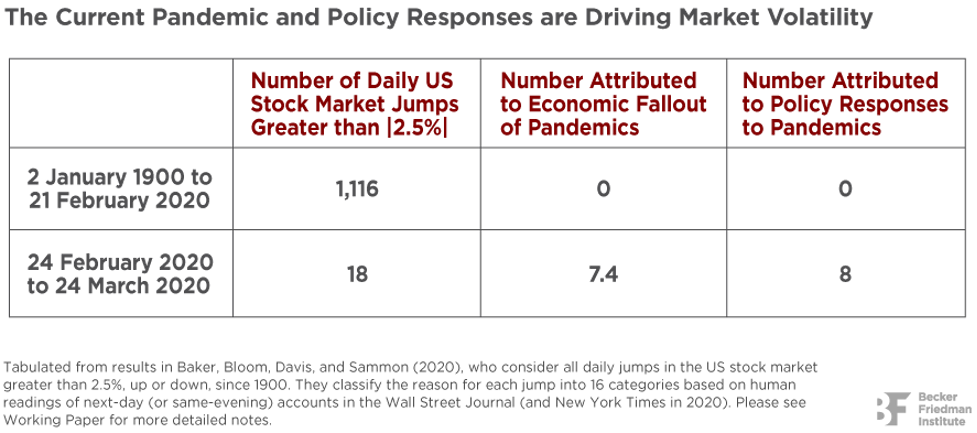
No previous infectious disease outbreak, including the Spanish Flu, impacted the stock market as powerfully as the COVID-19 crisis. Northwestern University researchers used machine learning and human-reading methods to develop the table above to show large daily stock market moves back to 1900 with respect to stock market volatility back to 1985.8
They examined next-day newspaper explanations for each daily move in the U.S. stock market greater than 2.5%, up or down. By those criteria, there were 1,129 (1,116 + 18) stock market jumps from January 2, 1900 to March 24, 2020. Jump days account for 3.5% of all trading days and 47% of total squared daily return variation. In the period before February 24, 2020 – spanning 120 years and more than 1,100 jumps – contemporary journalistic accounts attributed not a single daily stock market jump to infectious disease outbreaks or policy responses to such outbreaks.9
Even the Spanish Flu failed to register in next-day journalistic explanations for large daily stock market moves. Data from February 24 to March 24, 2020 told a different tale. There were 22 trading days and 18 market jumps – more than any other period in history with the same number of trading days. Jump frequency during this period was 23 times the average pace since 1900. Moreover, next-day newspaper accounts attributed 15 or 16 of the 18 jumps to news about COVID-19 developments and policy responses to the pandemic.
By late February 2020, COVID-19 developments dominated newspaper coverage of stock market volatility and figured prominently in newspaper discussions of economic policy uncertainty. By March, COVID-19 developments were cited in 90% of all newspaper discussions of market volatility and policy uncertainty. That data confirmed the unprecedented impact of the COVID-19 pandemic.
Why did COVID-19 developments exert such powerful effects on the stock market in Feb/Mar 2020? Clearly, the pandemic had grave implications for public health and the economy. Part of the answer lies in the severity of the pandemic itself and the infectious nature of the viral contagion. Compared to the Spanish Flu, the information about pandemics is richer and more diffuse than a century earlier. A third explanation stresses the interconnectedness of the modern economy, the commonplace nature of long-distance travel and, in Europe, cross-border commuting. (In 1918, Europe was gripped by World War I and cross-border commuting was a non-issue.)10
In part 2, I will show how investors can use VIX-linked securities as a left-tail risk hedge or a distinct, tradeable asset class to mitigate volatility effects on portfolios.
Rick Roche is a 40-year industry veteran, Chartered Alternative Investment Analyst (CAIA) and Managing Director at Little Harbor Advisors, LLC. Little Harbor Advisors is a sponsor of innovative alternative investments and risk-responsive investing strategies. Rick is a frequent speaker at CFA Societies and Financial Planning Association (FPA
1 Coronavirus Microbiology: Coronaviruses are single-strand enveloped RNA virus. The name is derived from the Latin corona, meaning crown. Viral envelope under electron microscopy appears crown-like. Severe Acute Respiratory Syndrome-associated coronavirus--SARS-CoV2–appears to be a zoonotic infection, likely of bat origin. COVID-19 (first discovered in Wuhan, China, in 2019) is the disease; SARS-CoV2 is the virus itself. (Source: Johns Hopkins ABX Guide).
2 Stein, R., “Super-Spreaders in Infectious Diseases”, International Journal of Infectious Diseases, 2011.
3 Galvani, A., & May, R., “Dimensions of Superspreading”, Nature, Nov 16, 2005.
4 Manela, A. & Moreira, A., “News Implied Volatility (NVIX) and Disaster Concerns”, Dec 11, 2013.
5 Ibid, “NVIX and Disaster Concerns”, page 11.
6 Cheng, I-H, “Opinion: VIX clues show how stock investors underpriced the risk of the coronavirus pandemic”, Outside the Box, Apr 4, 2020.
7 Li, Y. “This was the fastest 30% sell-off ever, exceeding the pace of declines during the Great Depression”, CNBC, Mar 23, 2020, Li’s source was B of A Global Research; DeCambre, M., “The Dow just clinched its fastest bear-market recovery in 30 years”, MarketWatch, Nov 16, 2020.
8 Baker, S., et al., “The Unprecedented Stock Market Reaction to COVID-19”, KelloggInsight- Kellogg School of Management., Northwestern University, Mar 27, 2020.
9 Ibid, Baker, S., et al., Table 1.
10 Ibid, Baker, S., et al., pages 4-5.
More Alternative Investments Topics >
 Advisor Perspectives welcomes guest contributions. The views presented here do not necessarily represent those of Advisor Perspectives.