Lunar Tides, The VIX® and Volatility
Membership required
Membership is now required to use this feature. To learn more:
View Membership Benefits Advisor Perspectives welcomes guest contributions. The views presented here do not necessarily represent those of Advisor Perspectives.
This is part 1 of a two-part series on analogies used in investment management. Analogies play an important role as heuristics to aid in discovery and comprehension. The problem with many analogies is that they are shopworn, stale and tired tropes. I will lay the intellectual groundwork for a novel financial analogy by citing Sir Isaac Newton.1 Part 2 concludes by explaining how the VIX® Index and volatility revert to the mean and why there is a variance risk premium.

VIX and VOL figures of speech
“Never use a metaphor, simile or other figure of speech which you are used to seeing in print.”
-- George Orwell (Pen name for Eric Arthur Blair) Politics and the English Language (1946)
Analogies are used in wide-ranging fields from chemistry to artificial intelligence to finance. Analogies and analogical reasoning illuminate similarities between systems.
Financial advisors and investors demand novelty as the cost of attention. Given near-term outlooks on stock market volatility, a genuinely original analogy is Moon : tides : : VIX : volatility
This analogy is a novel way to communicate via a heuristic the gravitational push/pull the VIX® Index has on implied and realized stock volatility (VOL).
First, my backstory. My firm, Little Harbor Advisors, LLC, is an SEC-registered RIA nestled on Boston’s North Shore. From 1776 to the middle of the 19th century – Little Harbor, Marblehead’s First Harbor – experienced a golden age of commercial fishing. For the next half-century, the fishing industry struggled. But from 1900 to the dawn of the 21st century, this small anchorage made itself proud. From boat building to sail design in The America’s Cup Building, Little Harbor has produced creative designers whose innovations shaped marine history. Today, Little Harbor Advisors is helping craft and build durable, storm-tested innovative investment strategies designed to withstand volatility swirls, contagion spillovers and viral VOL epidemics.
At Little Harbor, we know a lot about tides. Because the Earth rotates through two tidal “bulges” every lunar day, most coastal areas like Marblehead experience two high and two low tides – every 24 hours and 50 minutes each day.
In 1687, Sir Isaac Newton explained that ocean tides result from the gravitational attraction of the Sun and Moon on the oceans of the Earth. Newton succeeded in doing for the tides what Galileo had done for the pendulum and free fall of bodies. He isolated the effects of the main cause (gravitational pull) from those of “incidental” causes with a stroke of genius in his landmark publication, Principia.
As Earth rotates, the Moon's gravity pulls on different parts of our planet. Even though the Moon only has roughly 1/100th the mass of Earth, because it's so close, it has enough gravity to move things around. The Moon's gravity even pulls on the land, but not enough for anyone to tell (unless they’re using precise instruments).
On the side of Earth directly facing the Moon, its gravitational pull is the strongest. The water on that side is pulled in the direction of the Moon. On the side of Earth farthest from the Moon, the Moon's gravitational pull is at its weakest. The center of Earth is approximately the average of the Moon's gravitational pull on the whole planet.
Another feature of tides is mean higher high water (MHHW). MHHW is the average of the higher of the two daily high tides. The term MHHW is more precise than “high tide,” and helps oceanic specialists communicate clearly about the tides they track. We’ll return to the concept of mean a little later in this article.

Moving heaven, Earth and markets with lunar tides…
When the Earth, Moon, and Sun line up – which happens at full or new Moon – the lunar and solar tides reinforce each other, leading to more extreme tides, called spring tides. When lunar and solar tides act against each other, the result is unusually small tides, called neap tides.
Typically, lunar tides exert an imperceptible force on coastlines and coastal inhabitants. With one notable exception: storm tides.
In August 2005, one of the greatest recorded storm surges in the U.S. was generated by Hurricane Katrina. This storm surge reached a maximum height of more than 28 feet in southern Mississippi. And in October 2012, Super Storm Sandy struck Greater New York and the New Jersey coast. A storm surge of 14 feet was reported in New York City. These phenomena have motivated research into improving surge predictions by modeling the timing of peak surge in relation to astronomical tides.2
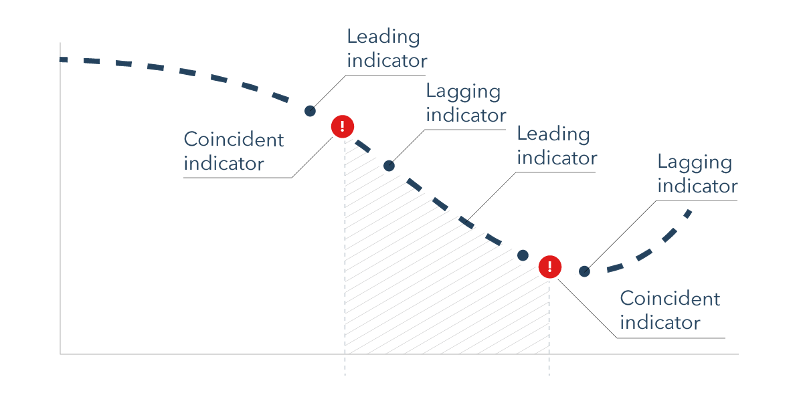
A navigational fix on indicators and volatility models
Weather forecasting inspired the idea that there ought to be statistically documented leading indicators of economic data.3 Within a decade after the 1929 stock market crash, Wesley C. Mitchell and Arthur F. Burns pioneered the “leading indicators” approach to economic forecasting. Leading economic indicators today include the U.S. Department of Commerce’s Business Conditions development, The Conference Board’s Composite Index of Leading Indicators and the OECD’s Composite Leading Indicators.4
Following Mitchell and Burns’ pioneering work, other economists and U.S. Department of Commerce statisticians developed and began tracking coincident and lagging. Coincident indicators, such as employment, production, personal income and manufacturing and trade sales, measure aggregate economic activity. As such, coincident indicators help define the business cycle.5 In part II of this series, I will discuss the VIX® Index as both a leading and a coincident indicator.
Lagging indicators inform policymakers at the Fed and corporate chieftains the results of previous actions taken to drive the economy or corporate profits. Lagging indicators analyze the outcomes of previous strategies or initiatives. Lagging indicators answer the question, “Did we achieve our intended goals when we approved action “x” or “y”? If not, what should we be doing differently?”6
The leading, coincident, and lagging economic indexes are averages of several individual indicators. They are constructed to summarize and reveal common turning point patterns in economic data in a clearer and more convincing manner than any individual component – primarily because they smooth out some of the volatility of individual components.7
There’s an overwhelming amount of academic research on stock market volatility and volatility models. Several pioneers who conducted simulations and modeled volatility in asset returns won a Nobel Prize in 2003. Robert F. Engle and Clive Granger were awarded the Nobel Prize in Economic Sciences by the Royal Swedish Academy of Sciences for their work in time-series econometrics.8
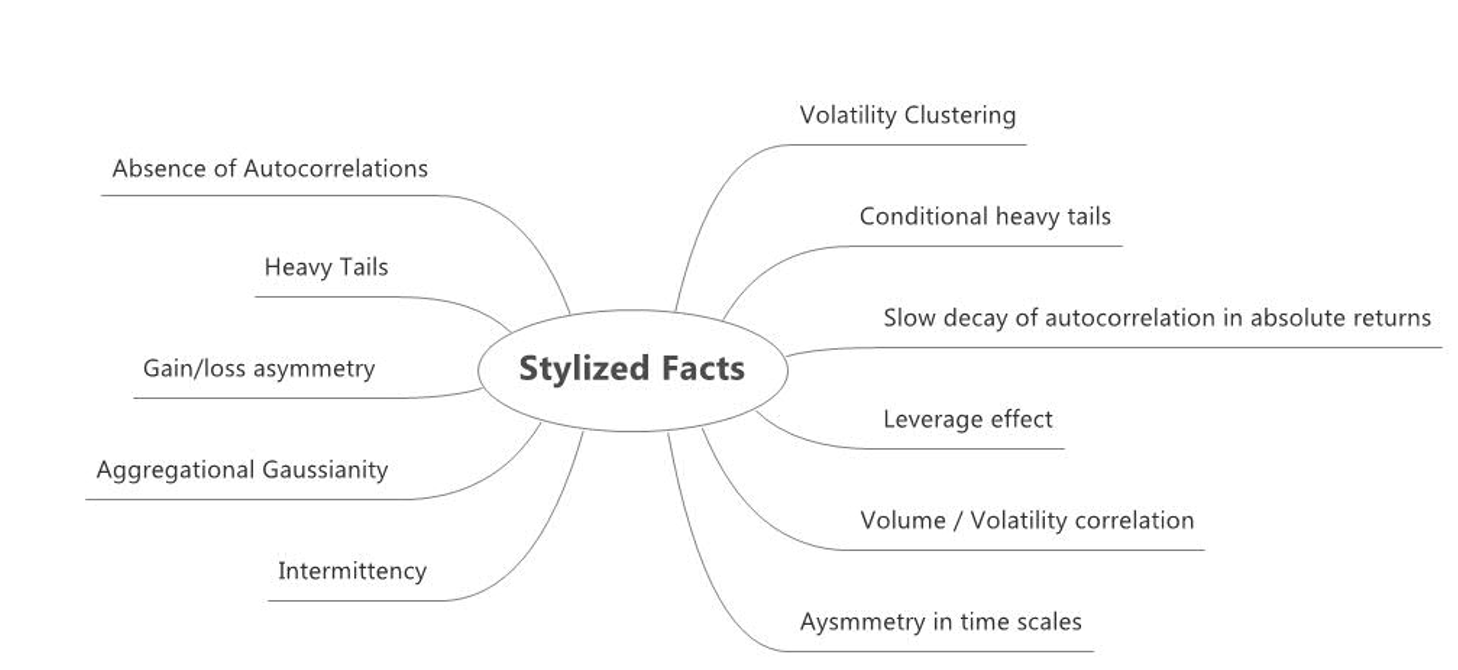
There are a handful of stylized facts about asset price volatility. (A stylized fact refers to empirical findings that are so consistent – for example, across a wide range of instruments, markets and time periods – that they are accepted as truth. 9) Here are several stylized facts about financial asset price volatility confirmed in numerous studies:
- Volatility exhibits persistence.10 The clustering of large and small moves (either positive or negative) in prices was one of first documented features of volatility behavior. Large changes in the price of a financial asset are often followed by more large changes. Small changes in asset prices are often followed by small changes. The implications are that volatility shocks influence the expectations of volatility many periods into the future. The forecast of future volatility depends upon today’s information set including asset price returns.
- Volatility varies over time11. Up until the 1980s, researchers and practitioners used models in which volatility was assumed constant over time. But volatility may vary considerably. Volatility persists and varies is not inconsistent or contradictory. Modeling and forecasting of volatility is regime-dependent. There are bull, bear, sideway and risk on/risk off markets. The S&P 500 is a “portfolio of stocks.” The volatility of the S&P 500 is dependent on two factors: 1) The idiosyncratic volatility of the 500 constituent stocks; and 2) The SPX stocks’ correlations to one another. If correlations fall, it is possible for individual stock volatilities to rise even as the “S&P 500 portfolio” volatility falls.12
- Volatility has a half-life.13 A “half-life” of volatility is defined as the time taken for an asset’s volatility to move halfway back towards its unconditional mean or average level. Volatility reverts at a certain speed to its eventual destination – its long-term mean.
- Volatility is mean-reverting.14 Volatility clustering implies that volatility, like lunar tides, ebbs and flows. A period of high volatility eventually gives way to more normal volatility. Similarly, periods of low volatility will be followed by a rise in VOL. But epochs of higher or lower volatility (market regimes) can last for long periods – months or even years.
- Volatility news is self-reinforcing. News of increased (decreased) volatility for a stock can cause a subsequent decline (increase) in stock’s value because it reduces (increases) demand for the stock because of investors’ risk aversion (risk-seeking appetite). Negative news sentiment is one source of heightened VIX levels.15
Volatility forecasts are essential in risk management, derivatives pricing and hedging, market making, portfolio selection and many other financial activities. In spite of laboring in the halls of academia and the wanton desire of asset manager practitioners, there was no shortcut or heuristic for making calculated predictions of future stock market volatility. A volatility indicator or signal should forecast volatility. But there were no leading or coincident volatility indicators for implied (projected) or realized volatility until the 1990s. At last, in 1993, an imperfect – but nonetheless informative – predictor of future volatility was born.
The VIX® Index origin story
In 1992, Sir Isaac Newton of “I can calculate the motion of heavenly bodies but not the madness of people" fame wasn’t available for a gravitational force consulting project.16 So, the Chicago Board Options Exchange (Cboe) turned to a Duke University finance professor on sabbatical. The Cboe had previously hired Robert (Bob) Whaley for litigation support to defend it against a class action suit because of “…inordinately high levels of volatility” in options marketed by the Cboe. In ongoing conversations, Cboe executives and Bob Whaley thought “…it would be really interesting to have an index on volatility.”17
By supplying a script for replicating volatility exposure with a portfolio of SPX options, this new methodology transformed the VIX® Index from an abstract concept into a practical standard for trading and hedging volatility.18
The VIX’s gravitational pull
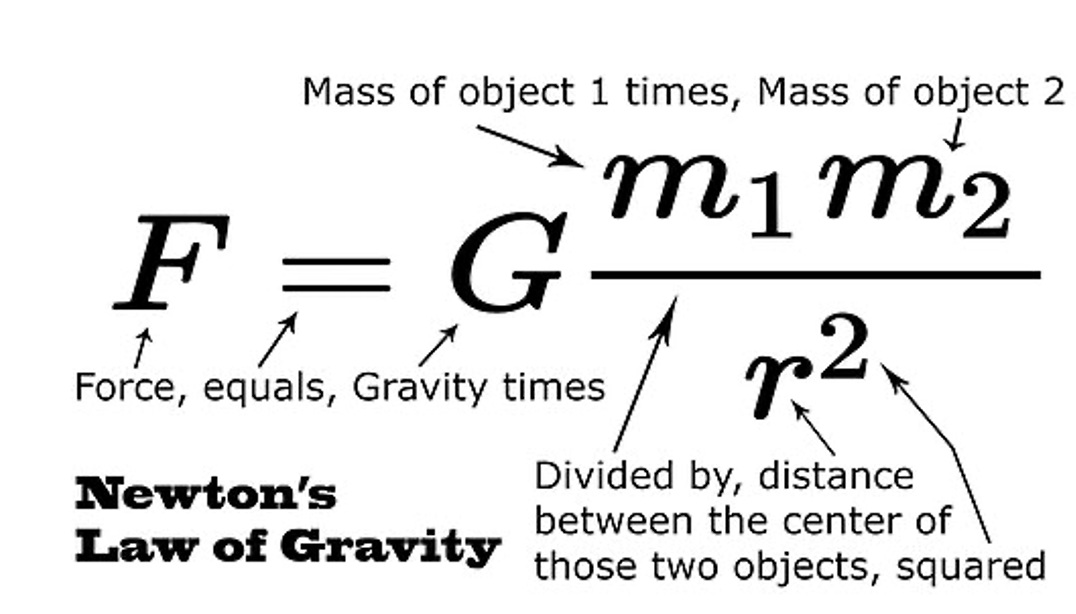
Newton’s law of universal gravitation states that two bodies attract each other with a force equal to a constant (constant of gravitation) proportional to their masses and the distance between them.19 Per the terms of Newton’s Law, every object in the universe attracts every other object with a measurable force (however slight). It even occurs for small masses. We all know that the concept of gravity is the thing that causes objects to fall to earth.
The same gravitational force that causes objects to fall causes celestial bodies to move along their circular or elliptical paths. One of Newton’s key findings was that gravitational force is diluted by distance. The gravitational force exerted is in direct proportion to the product of the two objects’ mass and inversely proportional to the square of the distance between the two objects (inverse square law).
While Newton applied his law of gravity to celestial bodies and falling apples, Whaley applied his formula to forecasts of implied volatility. The VIX® Index provides an estimation of future volatility and interprets the spatial relation between forecasts of implied volatility and realized volatility. The VIX® Index is a tractable representation of interaction between SPX option buyers and sellers.
The VIX® Index exerts a force on stock market volatility; heightened (lower) stock volatility causes the VIX to rise (fall). When volatility accelerates (decelerates), the VIX® Index rises (falls). The VIX is a symptom and sign of stock volatility; VIX movements are both a cause and effect of market volatility.
The author, Rick Roche, is a managing director at Little Harbor Advisors, LLC and 40-year industry veteran. Little Harbor Advisors is the majority-owner of a Chicagoland-based investment and derivatives trading firm, Thompson Capital Management. Little Harbor Advisors (LHA) sponsors “Risk-Responsive Investing” and volatility-influenced strategies. Rick is a frequent industry speaker and has been published in numerous financial trade publications.
1Newton, Isaac, "If I have seen further it is by standing on the shoulders of Giants.”, Feb 5, 1676 letter to Robert Hooke.
2“About Storm Surge: What Causes Storm Surge?”, National Weather Services, NOAA.
3Shiller, Robert, 2019. Narrative Economics: How Stories Go Viral and Drive Major Economic Events, Princeton: Princeton University Press, page 125.
4Ibid, Shiller, R., Narrative Economics.
5The Conference Board, 2000. “Business Cycle Indicators Handbook”
6DiBernardino, F. 2014. “The Value of Lagging Indicators”, The Conference Board, May 29, 2014.
7Ibid, The Conference Board.
8Bank of Sweden Prize in Economic Sciences in Memory of Alfred Nobel, Oct 8, 2003. “Time Series Econometrics: Cointegration and Autoregressive Conditional Heteroskedasticity (ARCH)”, Robert F. Engle, PhD, and the late Clive W. J. Granger, PhD.
9Sewell, M. 2011. “What Are Stylized Facts?”, Research Note, University College London (UCL).
10Engle, Robert F. and Patton, A. 2000. “What Good Is a Volatility Model?”, Quantitative Finance, Institute of Physics Publishing, Volume 1.
11Ibid, 2003. “Time Series Econometrics: Cointergration and Autoregressive Conditional Heteroskedasticity (ARCH)”, 2003.
12Edwards, Tim, & Hamish, Preston. 2017. “Reading VIX ®: Does VIX Predict Future Volatility?”, Nov 2017. S&P Dow Jones Indexes, page 20.
13Ibid, Engle, Robert F and Patton, A. 2000. “What Good Is a Volatility Model?”.
14Ibid, Engle, R., & Patton, A. 2017. “Reading VIX ®: Does VIX Predict Future Volatility?”, pages 7-11.
15Smales, L. 2020. “News Sentiment as an Explanation for Changes in the VIX Futures Basis”, The Journal of Investing, Jun 2020.
16Kucharski, A. 2020. The Rules Of Contagion, Basic Books, page 39.
17Asmundsson, J. 2020. “The Father of the Fear Gauge Feels Reassured by the VIX”, Crain’s Chicago Business, May 15, 2020.
18Cboe VIX. “White Paper – Cboe Volatility Index®”
19Hadfield, Chris, “MasterClass on Space Exploration”, accessed on 8-1-2020
Membership required
Membership is now required to use this feature. To learn more:
View Membership BenefitsSponsored Content
Upcoming Virtual Events View All