Lunar Tides, the VIX and Volatility
Membership required
Membership is now required to use this feature. To learn more:
View Membership Benefits Advisor Perspectives welcomes guest contributions. The views presented here do not necessarily represent those of Advisor Perspectives.
This is part 2 of a two-part series on analogies used in investment management. Analogies play an important role as heuristics to aid in discovery and comprehension. But the problem with many of those analogies is that they are shopworn, stale, and tired tropes.
This article explains how the VIX® Index and volatility revert to the mean and why a variance risk premium occurs.

Self-fulfilling prophecies’ role in VIX viral volatility transmission
The negative correlation of volatility (and the VIX) to stock markets returns is well documented.1 This suggests a diversification benefit to including volatility in an investment portfolio. The VIX® Index is not a tradeable security or index. But volatility can be traded via VIX-linked instruments. Because the VIX® Index is negatively correlated with the S&P 500 (-0.82/correlation of weekly returns over period 2008-2019)2, it pulls and pushes investor sentiment depending on market tides and turbulence.
The late Robert King Merton was considered a founding father of modern sociology. Merton’s most cited work was The Self-Fulfilling Prophecy.3 In this treatise, Merton stated,
The self-fulfilling prophecy is, in the beginning, a false definition of the situation evoking a new behavior which makes the originally false conception come true. The specious validity of the self-fulfilling prophecy perpetuates a reign of error.
Self-fulfilling prophecies play a vital role in VIX® Index levels and implied and realized volatility. Human behavior significantly influences market movements. Cognitive biases, complexity and “perfect” herding, in which rational agents all act alike without any countervailing force, can trigger heightened (lower) VIX levels and higher (lower) stock volatility regimes. Changing expectations of future market volatility is a common investor behavior. If market participants' expectations influence market turbulence and that propagates among other investors, then the self-fulfilling prophecy effect exists.
An index (such as the VIX) will influence the behavior of the exact thing that it is supposed to model or replicate (that is, S&P 500 Index’s implied volatility 30-days out). Although Merton’s theorem lacks the sweep and precision of a Newtonian theorem, it possesses a similar type of relevance. When volatility increases and clarity of information disappears, many investors sell first and ask questions later.
Market corrections and crashes are extremely vulnerable to investor herding effects, the actions of super-spreaders and information cascades in which individuals base their actions on those of others regardless of their own beliefs, knowledge or situation. Self-fulfilling prophecie are apparent when analyzing the correlation between volatility forecasts made by institutional investors and professional traders. There is a positive feedback between the VIX® Index and future implied and realized stock volatility.
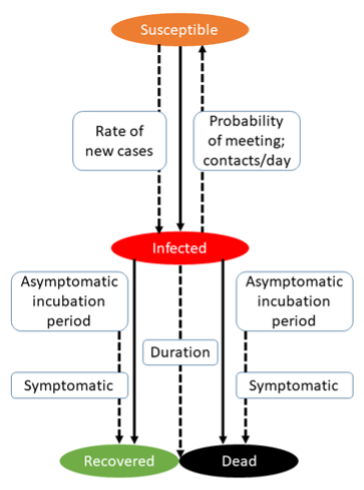

The transmission of volatility resembles an epidemiological model that explains the spread of infectious disease.4 The “Kermack-McKendrick SIR Model” explains volatility transmission.5 It was developed in 1927. “S” is the percentage of population who are susceptible. “I” is the % of population who are infective. “R” is the % of pop who recovered from the disease or are deceased.
The model explains the spread of ideas, memes and thought contagions – including volatility transmission. it illustrates how ideas or economic narratives are modified and transmitted through broadcast media as well as contagion through person-to-person contact. It uses a “two-step flow hypothesis” where financial trade media (e.g., CNBC) runs with a dramatic story – 1,000-point drop in the Dow – and relays information to a primary audience (professional investors). This primary audience – a relatively small group – sends up an alarm signal that spreads through word-of-mouth.The transmission of volatility resembles an epidemiological model that explains the spread of infectious disease.4 The “Kermack-McKendrick SIR Model” explains volatility transmission.5 It was developed in 1927. “S” is the percentage of population who are susceptible. “I” is the % of population who are infective. “R” is the % of pop who recovered from the disease or are deceased.
News coverage of heightened volatility, accompanying higher VIX readings, reduces the appetite for risk assets. This causes market liquidity to evaporate and triggers spillovers and contagion in other markets. Like infectious disease, financial contagion is a social process. Money managers who attended the same universities, studied the same finance curriculum and frequent the same watering holes will engage in groupthink that results in market meltdowns and financial panic.
Returning to the “tides” analogy, mean higher high water is the average of the higher of the two daily high tides. “Mean” plays a major role in stock volatility and the VIX – as in reversion to the mean or mean-reverting. The mean VIX is explored in depth below. Finally, there’s the element of time. The lunar tide cycle occurs over a 24-hour, 50-minute interval. The VIX® Index forecasts expected or “implied” volatility over the next 30 days. In a nutshell, the Moon : Tides: : VIX : Volatility analogy has three common threads: 1) gravitational pull; 2) the mean or average; and 3) distance and time.
A “mean” VIX: Reversion to the mean
“The most important of these rules is the first one: the eternal law of reversion to the mean in financial markets.” – John Bogle, Vanguard Founder (1929-2019)
What’s meant by the Moon-is-to-Tides as VIX-is-to-Volatility? When volatility explodes – as it did in March 2020 – we can expect volatility to taper off. Volatility is mean reverting. The forces of gravity pull on stock volatility, dragging it back toward the middle when it spikes too high or dips too low.
There’s evidence that mean reversion of volatility is a central tenet across different markets, including equities, fixed income, currencies and commodities.6
Stock prices can trend for decades, but volatility has an established mean around which it fluctuates. In the 30 years from 1990 to 2019, the historical volatility for the S&P 500 – measured by monthly standard deviation – was 15.3. The mean (average) VIX Index value over the same 30 years was 19.7. The median level (half above; half below) for the VIX® Index from 1990-2019 was 17.2.7
The VIX may spike to 45 or drop to 10, but just as lunar tides ebb and flow by the pull of the moon, mean reversion will eventually pull stocks’ volatility and the VIX® Index back to their resting averages. Expected VIX levels provide attentive investors with a better-calibrated measure of whether the VIX Index is high, low or normal.
Volatility reverts at a certain speed to its eventual destination – its long-term mean. Therefore, investors can anticipate a change in volatility (positive or negative) based on the assumption that volatility (and its shadow, the VIX) reverts at a certain speed. The implied half-life of volatility for the S&P 500 and Dow Jones Average indexes are subject to sampling frequencies. As such, it’s hard to specify exactly how long it takes for the VIX and VOL to arrive back at their mean.8
Means reversion is stable over long time horizons. a historically typical mean reversion can be incorporated when forecasting volatility.9 But there are two caveats. The observation of mean reversion statistics (including sampling frequency) requires a suitably long period of study. Otherwise, calibrating future volatility and VIX® Index predictions will be skewed by a dominant market regime.
The mean for volatility or the VIX might change over time. Changes to sector weightings in the S&P 500, trading volumes and regulations all have the potential to impact both the speed and the destination of volatility’s reversion to the mean.10
Volatility premium over the VIX
“Perfect is the enemy of the good.” – Voltaire (LA BÉGUEULE – 1772)
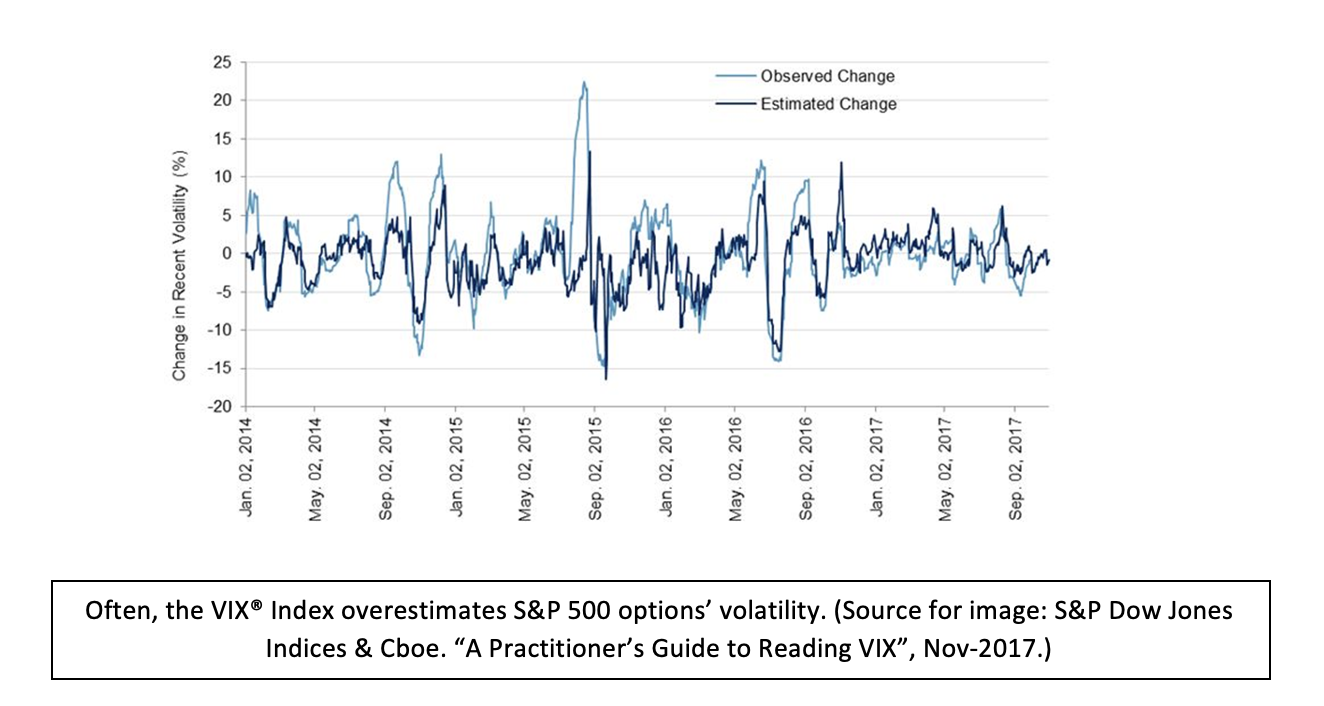
One common misconception is that VIX levels correspond directly to the volatility observed 30 days later – assuming a VIX reading of 24.5 today means an anticipated volatility of 24.5 in a month. The truth is that VIX closing prices reflect volatility expectations that are, on average, higher than realized S&P 500 (SPX) volatility. There’s typically an excess of demand for the insurance-like characteristics that SPX options provide resulting in a discernable premium in the VIX.11
Specifically, for SPX options, implied volatilities have been higher than historical (or realized) volatilities for the S&P 500. In 29 of the 30 years from 1990 to 2019, the average daily closing level for the VIX® Index was higher than the subsequent 30-day realized volatility of the S&P 500.12 Over 252 trading days’ trailing average of the VIX compared to SPX volatility realized over the next 30 days, an overestimation or premium averaging four to five percentage points (with a range of 2-5% from 1994-2019) was typical.13 This degree of overestimation – a VIX® Index or volatility risk premium – appeared in a predictable fashion.
When asked why that is, the father of the VIX, Robert Whaley said, “…that’s because people pay a lot of money for portfolio insurance. That is, they buy S&P puts. They pay more than their actuarial value.”14
The existence of a variance risk premium can also be observed by comparing the average daily VIX closing values of 19.1 versus the average of 15.3 for historical volatility of the S&P 500 over the 1990-2019 period (~400 basis point difference). The VIX premium can be attributed to two primary factors: 1) an imbalance between the number of investors who want to buy protection (puts) and those who want to sell protection; 2) the tendency of the VIX to move quickly and sharply in response to significant new information, which accounts for short-term traders trying to capitalize on these moves.15
The VIX® Index is more of a coincident than leading indicator of future volatility. But similar to the business cycle indicators described in part 1, the correlations between coincident and leading indicators are virtually identical.16 There is an adage among volatility traders: “When the VIX is high, it’s time to buy. When the VIX is low, it’s time to go.”
The VIX is not a foolproof indicator of future volatility, but as a signal and symptom of volatility it presents trading opportunities. Because the VIX is inversely correlated to the direction of equity prices (~.82 CORR from 2008-2019), it reacts quickly at the onset of market regime changes.17
The existence and persistence of a volatility risk premium in SPX options can lead to rewards for option-selling strategies over option-buying strategies with similar market exposure. In 2017, the standard deviation of the S&P 500 index was just 6.7%: the second lowest year on record, after 1963.18 The placid waters of S&P 500 volatility were an especially favorable trading environment for many SPX options sellers in calendar year 2017.
The VIX futures term structure makes direct positions in many VIX-linked securities unsuitable for buy-and-hold investment due to negative expected returns. For example, a position in the S&P 500 Short-Term Futures (symbol, SPVXSP) – would have lost 99.95% of its value if opened in Jan-2009 and held through May 2020.19
Although unsuitable for buy-and-hold investors, there are times when trading VIX short-term futures contracts are quite lucrative. Over the last 13 years (2006-2020), there have been numerous occasions where owning the VIX S-T Futures Index for short periods resulted in double-digit gains. For example, the S&P 500 VIX S-T Futures Index from Feb 19 through Mar 18, 2020 (COVID Crisis) rose 416%.20
Whaley admitted that he trades VIX-linked instruments – as a day trader! While the father of the VIX does not believe VIX-linked securities are suitable for a buy-and-hold strategy, he feels there are times where these VIX products are attractive trading vehicles. Regarding certain VIX derivative products, Whaley states, “You’re putting things into the hands of people who don’t understand them… Is it a good buy-and-hold for an institution? No.”21
The negative correlation of volatility to stock market returns is well documented. The negative correlation of the VIX® Index suggests a diversification benefit to including volatility in investment portfolios. Volatility is a tradable asset – but it is best left in the hands of experienced volatility traders. When retail investors trade volatility on their own, it is risky.

Normal rules don’t apply to non-normal markets
The VIX® Index failed to warn investors as the novel coronavirus crisis came upon U.S. shores. On February 19, 2020, the VIX® Index was resting at 14.38 – well below its 19.1 average daily close and its 30-year median level of 17.2. On February 20, the VIX® Index rose a little to 15.56. But it wasn’t until February 24 that the VIX® Index began to signal alarm, spiking to 25.03.22 On February 28, 2020, the VIX went into full panic mode having leapt 2.8 times higher than where it was nine days earlier.
On March 18, 2020, the VIX® Index hit a new all-time closing high at 82.69. A VIX® Index measuring ~80 means that one-month Standard & Poor’s 500 options are pricing in expected daily (close-over-close) moves of +/-5%.23 Plus or minus five percent (5%) daily moves are huge! The lead month VIX futures traded at their highest level on record and March 2020 saw the highest VIX futures settlement value ever at 69.74.
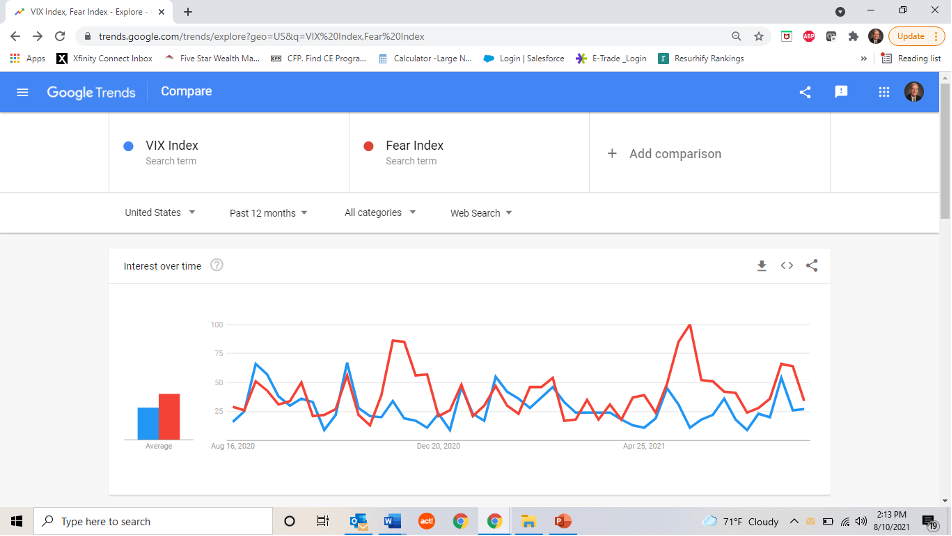
Over the last 12 months, internet searches for the phrases “VIX® Index” and “fear index” on Google Trends reached “Peak Interest Over Time – 100%” during the week of May 23-29, 2021 (see illustration above). The fact that investors are Googling “fear index” at higher rates than the “VIX® Index” may be indicative of investors’ sentiment. This could be a signal that Mr. Market is telegraphing a further rise in stock prices or presaging turbulence ahead. We explored the role of “self-fulfilling prophecies” in VIX viral volatility transmission at the onset of this article. The last 18 months have not been normal times.
The rapid market regime shifts in 2020 and 1H 2021 necessitate flexible and adaptive portfolios amidst bouts of volatility. Prudent investors should identify volatility signals and patterns in advance. All the more reason to follow the VIX, an imperfect but nevertheless informative predictor of future volatility.24
The VIX® Index provides predictive and useful indications of sentiment. but it must be carefully teased from the data. Most volatility indicators work best incorporated with other indicators. By utilizing a variety of volatility signals, you can build more durable and turbulent-resistant portfolios and engineer better investment outcomes for clients.
Rather than simply buying (selling) when the VIX is high (low), the genuine fear component of the “fear index” is a better guide for making good investment decisions. The VIX® Index reveals timely insights for investors to harvest variance risk premiums significantly greater than zero.[25] Over complete market cycles, the VIX Index® is a reliable, consistent, negatively correlated, and coincident indicator of near-term implied volatility.
The author, Rick Roche, is a managing director at Little Harbor Advisors, LLC and 40-year industry veteran. Little Harbor Advisors is the majority-owner of a Chicagoland-based investment and derivatives trading firm, Thompson Capital Management. Little Harbor Advisors (LHA) sponsors “Risk-Responsive Investing” and volatility-influenced strategies. Rick is a frequent industry speaker and has been published in numerous financial trade publications.
1Cboe VIX. “White Paper – Cboe Volatility Index®”, page 3.
2Moran, M., and Liu, B. 2020. “The VIX Index And Volatility-Based Global Indexes & Trading Instruments”. CFA Institute Research brief, 2020, Table 1, page 4.
3Merton, R. 1948. “The Self-Fulfilling Prophecy”. The Antioch Review, Vol. 8, No. 2, Summer 1948.
4Shiller, Robert, 2019. Narrative Economics How Stories Go Viral & Drive Major Economic Events; Kucharski, Adam, 2020. The Rules Of Contagion; and author’s research.
5Ibid, Shiller, R., Narrative Economics, page 291.
6Edwards, Tim, & Hamish, Preston. 2017. “Reading VIX ®: Does VIX Predict Future Volatility?”, Nov 2017. S&P Dow Jones Indexes, S&P DJI, page 7.
7Ibid, Moran, M.,& Liu, B. 2020. CFA Institute Research brief, 2020, page 3.
8Engle, Robert F. and Patton, A. 2000. “What Good Is a Volatility Model?”, Quantitative Finance, Institute of Physics Publishing, Volume 1, page 244.
9Ibid, Edwards, T. & Preston, H. 2017. “Reading The VIX”, S&P DJI, page 11.
10Ibid, Edwards, T. & Preston, H. 2017. “Reading The VIX”, S&P DJI, page 10.
11Edwards, PhD, Tim, Preston, H. 2017. “A Practitioner’s Guide to Reading VIX”, Nov-2017, page 3.
12Ibid, Moran, M.,& Liu, B. 2020. CFA Institute Research brief, 2020, page 5.
13Ibid, Edwards, Tim, & Preston, Hamish. 2017. ““A Practitioner’s Guide to Reading VIX”, page 3.
14Asmundsson, J. 2020. “The Father of the Fear Gauge Feels Reassured by the VIX”, Crain’s Chicago Business, May 15, 2020.
15Ibid, Moran, M.,& Liu, B. 2020. CFA Institute Research brief, 2020, page 5.
16Ibid, The Conference Board. 2000. “Business Cycle Indicators Handbook”.
17Ibid, Moran, M., and Liu, B. 2020. “The VIX Index”, CFA Institute, April 2020, page 4.
18Hassan, S. 2018. “Market Volatility: A Return To The Old Normal”, FORBES, Dec 12, 2018.
19Ibid, Asmundsson, J.
20Edwards, Tim, PhD. 2020. “Deep Dive Into The Markets And Volatility: VIX® and Volatility”, S&P Dow Jones Indices, May 12, 2020, slide # 38.
21Ibid, Asmundsson, J. 2020. Crain’s Chicago Business.
22Ibid, Cboe, VIX Historical Price Data.
23Davitt, K. 2020. “Inside Volatility Trading”, Cboe Blog, 03/24/20.
24Edwards, Tim, PhD. 2020. “Deep Dive Into The Markets And Volatility: May 12, 2020
25Bollerslev, T., Todorov, V., & Xu, L. 2015. “Tail Risk Premia and Return Predictability”, Mar 15, 2015, page 1.
Membership required
Membership is now required to use this feature. To learn more:
View Membership Benefits