What Awaits Behind the Russia and Inflation Headlines?
Membership required
Membership is now required to use this feature. To learn more:
View Membership Benefits Advisor Perspectives welcomes guest contributions. The views presented here do not necessarily represent those of Advisor Perspectives.
The Rest of the Story was a Monday-through-Friday radio program originally hosted by Paul Harvey. Beginning as a part of his newscasts during World War II and then premiering as its own series on the ABC Radio Networks on May 10, 1976, the broadcasts always concluded with a variation on the tag line, And now you know...the rest of the story. The show aired from 1942-2008.
Harvey was noted for his beautiful presentation style and his conservative but individualistic opinions on current events. He enjoyed an almost unparalleled longevity as a national broadcaster. Baby boomers remember Paul Harvey well.
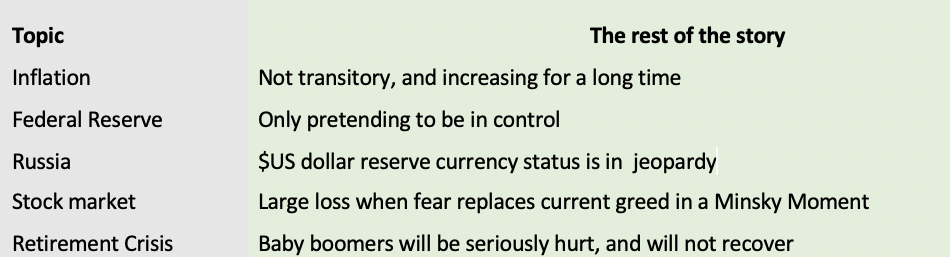
With all eyes currently on Russia and the flare up of inflation, the rest of the story needs to be told about the following:
- Inflation is due in part to supply chain disruptions caused by COVID, but the rest of this story is that inflation will continue to increase and will last a long time because it’s not just a matter of supply shortages.
- The Federal Reserve has announced a plan to control inflation through interest rate hikes, but the rest of this story is that the Fed is just pretending to be in control.
- Russia’s incursion into Ukraine is testing NATO resolve, but the rest of the story involves China and the reserve currency status of the dollar.
- The U.S. stock market story is at a precipice, but the rest of the story is that it is tipping from greed to fear.
- The retirement crisis is becoming even more critical because a 60/40 stock/bond allocation is risky and so are target-date funds. The rest of this story might surprise you.
I discussed these topics in detail on a recent Baby Boomer Investing Show. Buckle up your seats. You’re about to go on a wild ride.
Inflation
There are two kinds of inflation. One is called “demand-pull inflation.” It is caused by demand for goods or services exceeding supply, which is occurring now because supply chains have been disrupted by COVID, and people have been slow returning to work, increasing the costs of goods and labor and generating most of our 7.5% inflation. This form of inflation should dissipate as people return to work and cargo ships are unloaded. It should be transitory.
The other form of inflation, called “cost-push inflation,” is not transitory. It is classic inflation caused by too many dollars chasing too few goods. It happens when a government prints too much money, as has been happening globally over the past 13 years. Argentina and Venezuela are rich countries that are still suffering from hyperinflation, defined as inflation above 50%, because their governments made serious monetary mistakes.
The world is running on unprecedented levels of debt, to the tune of $200,000 per capita. The U.S. enjoys a special status as the “cleanest dirty shirt in the laundry basket” because the dollar is the world’s reserve currency.
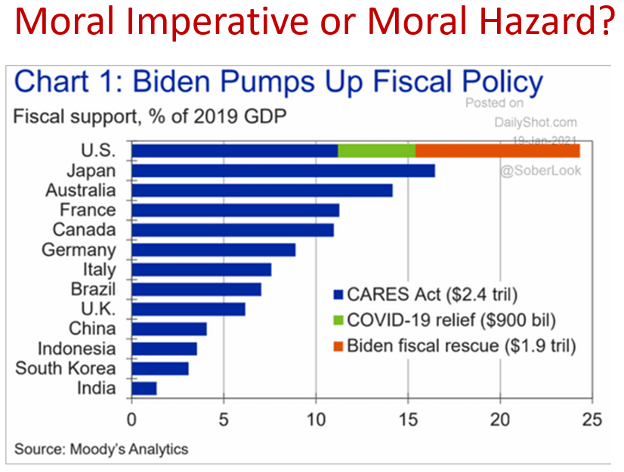
But the US has printed more money for COVID than any other country, exposing it to cost-push inflation that will last a long time and will drive inflation above the current 7.5%.
Who is paying for COVID? When was the last time you heard the words “balanced budget”?
Modern monetary theory (MMT) is the justification for the money the U.S. has “printed” over the past 13 years. The theory says that governments that own the printing press can print all they want to solve economic crises, unless it causes inflation, in which case that money needs to be taken back with taxes.
“Printing” is not actually running the presses. The Treasury borrows money as it sells Treasury bonds and bills. In ordinary times, there are plenty of buyers for these bonds, but recent times have not been ordinary, so the Federal Reserve buys them, manipulating bond prices to execute a zero interest rate policy (ZIRP). Money is created out of thin air.
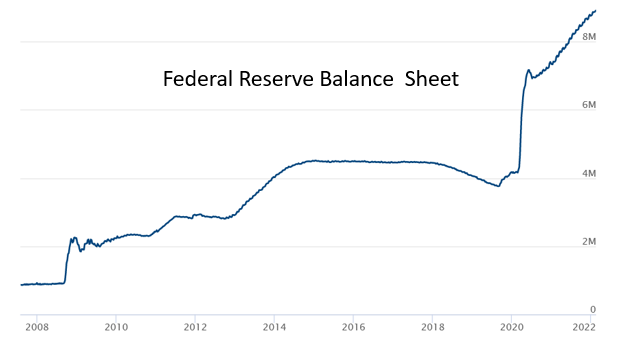
According to the Federal Reserve, its balance sheet has skyrocketed from normal levels under $1 trillion to $9 trillion, with most of the increase during the pandemic.
MMT appears to have “worked.” A recession in 2008 was short-lived, stock prices soared, and inflation remained near zero – or did it? The fact is that $4.5 trillion in quantitative easing (QE) artificially increased the prices of both stocks and bonds, so we’ve had asset price inflation that is not reflected in the Consumer Price Index (CPI).
Investors suffer from a behavioral bias called “money illusion” where they believe that this price manipulation has made stocks worth more, even rising in the face of a pandemic – after a brief setback in the first quarter of 2020, stock prices rose as earnings plummeted.
Lifting a rising stock market, money printing accelerated in 2020 to pay a COVID bill in excess of $5.5 trillion, and more recently another $3 trillion was approved for infrastructure. And there’s another $3 trillion making its way through Congress.
A couple videos explain the craziness in a clear and humorous way. Debt limit - a guide to American federal debt made easy uses household debt to explain federal debt. Fred Thompson on the Economy explains the wisdom of QE to save the 2008 economy.
One trillion is 1,000 billion or a million million – it’s a huge amount of money According to CNBC :
If you paid out $1 per second, to settle a $1 million debt would take less than 12 days. To pay off $1 billion would take 32 years. Paying off $1 trillion at a dollar per second? 32,000 years.
A trillion is a 1 followed by 12 zeros, like this: 1,000,000,000,000.
A trillion square miles would cover the surface of 5,000 planet Earths.
A trillion people would be 10 times more than have ever lived (based on the Population Reference Bureau’s very rough estimate of 108 billion humans ever).
A trillion dollars is enough to give $3,195 to every man, woman and child in the United States. (Author’s comment: we got this helicopter money doled out in bigger checks)
For a typical U.S. household, making $50,000 per year, to earn enough to pay off a $1 trillion debt would take 20 million years.
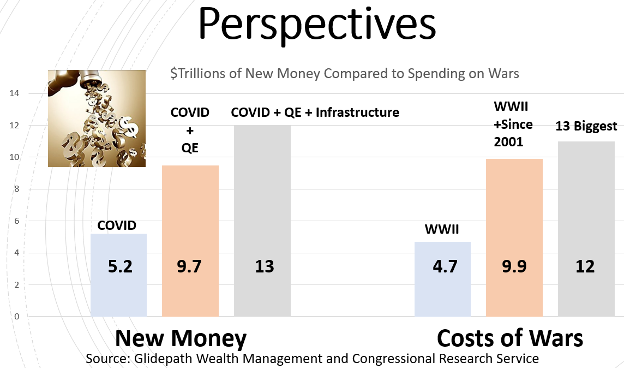
The following graph shows the magnitude of recent money printing by comparing it to our most expensive wars.
But that’s not the entirety of the rest of the story. We (through our government) have made promises for Social Security and Medicare that are unlikely to be kept, and QE has widened the wealth divide beyond comprehension.
The following image shows that the total debt is more than five-times gross domestic product (GDP), when the total includes off balance sheet promises for Social Security and Medicare.
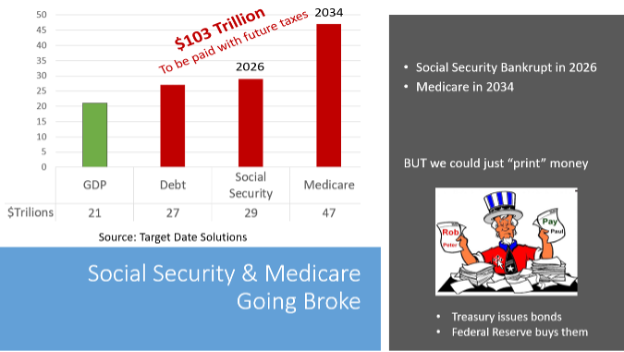
Tax receipts for Social Security have been insufficient to pay all the benefits since 2018. The Government Accountability Office (GAO) reports that Social Security will be bankrupt in 2026, followed by Medicare in 2034. Many say that owning the printing press means you can’t go bankrupt, but the reality is that inflationary forces are already out of control.
MMT has poked the inflationary bear and it is infuriated. It’s time to take that money back with taxes, not print more of it. Cowboy wisdom instructs, “When you find yourself in a hole, stop digging.”
The last part of the rest of the inflation story is the great wealth divide and the social unrest it creates. The bottom half of the U.S. population by wealth owns only 2% of the country’s tremendous wealth. Half the people are “poor.“ It’s no wonder that Bernie Sanders has his supporters – half the population wants what the other half has.
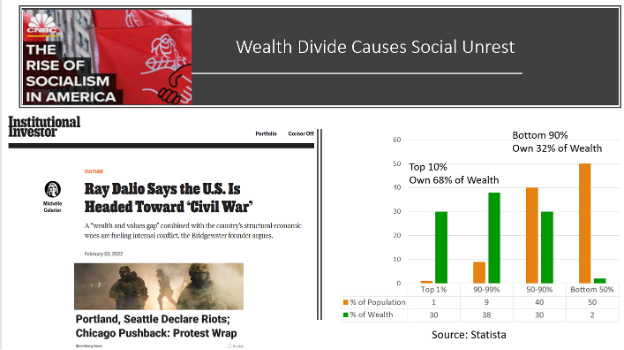
In summary, the rest of the inflation story is that ridiculous money printing will cause an extended period of rising inflation in the throes of unaffordable debt and social unrest caused by a huge wealth divide where the rich are despised. It’s ugly.
The Federal Reserve
It’s ironic that the Fed is coming to the rescue to control inflation when it is complicit in creating it. As described in the Inflation section above, the Fed is key to “printing” money. And therein lies the Fed dilemma, as summarized in the following diagram.
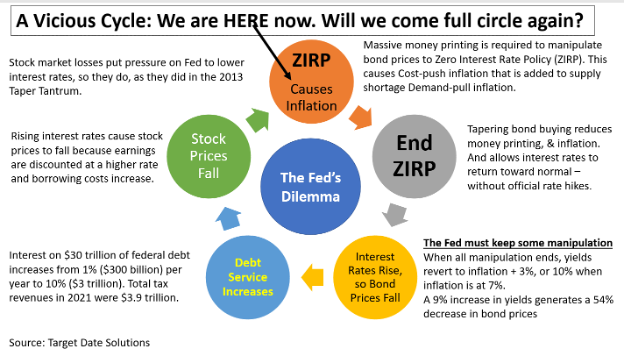
The Fed does not have a dial that it can turn to a desired level of interest rates, but it has managed to suppress interest rates by buying bonds at premium prices. When the Fed lets its foot off the break by tapering its bond buying, interest rates will go up and bond prices will go down.
No special Fed meeting is required to “set” an interest rate – rates rebound toward a fair market price when they are not being manipulated. A fair market price in a 7.5% inflationary environment yields 10.5%.
Prior to ZIRP, bonds were priced to yield 3% above inflation, or 10.5% in the current 7.5% inflationary environment. But increases in interest rates do a lot of damage, as we learned in the 2013 “taper tantrum.” Higher interest escalates the interest payments on our $30 trillion government debt. Interest at 10% would require spending all tax receipts on debt service and borrowing to pay for military spending and social programs like Social Security and Medicare. Tax receipts are about $3 trillion per year.
What’s worse is the stock market will crash, as it did in the 2013 taper tantrum because bonds become reasonable alternative and corporate earnings are discounted at a higher rate. At this stage in the cycle, the Fed will be encouraged to stop tapering, and resume its bond buying.
But this time is not like 2013, when inflation was near zero. This time bond buying will fuel the very inflation fires that the Fed says it will extinguish.
The rest of the Federal Reserve story is that it cannot simultaneously continue to manipulate interest rates under ZIRP while subduing inflation. It will have to choose. The better choice is to control inflation and allow bonds to return to market-driven prices, increasing interest rates and driving down stock prices. Allowing market forces to work is usually the better choice.
Russia
Russian President Vladimir Putin has suggested that we think back 100 years ago when empires were built by conquest, so his incursion into Ukraine is simply old fashioned empire building, or more to the point it’s a move toward restoring the former Russian empire known as the Union of Soviet Socialist Republics (USSR) that was disbanded in 1991 when Mr. Putin was head of external affairs for the city of St Petersburg. He became premier of Russia in 1999 under President Boris Yeltsin, who appointed Mr. Putin as his successor.
But this isn’t 100 years ago. Today, such conquests are judged on moral grounds as costing countless lives and punishable with financial sanctions and the possibility of war. Russia will suffer economically, but its relationship with China has changed the rules, emboldening Putin to make his move.
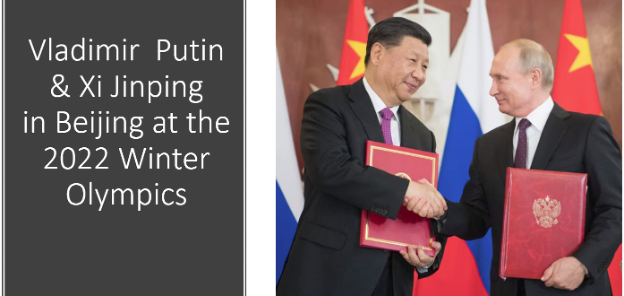
Russia and China got married and held a worldwide wedding reception in Beijing at the World Olympics. Each brings an estranged child to the marriage: Russia has Ukraine and China has Taiwan. The Russian invasion of Ukraine is a tactic in the geopolitical war with the US, a war that carries the unthinkable threat of mutual nuclear annihilation. China will watch, learn, and proceed in some way to grab Taiwan.
But the most important part of the rest of the story is the mighty US dollar. Caught in the Thucydides Trap, China is positioning to become the dominant world economy and is executing a clever strategy that is similar to the tactics employed in the TV series the Hustle where con artists exploit their “marks.” I recommend binging on this show.
In grifter jargon, China might be playing a “long con” on the U.S. (the mark) that takes years and patience. It’s conceivable that China is promoting MMT in order to encourage massive U.S. spending and money printing. The “convincer” is that MMT worked in the form of QE, so more is good. The “closer” in this hustle is COVID that necessitates unprecedented additional money printing.
In other words, the con is tricking the U.S. into devaluing and debasing its currency. See the above discussion on inflation.
The rest of the Russia story is that the mighty dollar is in jeopardy of losing its position as the world’s reserve currency, potentially replaced by China’s digital yuan. Unlike the Cold War that the U.S. won against Russia, the U.S. government appears to not grasp the gravity of a weak dollar as evidenced by its plans to continue spending many trillions. Has the U.S. been conned? Might the U.S. suffer hyperinflation?
U.S. stock market
The U.S. stock market is very expensive, and a correction is long overdue. As shown in the following graph, the stock market has grown consistently over the past 13 years, increasing 600%.
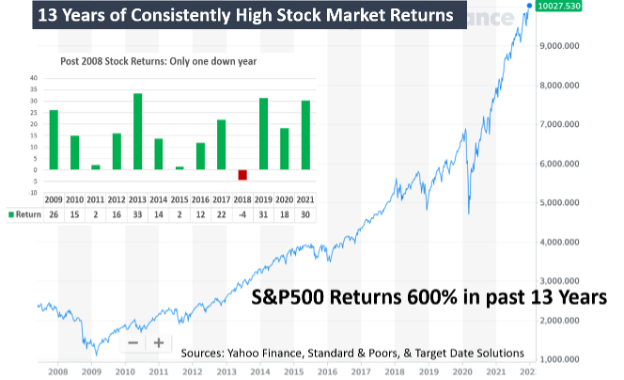
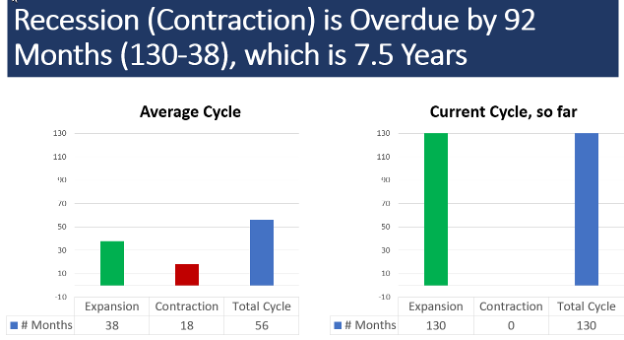
This has been the longest bull market on record, so a correction is long overdue. In fact, a correction is more than 7.5 years overdue.
But who says the stock market is expensive and, if it is, why?
There are several measures of stock expensiveness. The most common are price/earnings ratio and Warren Buffett’s stock market value/GDP shown in the next graph.
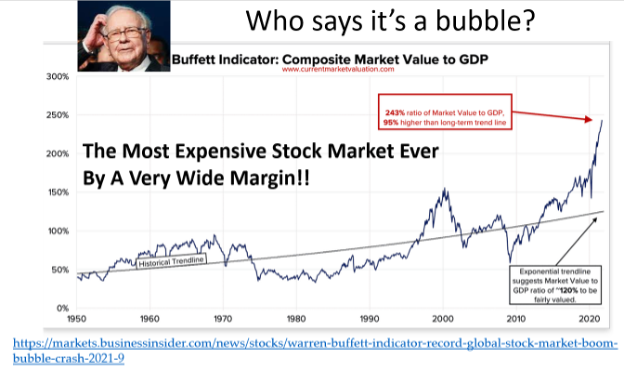
The Buffett measure has never been higher and is currently more than twice trendline.
Many factors explain the high price of US stocks. The two most important explanations are investor behavior and Fed stimulation. The following table outlines some of the investor behaviors that are driving stock prices.
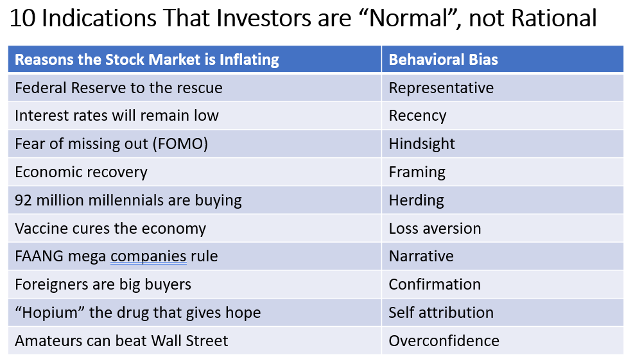
These behaviors tune out shocking news that should cause price declines. For example, on February 24, 2022, when Russia invaded Ukraine, the Dow Index actually went up, recovering from morning losses, and then it soared 834 points the next day as the capital of Ukraine came under attack.
Adding to investor behavior, the Fed is stimulating the stock market with QE. There’s a lesson to be learned from China’s stimulation of its stock market in 2015
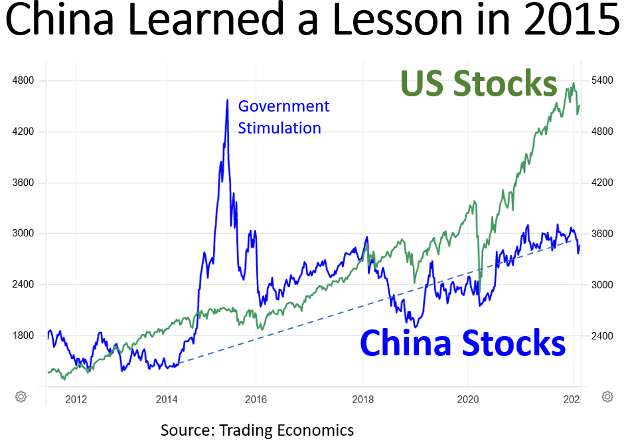
As you can see, the Chinese stock market quickly declined when its central bank took its foot off the gas. In the meantime, the US stock market has soared well above China’s while the Chinese economy grows faster than the U.S.
Nothing can stop the stock market’s upward trajectory, but the place to look is price/earnings ratio because it captures investor behavior – how much investors are willing to pay for future earnings. P/Es are currently above 30 but if they decline back to 15, the stock market will crash 50% – a big loss.
But what could cause a decline in P/E? As shown in the following graph, P/Es have historically been low when we have either inflation or deflation. In other words, fear is the driver when inflation deviates away from zero.
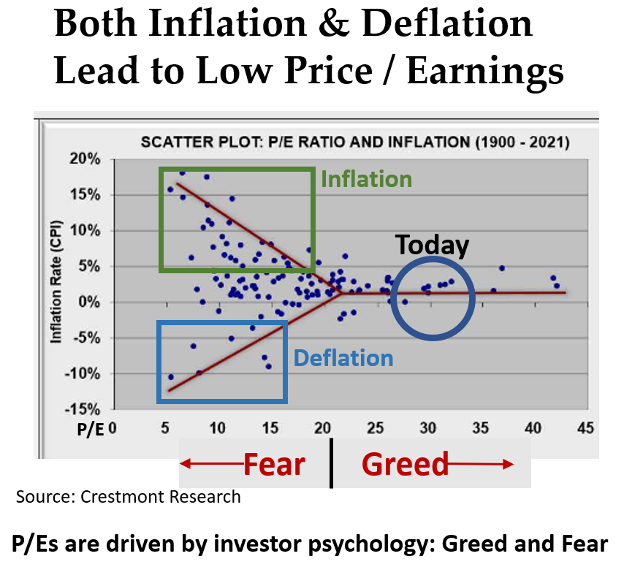
Nothing changes investor willingness to pay a lot for future earnings. Greed is the driver. But the rest of the story is that non-zero inflation should shift investor behavior from greed to fear. We already have inflation, but investors are holding out the hope that it is transitory, and that the Fed can control it. This hope is unrealistic, as explained in the sections above.
The US stock market will have its Minsky Moment that is a sudden, major collapse of asset values marking the end of the growth phase of a cycle. It’s likely to be quick and shocking.
Retirement crisis
The retirement crisis is real. Most baby boomers have not saved enough. Seventy percent of baby boomers, which is 55 million people, have saved less than $300,000. But an SEC report on “Perspectives on Retirement Readiness” concludes that the solution is not to increase investment risk. Rather, the solution is modifying behavior by encouraging beneficiaries to save more, which is the intent of new retirement readiness reporting requirements. This is sound advice for future generations but doesn’t change the current situation.
Inadequate savings do not warrant increased investment risk. Quite the contrary, lifetime savings need to be protected no matter how small because that’s all there is. Most of our 78 million baby boomers will spend much of this decade in the Risk Zone when investment losses can irreparably spoil the rest of life.
Investment losses at this stage in baby boomer lives exacerbates the crisis. Baby boomers cannot afford investment losses, whether they’re rich or poor.
Recent surveys of plan sponsors and their advisors report that the responding fiduciaries want to protect plan participants against losses as they near retirement. A Met Life survey reports “seven in ten plan sponsors are concerned about the impact of market volatility on those near or in retirement.” And a recent PIMCO survey reports that advisors want to protect those near retirement against losses of 10% or more.
Yet most of these fiduciaries have selected risky target date funds (TDFs) that will lose more than 10% for those near retirement in about 3 years out of 10, although you wouldn’t know it based on the recent past. The last 10 years have been incredibly lucky for target date fund beneficiaries nearing retirement since the odds of avoiding losses in all 10 years with 85% in risky assets is only 5%, yet none of the past 10 years has experienced such a loss. Fiduciaries should not expect a repeat.
Similarly, people who are managing their own portfolios rather than using target date funds are invested 60/40 stocks/bonds on average, which is about the same as target date funds near their target date. They too should expect losses of 10% or more in three years out of 10.
The most popular TDFs hold 85% in risky assets at the target date, considering equities and long-term bonds as being risky.
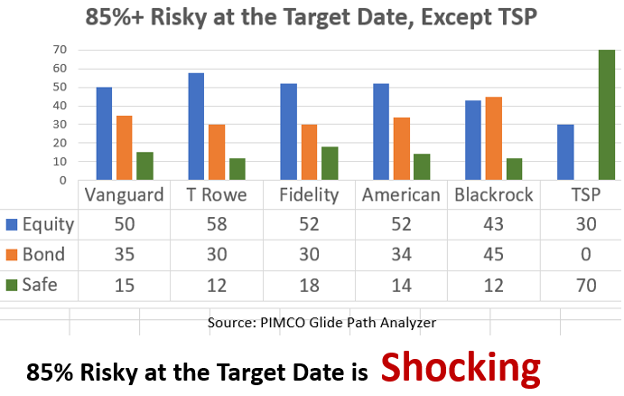
This is a mix that lost more than 30% in 2008, when bonds were far less risky.
The rest of the story for the Retirement Crisis is that most baby boomers are going to be seriously hurt, and will not recover because:
- A significant market correction is highly likely in this decade
- Baby boomers are taking a lot of investment risk, much more than they should at this time in their lives, and
- Baby boomers do not have the time to recover
The crime is that baby boomers have no idea that this possibility of ruin even exists. Lawsuits could follow because where there’s harm there’s a foul and TDFs now hold $3.5 trillion.
Summary
The following table summarizes the rest of the stories. Now you know.
Conclusion
When someone says “It’s different this time” they’re usually wrong, but in the introduction to my book I assert that it really is different this time for these five reasons:
- Interest rates have never been lower
- The US government has never printed more money
- Stock prices have never been higher
- The wealth divide in the US has never been wider
- There has never before been 78 million people in the Risk Zone
The future will tell us the rest of these stories. My book provides guidance to prepare for the future envisioned in this article, like protecting against inflation and stock market crashes.
Ron Surz is CEO of Target Date Solutions, Age Sage, and GlidePath Wealth Management, and co-host of the Baby Boomer Investing Show that you can binge watch on Patreon. He authored the Book Baby Boomer Investing in the Perilous Decade of the 2020s.
Please watch and support our Baby Boomer Investing Show and visit our Baby Boomer Libraries, our Target Date Fund blog, and our GlidePath blog.
Membership required
Membership is now required to use this feature. To learn more:
View Membership BenefitsSponsored Content
Upcoming Virtual Events View All


