How to Find Golden Needles in the Fixed income Haystack
Membership required
Membership is now required to use this feature. To learn more:
View Membership Benefits In a series of five installments, I will state the case for financial advisors to allocate to actively managed bond exchange traded funds (ETFs) and bond funds. In part 1, I discuss recent regime changes and reveal findings from the SPIVA scorecard and Morningstar’s U.S. Active/Passive Barometer.
The journey to select experienced and benchmark-beating tactical bond strategists begins by identifying multi-sector bond specialists. The U.S. and global bond markets are vast – much bigger than U.S. or international equity markets. Bond markets have many more sectors than those included in passive bond indexes.

Regime change – The great reset
When many Americans hear the words “regime change,” they think back to 2003. Twenty years ago (April 9, 2003), Saddam Hussein’s statue was toppled, and regime change was under way in Baghdad. The regime changes experienced by U.S. consumers and bond investors over the last 18 months were no less dramatic. Short-term cyclical dynamics will have long-term secular consequences for advisors, investors, and U.S and global markets.
The market regime changes in 2022 triggered a broad-based pullback by investors. Whereas in 2021, asset managers saw significant inflows into long-term funds (a minimum of $59 billion per month), inflows turned to outflows in the spring of 2022. In 2021, a tsunami of $1.6 trillion flooded into long-term U.S. stock and bond funds, whereas the first half of 2022 saw outflows of $281 billion.1
Now that central banks have reversed loose monetary policies, capital markets will experience heightened volatility, turbulence, and aftershocks.
The inflation regime change underway is unlike any in the last half-century, since the Paul Volker era. Volatility is being driven by supply-side inflation (which reached 40-year highs), continued supply-chain disruptions, a highly uncertain macroeconomic outlook and aggressive tightening by global central banks. The 10 developed-economy central banks have raised rates by a combined 3,740 basis points (bp) this cycle, with the Federal Reserve Bank leading the way with a 500 basis points increase in Federal funds (Fed funds).2
While the impact of tightening on markets was big and pervasive, its impact on economies has not been fully felt. Monetary policy takes time to work its way through the economy. Some estimates say it takes one year to three years to affect inflation.3 In 2022, the global bond market suffered historic losses of more than $2.5 trillion and the Bloomberg U.S. Aggregate Bond Index had its greatest loss since its inception.4
BlackRock ($10 trillion assets under management) urged “seismic shifts” in strategic asset allocation in its April 2023 New Regime, New Approach.5 The authors stated, “We are seeing a new regime of greater macro and market volatility play out.” They opined that the “set-and-forget” traditional portfolio construction is unlikely to work considering the regime changes in 2022-2023. Structural shifts driving the new regime mean that inflation will persist above pre-pandemic levels. Central banks will be forced to hold rates higher for longer. BlackRock portfolio strategists wrote that fixed income valuations are relatively attractive and higher bond yields have amplified the income in clients’ portfolios.6
Is it time to abandon active management given these inflection points in inflation, Fed funds rate hikes and higher bond yields? I recommend just the opposite! Now is one of the best opportunities in two plus decades to seek active managers in the fixed income space. Capitulating on fixed income investing is like driving forward while looking through the rearview mirror.
Many bond market investors started this year on an upbeat note. They seemed convinced that the battle versus inflation had been won. Federal Reserve policymakers were hoping that inflation would decelerate from its 9.1% CPI peak in June 2022. But the assumption that post-COVID higher inflation would be transitory has proven to be a mirage.
On May 3, 2023, the Federal Open Market Committee (FOMC) voted unanimously to boost the Fed funds rate by a one-quarter point to a target range of 5 to 5.25%.7 That’s the highest Fed funds rate since the summer of 2007, when rates peaked on the eve of the global financial crisis. In less than 14 months, the FOMC raised the Fed funds rate 10 times from 0.25% to 5.00% to 5.25%.8 In past epochs of rising rates, bond investors eked out positive returns, since income from bond coupons offset bond price declines. However, in the 24-months prior to this cycle, there was no coupon cushion to buffer prices while the FOMC was raising rates by 500 basis points.
On June 14, 2023, the FOMC decided to pause Fed funds rate hikes, leaving the target at 5% to 5.25% to allow time to assess the impact of past monetary tightening. The Fed’s hawkish hold signals that it does not believe its policies have been sufficiently restrictive to reverse inflation’s rise. At least two Federal Reserve bigwigs publicly stated that inflation remained “too high” and “stubbornly persistent.” They both signaled that more tightening is likely in the months ahead.9 There’s a tug-of-war between the Fed chief and FOMC and bond market forecasters. This writer remains unconvinced that the Fed will pivot and cut Fed funds in 2023.
The beast of persistent elevated inflation is proving tough to tame. The latest Bureau of Labor Statistics release – the so-called “inflation print” – was on June 13, 2023 (a day before FOMC members met). The CPI — which excludes volatile food and energy prices — rose 0.4% in May from a month earlier, extending its streak of worrisome inflation readings.10 The core CPI clocked in at a 5.3% rate in year-over-year readings.
The personal consumption expenditures (PCE) price index, which also excludes food and energy, is the Fed’s preferred measure of underlying inflation. The Fed prefers the PCE over core CPI because the core PCE is considerably less volatile. The Fed targets 2% based on a broader measure (the CPI) but views the core PCE gauge as a better indicator of the trend. The PCE, also preferred by economists, was up 4.7% year over year.11 Inflation remains elevated – well above the 2.1% average in the three years preceding the pandemic. The data shows that inflation, while moderating somewhat, remains much too high.
When it comes to inflationary regime changes, the half-lives of rising and declining inflation are longer lived than most consumers, market participants and policymakers appreciate. Inflationary expectations are stickier than anticipated. Markets and policymakers are still too optimistic on inflation and underestimate its duration and effect on asset prices, markets, and people’s pocketbooks.
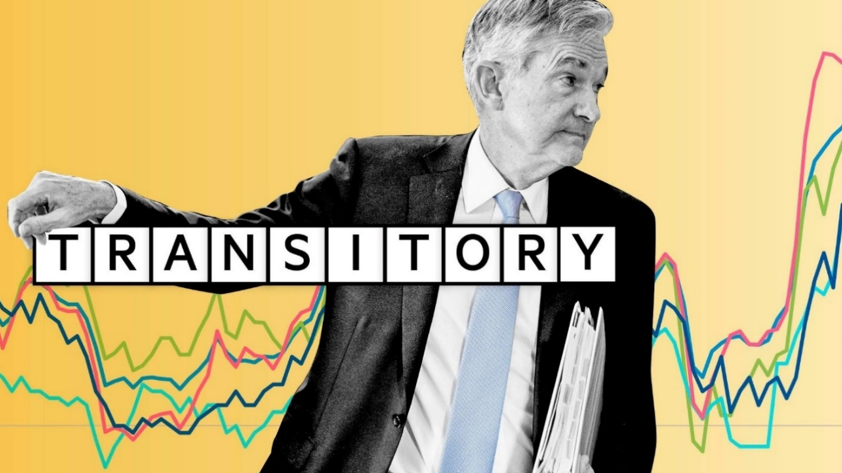
Transitory was illusionary
Transitory: (adj) – not permanent, liable to disappear by itself
In 2021, Federal Reserve Chairman Jerome (Jay) Powell and Treasury Secretary Janet Yellen repeatedly used the word “transitory” to describe inflation. When inflation crossed the 4% annual threshold in April 2021, what were Powell and Yellen thinking when they both declared that inflation was transitory?12 With the benefit of hindsight, it was clearly a mistake by the Fed chief and Treasury Secretary to declare inflation transitory when it was rising rapidly. The dynamic duo’s transient messaging inflicted widespread havoc on Main Street household budgets and put a serious dent in their Wall Street “cred.”
In November 2021, J-Pow, as he’s known on social media, retreated from calling U.S. inflation transitory. In testimony before the U.S. Senate, Powell said about the word transitory, “it’s probably a good time to retire that word.”13 It’s probably also a good time to retire and retreat from believing this inflationary bout will be anything but long term. Once inflation emerges, it can take years or a decade or more to restrain it.
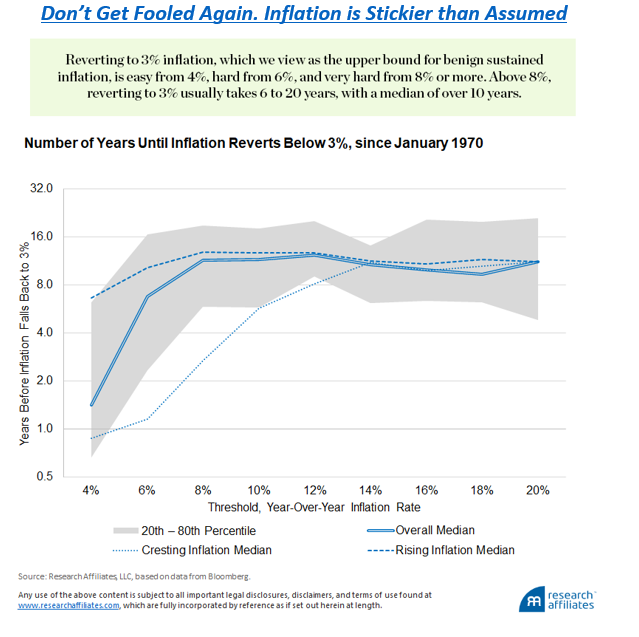
There is insightful research from Rob Arnott and Research Affiliates on how long it took for inflation to fall by half. They looked back to January 1970 and found 52 instances where the U.S. inflation rate rose above four percent (4%). They presented compelling evidence and charts of the difficulty of inflation rates reverting to half. After inflation crossed the 6% threshold, the median number of years to cut inflation to 3% was 7.5 years.
Given the recent U.S. inflation rate, when the CPI less food and energy rose 5.3% over the last 12 months14, history shows the median length of time to reduce to 3% annual inflation was 10 years, with a range of 6 to 20 years. (See chart below.) The good news on the inflation front is that the CPI has come down since cresting at 9.01% in June 2022.
Is it possible that inflation will quickly recede to 4% and then drop to 2% in a year or two? It’s possible – just not likely! There’s a quote attributed to Mark Twain, “‘History does not repeat itself, but it rhymes.” If the last half century of the CPI behavior rhymes, it’ll be somewhere between 2030 and 2033 before we see 3% annualized inflation – barring a severe recession.
How to find golden needles in the fixed income haystack
Here’s a $64 billion question. Buy the whole haystack or diligently seek the golden needle of fixed income offerings? There’s a haystack of 2,618 fixed income open-end, closed mutual funds and bond ETFs with assets of $5,975,100,000,000 (as of March 2023).15
Here’s how to find a needle in a haystack via the fixed income (FI) SPIVA Scorecard and with research from Morningstar.
You’re likely quite familiar with the S&P Indices Versus Active (SPIVA) scorecard. It is the semi-annual survey that chronicles index funds’ performance versus active funds. SPIVA data informs a contentious debate over the relative merits of active versus passive investing. What do 20-years of SPIVA scorecard survey statistics say?
- Most active equity and fixed income managers underperform most of the time.
- After adjusting for risk, most active managers still underperform most of the time.
- The tendency for underperformance typically rises as the observation period lengthens.
- SPIVA scorecard’s silver lining is that roughly one third of U.S. active fixed income fund managers outperform their passive peers.16 With a modest amount of due diligence, astute financial advisors can identify and allocate to these bond benchmark beaters.
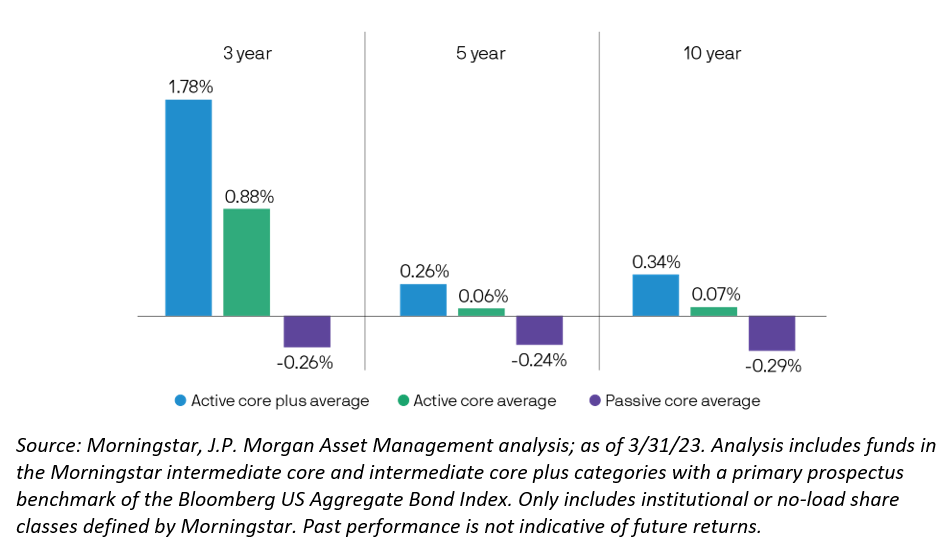
Ditto the Morningstar’s U.S. Active/Passive Barometer – Year-End 2022 survey, which showed similar results. Among active managers, 30+% across their three fixed income categories beat their passive peers. For example, 38% of active managers in intermediate-core bond funds outperformed – net of fees –passively invested fixed income funds.17
Within largest bond categories, active fixed income adds value
Actively managed fixed income: Measure and react to new regimes
Inflection points and new market regimes do not come along that often. But my four decades of investment management experience informs historical comparisons between market environments. While 2022 is in the rearview, this new market regime will be with us for a while. There’s usually a significant policy lag between implementation and effect, meaning that we won’t know whether the FOMC has overtightened or not tightened enough for 12-18 months.
Further tightening risks a deeper recession. But if central banks do not hike rates, inflation may not moderate satisfactorily. This would force a more aggressive and/or lengthier tightening cycle. A prolonged tightening cycle would increase pressure on the banking sector and recession risks, delaying an economic recovery.
The success of actively managed fixed income funds depends on combining in-depth research, market forecasting and the experience of a portfolio manager team. The results can be evaluated when compared to an appropriate benchmark. Active fixed income managers strive to deliver positive investor outcomes and avoid outsized risks that may be inherent in passive approaches. This circles back to the lead premise that there’s no need to buy the whole fixed income hayfield when searching for opportunistic risk-compensated yield.
As of May 2022, actively managed strategies accounted for 69% of the assets in fixed income mutual funds and ETFs.18 Despite the tsunami of asset flows into passive funds, over two-thirds of bond fund assets are run by active portfolio managers. With the crosscurrents of changing inflation expectations and central banks’ policy tightrope, active fixed income managers are positioned to capitalize on market inefficiencies with factor-based investing.
Active fixed income strategies offer investors numerous advantages over passive index strategies, providing enhanced risk-adjusted performance potential. Investors are seeking risk-managed fixed income returns in the high inflation and rising rate environment.
Successful active fixed income management depends on astute, informed asset manager due diligence and selection. When allocating to fixed income strategies, advisors should focus on portfolio managers with proven factor-based investing results and broad fixed income sector expertise to deliver superior client outcomes across economic and market cycles. When selecting active fixed income funds or ETFs, advisors ought to consider the potential benefits of risk premia or style factors. Fixed income factors can decrease the risk of typical investment-grade and multi-sector credit approaches, complement existing portfolios, and enhance the 60/40 portfolio performance.19
Macroeconomic and style factors may result in superior risk management and enhanced risked-adjusted returns in bond funds and bond ETFs. Considering the complexities of the fixed income markets and nuances between sectors, financial advisors should pay careful attention to the construction of factor-based bond portfolios. Key considerations include determining how to target each factor, addressing liquidity and trading costs to reduce portfolio turnover, and controlling for unintended sector, credit, and duration exposures.
Variations in approaches to addressing these challenges can lead to vastly different risk and return profiles. Therefore, advisors should carefully evaluate factor-based fixed income strategies to ensure they complement their clients’ existing portfolios and align with their desired risk and return objectives. Financial advisors should seek active managers who explicitly and consistently implement factor exposures in their bond funds, bond ETFs or portfolios.
Managing such a strategy is not easy, as it requires a multi-faceted team with special skill sets—expertise in multiple bond sectors and a proven ability to compare opportunities across sectors. When conducting due diligence, advisors should look for fixed income managers with at least a decade of experience managing multi-sector portfolios through varied market cycles. Fixed income strategists should consist of a team of specialists experienced in successfully applying style factors, with quantitative tools and processes, and risk framework to build sustainable yet flexible portfolios.
In summary, you don’t have to be the late, legendary Haystack Calhoun, wrestler extraordinaire, to find a golden needle in the U.S. or global fixed income haystacks. The SPIVA scorecard and Morningstar’s Active/Passive Barometer – Yearend 2022 confirm that a select subset of active fixed income managers routinely outperform their benchmarks and passive peers. It’s time to untether the AGG straight jacket and embrace multi-sector, multi-factor fixed income funds managed by multi-faceted strategists.

This is part one of a five-part series. In part 2, I will opine why it’s “Time to Bag the AGG.”
Rick Roche, CAIA, is managing director of Little Harbor Advisors, LLC, a position he has held since April 2013. He is a 42-year veteran of the industry, dually registered adviser, and CAIA charter holder. Over the course of 40+ years, he’s trained thousands of credentialed financial advisors in practice management and a variety of timely investment topics (85+ CE programs over the last 4+ years). His bio is here.
The information contained in this publication was obtained from sources believed to be reliable, but its accuracy cannot be guaranteed. Opinions expressed herein are those of the author, Rick Roche, and not those of Little Harbor Advisors (LHA).
1 McKinsey & Company, “The Great Reset: North American Asset Management in 2022”, Oct-2022.
2 Flasseur, V., Reuters, “Central banks stick to rate hikes with eye on market turmoil”, Mar 23, 2023; U.S. Federal Reserve, Press Release, May 3, 2023; and Dolan, M., “Morning Bid U.S.”, Reuters, Jun 22, 2023.
3 Schrager, A., Bloomberg, “The Fed Is Giving Americans a Harsh Lesson in Lag Time”, Washington Post, Oct 18, 2022.
4 McCormick, L., and Worrachate, A., Bloomberg News, “Bondholders Risk $2.6 Trillion Hit on Even a Modest Yield Rise”, Oct 23, 2022.
5 Boivin, J., et. al., BlackRock Investment Institute, “New Regime, New Approach”, April 2023.
6 Ibid., Boivin, J., et. al., “New Regime, New Approach”, April 2023.
7 United States Federal Reserve, Press Release, May 3, 2023.
8 Tepper, T., Forbes Advisor, “Federal Funds Rate History 1990 to 2023”, Mar 22, 2023.
9 Marte, J., and Matthews, S., “Fed Officials Say Rates May Need to Go Higher to Tame Inflation”, Bloomberg, June 16, 2023.
10 Levin, J., “Fed Will Find Inflation Residue Surprisingly Sticky”, Bloomberg, Jun 13, 2023.
11 U.S. Bureau of Economic Analysis (BEA), “Personal Income and Outlays, April 2023”, May 26, 2023.
12 Arnott, R. & Shakernia, O., Research Affiliates, “History Lessons: How ‘Transitory’ Is Inflation?”, Nov 2022.
13 Miller, R., Bloomberg, “Jerome Powell Ditches ‘Transitory’ Tag, Paves Way for Rate Hike”, Nov 30, 2021.
14 U.S. Bureau of Labor Statistics, “Consumer Price Index News Release”, Jun 13, 2023.
15 Duvell, James, Economist, ICI, email correspondence rcv’d on 05/03/2023.
16 S&P Dow Jones Indices, “SPIVA® U.S. 2022 Scorecard”, Mar 7, 2023, pages 1-2, 7-8, 21-22.
17 “Morningstar’s U.S. Active/Passive Barometer Year-End 2022”, pages 1-2, 28-33.
18 Ibid., Christensen, B., J.P. Morgan, “Active Fixed Income in an ETF wrapper”.
19 Raol. J., Invesco, Jul 5, 2019.
Membership required
Membership is now required to use this feature. To learn more:
View Membership BenefitsSponsored Content
Upcoming Virtual Events View All