Advisor Perspectives welcomes guest contributions. The views presented here do not necessarily represent those of Advisor Perspectives.
Bond market pundits often warn that bear yield curve flatteners or inverted yield curves ultimately lead to recessions. Similarly, some equity experts caution that periods of violent back-and-forth rotations among stock sectors and/or style factors are precursors to a market top. Additionally, the combination of a bearish flattening trend and volatile equity rotations leads some analysts to make recession forecasts with concerning market repercussions.
However, predicting economic or financial market activity is not as simple as following two indicators. Bear flattening trades, inverted yield curves, and frantic style rotations (factor or sector) are not definitive warnings of a market peak.
They are extremely informative about where the economy, markets, and investor sentiment stand, but they do not tell investors whether or when the economic or market cycle will turn. Knowing where you are in a cycle is not the same as knowing when it ends. Confusing the two is a common mistake and can be a costly one for investors in late-cycle analysis.
Given that both indicators are currently flashing red, they can serve as important warnings of pending financial market and economic turbulence, but also as deceptive omens.
What the Yield Curve Tells Us
The shape of the yield curve, or the difference in yields between long- and short-term U.S. Treasury securities, indicates the market's expected path for short rates plus a term premium. In other words: Where does the market expect Fed Funds to be in the future, and how much of a yield premium is the market paying investors to take on the inflation, economic, and oversupply risks of holding Treasury securities?
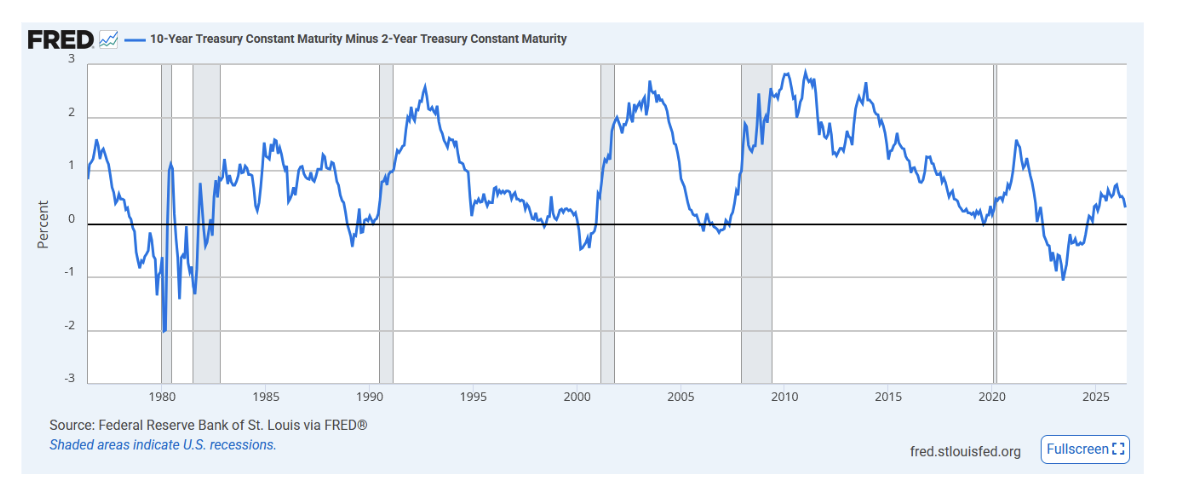
To help appreciate where the yield curve stands today and how it's changed recently, we've included the graph below.
A notable feature of this long-term graph is that every time the yield curve flattened and inverted — the 2-year yield rose above the 10-year yield (the blue line fell below 0 on the y-axis) — a recession (gray) followed. There is one exception. In 2022, the curve flattened, inverted, and then steepened, yet a recession has not materialized.
Current Curve Flattening
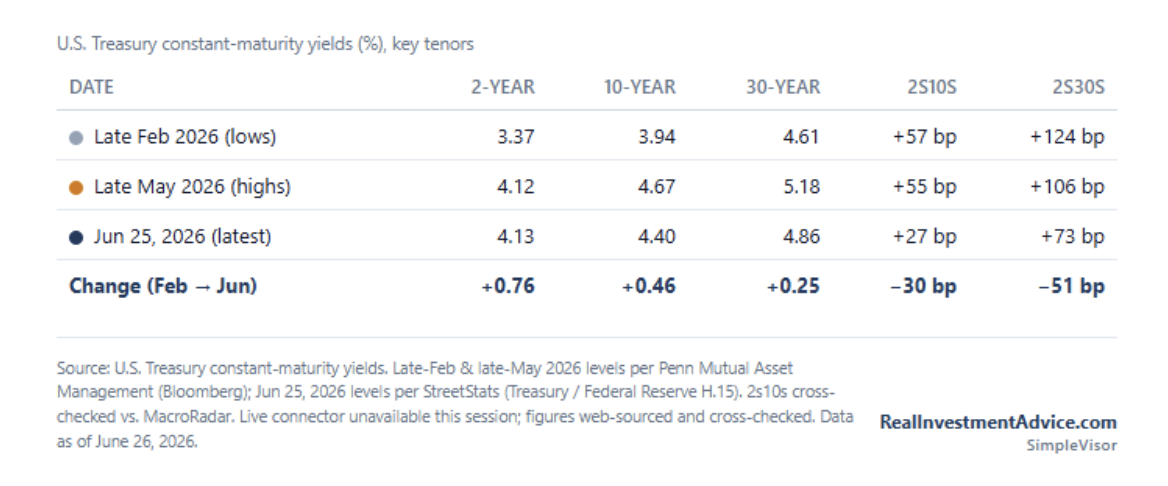
Recently, the yield curve has been flattening (declining) while bond yields have risen. In bond market parlance, that is called a bear market flattener (higher yields and a flattening yield curve). The table below shows that since late February, when the Iran conflict started, the 2-year note has risen by 76 basis points, the 10-year note by 46 basis points, and the 30-year bond by only 25 basis points. As a result, the 2/10-year yield curve flattened by 30 basis points and the 2/30-year curve by 51 basis points.
A bear flattening is the result of investors raising their collective expectations for higher short-term rates. This can be due to strong economic growth expectations and/or higher prices. At the same time, longer-maturity yields are less responsive, likely due to a subdued long-run growth forecast or a belief that higher inflation is temporary.
The flattening or inversion of the yield curve creates more restrictive financial conditions, acting as a brake on economic activity. An economy that warrants slowing is often one that is late in its economic cycle.
When the long-maturity yield falls below the short-maturity yield (inverts), the usual interpretation is that investors expect future rate cuts because policy and/or rates are restrictive enough that the central bank will have to reverse course.
However, that definition fails to consider the term premium, the compensation investors demand for holding longer-duration notes and bonds. A curve can flatten or even be inverted because the market expects rate cuts and/or because the term premium has compressed toward zero. Thus, it's not definitive whether an inverted curve is due to expected rate cuts, well-anchored inflation, or forecasts of an economic downturn.
Equity Rotations
Equity leadership can be a tell of similar concerns, but through a different mechanism. Stocks are claims on future corporate cash flows, and those claims have duration. For instance, growth companies tend to have minimal cash flows or even run losses in the near term, but expectations are for large and growing earnings in the future. Thus, valuations for growth companies are based on distant-future cash flows and, accordingly, have a long duration.
Conversely, value companies generate cash flows that are nearer and more certain and are therefore considered to have shorter durations. When short-term interest rates rise and uncertainty about the future increases, the present value of distant cash flows is marked down far more than that of near cash flows.
For example, the one-year present value of $100 at a 5% discount rate is $95.24, and at a 4% discount rate, it's $96.15. The 1% change in rates impacts the present value by $0.91. Conversely, the 10-year present value of $100 at 5% and 4% is $61.39 and $67.56, respectively, resulting in a difference of $6.17 for the 1% change in rates. Accordingly, valuation multiples of growth companies tend to compress relative to those of value companies.
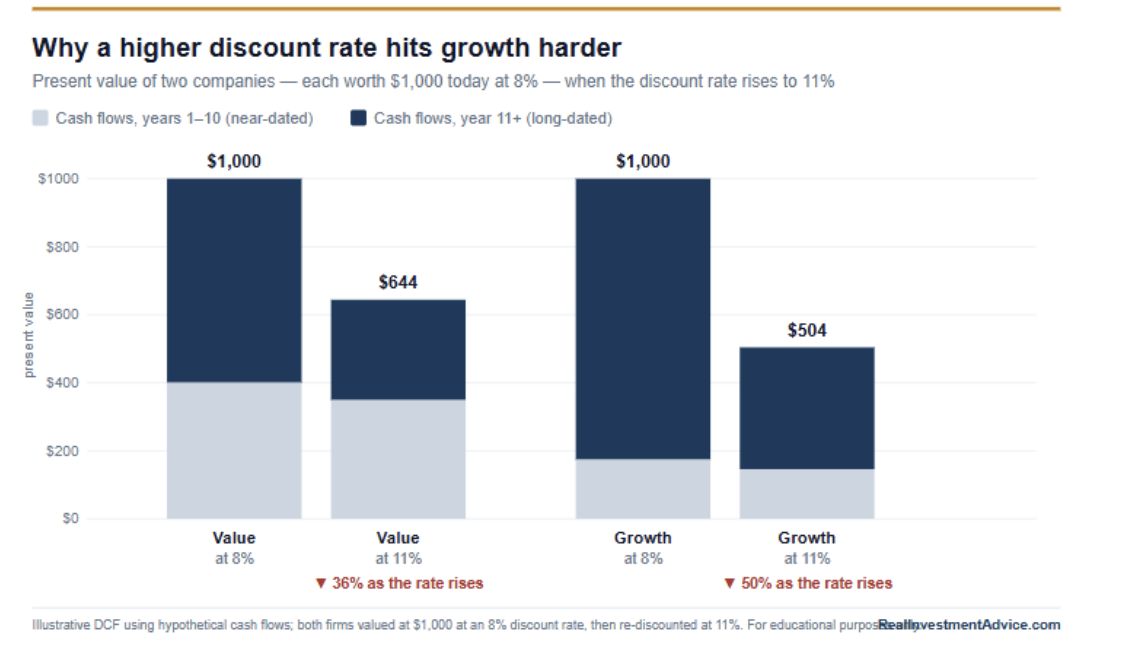
As we share below, in a hypothetical example, the value of the future cash flows of a value company with more upfront cash flows declines less with a 3% increase in the discount rate than that of a growth firm with more cash flows expected in the distant future.
A growth-to-value rotation is the equity market's version of the yield curve flattening: Both are duration-related repricings driven by the same change in the cost of money.
When Rotations Become Volatile
Typically, equity rotations in a late-cycle market become more volatile. In other words, no style or sector leads or lags for long stretches. These rapid rotations help clue us into a market regime that is becoming contested or changing.
Through the middle of an expansion, the macro picture is often clear with trend growth, accommodative or neutral monetary policy, and a steady discount rate. Because the regime is stable, leadership often remains in place for long periods as investor capital concentrates on the companies that benefit most from prevailing conditions. However, the market regime becomes challenged as changes in the broad economic and market environment are anticipated. Investors start asking questions such as:
- Is monetary policy changing?
- Is growth decelerating or reaccelerating?
- Is inflation sticky or transitory?
As new economic and corporate data feed into the market, the discount rate becomes more sensitive. The market is forced to continually toy with its assumptions, and leadership ping-pongs as a result.
The volatility of style leadership is a proxy for regime uncertainty. The whipsaw action itself, not necessarily which types of stocks lead or lag, is the tell. A market that cannot decide between value and growth is a market that cannot decide what the discount rate will be, which is to say, a market that senses the regime is changing beneath it.
False Signals
There is a complication with what we have presented. The yield curve can be distorted by forces unrelated to the business cycle, such as shifts in the bond term premium, large-scale asset purchases (quantitative easing) or their reversal (quantitative tightening), and significant government bond supply. Equity rotations are at times heavily influenced by momentum chases and bouts of speculative behavior. Moreover, the rise of passive investment strategies tends to accentuate momentum trends.
When other factors influence the yield curve or the volatility of equity rotations, the forecast embedded in the curve and rotations becomes muddied and can falsely signal a market and economic top.
Condition and Timing Indicators
This brings us to the distinction that should govern how the signals are used. There is a difference between a condition indicator and a timing indicator. A condition indicator describes the economic and market landscape. A timing indicator tells you when the next event arrives. Flat curves and unstable leadership are good indicators of conditions but can be poor timing indicators.
This concept is like weather forecasting. A falling barometer tells you the atmosphere favors a change in the weather, likely a storm. It does not tell you what day or time the storm will arrive. In fact, despite the drop in barometric pressure, the storm may never form. Reading a barometer as a surefire countdown clock to a storm is an error, no matter how reliably storms and falling pressure correlate.
Summary
If you cannot extract a time frame for an economic and market peak from these signals, then what purpose do they serve?
The answer is that they help us prepare for a widening series of potential outcomes. Today, for instance, with the yield curve flattening and a series of violent rotations, we are maintaining stricter stop-loss levels, paying closer attention to technical analysis, focusing on our SimpleVisor rotation analysis tools, and assessing our risk more frequently.
The signals suggest the regime may be changing, and we should be prepared for that possibility. However, until that becomes more evident, we must take advantage of what the market has to offer.
Read more by Michael Lebowitz:
Michael Lebowitz is a portfolio manager with RIA Advisors and author for Real Investment Advice. For more information, contact him at [email protected] or 301.466.1204.
Join RIA Advisors and elevate your career within a deeply experienced team focused on innovation. Our collaborative environment is built on a foundation of advanced technology and effective investment models, designed to enhance your ability to serve clients and grow your practice. Benefit from a supportive culture that encourages professional development and fosters a forward-thinking approach. By joining our team, you’ll be part of a group dedicated to excellence and continuous improvement, empowering you to focus on building meaningful client relationships and pursuing your business ambitions. Discover the advantages of working with our accomplished advisory team by starting your conversation today.
A message from Advisor Perspectives and VettaFi: Discover something new! Click here to register for our upcoming webcasts.
More Innovative ETFs Topics >
 Advisor Perspectives welcomes guest contributions. The views presented here do not necessarily represent those of Advisor Perspectives.