Who's Selling And Who's Buying As The Dow Trades In Record Territory?
Last week turned out to be another positive week for investors, as the S&P 500 finished the week up 2.2 percent.
However, as my regular readers know, I consider the current market risk high, and have been building a case these past few weeks that we will soon be entering a bear market.
This week I want to take a deeper look into inflows and outflows of capital. Specifically, where the money has been coming from to keep this market rising.
ETF Inflows vs Outflows
ETFs (exchange traded funds) have increased in popularity over the past few years as they are seen as a more efficient way to manage portfolios (low cost, instant diversification of asset classes, etc). Investors poured a record $188 billion into US-listed ETFs in 2012, eclipsing a previous record of more than $175 billion in 2008.
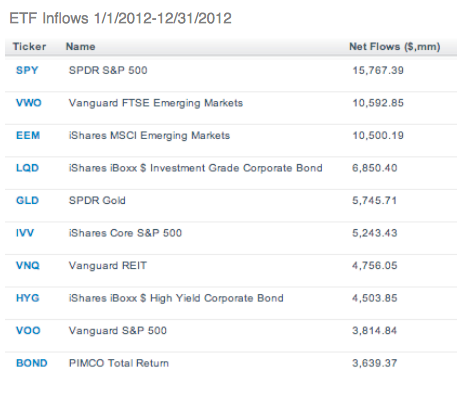
Source: IndexUniverse
However, in 2013, ETF inflows have actually been decreasing even as the Dow trades into record territory. (S&P 500 index has yet to trade at record highs.)
Year to date, the S&P 500 ETF (SPY) and the Dow Jones Industrial Average ETF (DIA) have outflows of $4.8 billion. Hardly the number you would expect to see in a rising market.
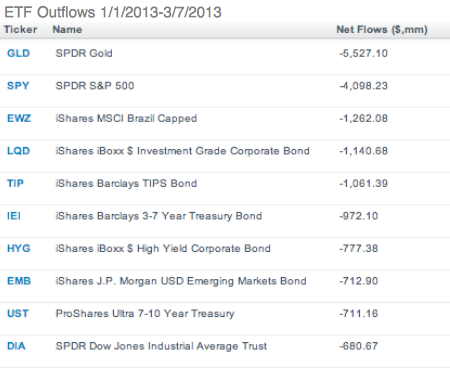
Source: IndexUniverse
Corporate Insiders
It’s not just the broad-based indices seeing outflows; corporate executives have been starting to exit the doors as insider selling has recently spiked up:
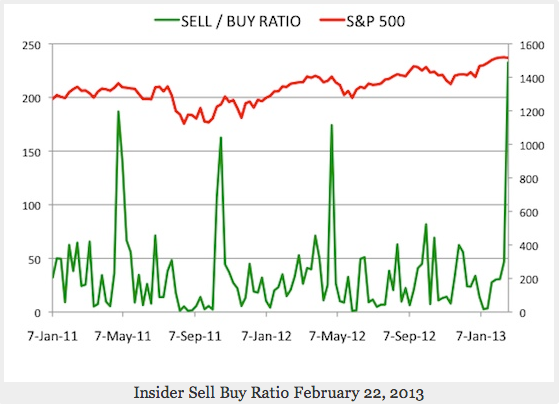
Source: Global Economic Intersection (Econintersect)
The Leverage Rally
If ETFs are seeing outflows and corporate insiders are selling, what is making this market rise?
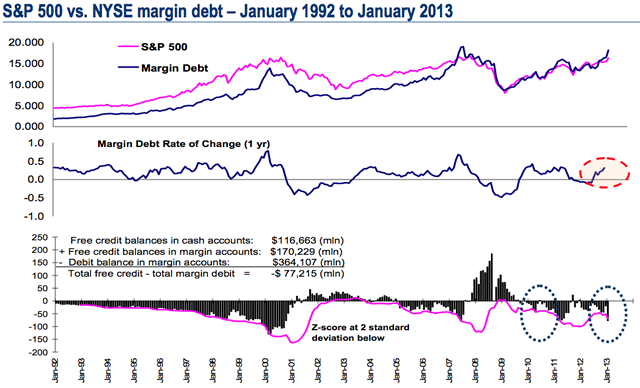
According to a recent piece from BofA/Merrill Lynch technical analyst Mary Ann Bartels, borrowing in margin accounts has become particularly high recently:
Net Free Credits from the NYSE Margin Debt data shown in the chart below is essentially a measure of cash levels in margin accounts. Current levels have fallen to levels that have generated a tactical sell signal based on a 2-standard deviation Z-Score reading.
The last time a sell signal was generated was on April 2010 and the S&P 500 subsequently corrected by 16% in two months.
The increase in margin is a signal that this record-breaking rally has a high level of risk associated with it.
Institutional vs Individual - Are Mom and Pop on the wrong side?
Most investors have seen some version of the following chart showing how institutional investors outperform individuals:
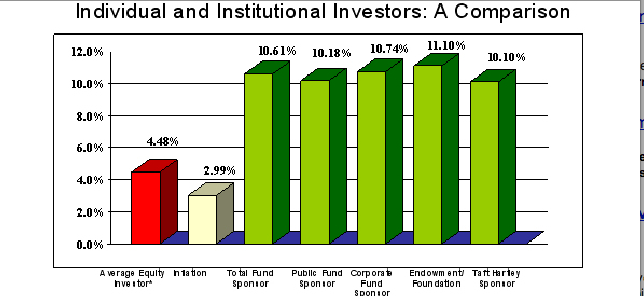
Source: Fidelity
Why this under-performance occurs is based on behavioral finance — a lengthy topic that I may touch on in more detail in the future. The main point is, the average individual investor tends to buy at the top and sell at the bottom.
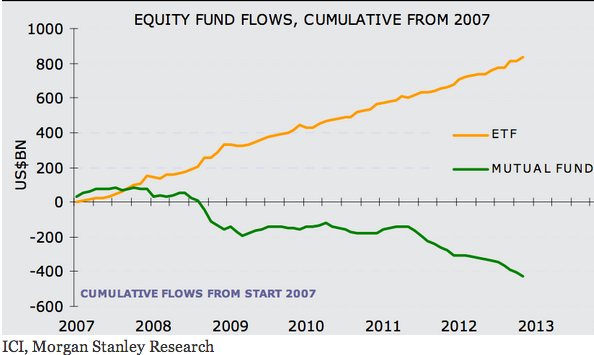
The rise in the stock market since 2009 has seen heavy participation from institutional investors, but little participation from individual investors. Individuals have been pulling money out of the stock market, just as institutions have been pouring money in:
As the market has entered into a riskier environment, individual investors have been excited by the Dow’s record-breaking streak making the nightly news.
After withdrawing more than $150 billion out of US stocks last year, individual investors have been on a buying spree in 2013, with $17 billion flowing back in, according to the latest data from the Investment Company Institute.
While a high-risk market can rise for some time (like it did in 1999), risk continues to increase in the market and caution should be used.
© Riverbend Investment Management