Last week’s string of bad economic data may finally be the tipping point we have been waiting for. For the past few weeks, I have become more and more bearish on the US economy and stock market. Payroll tax hikes, sequestration, and slowing global growth mixed with a euphoria for a rising stock market have pushed the markets into a high risk environment.
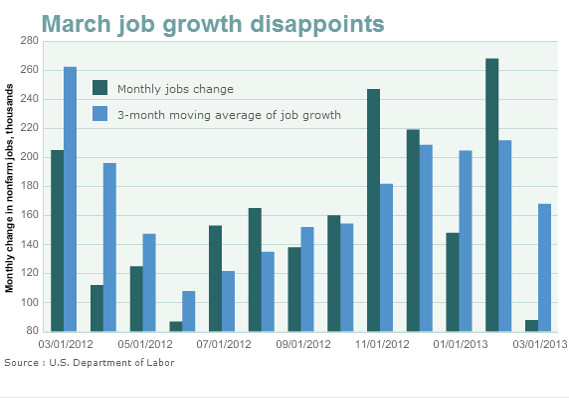
Friday’s nonfarm payroll report showed that job gains were 88,000 last month, the lowest in nine months (January, February and March showed an average nonfarm employment gain of 168,000) And while the unemployment rate improved slightly, as it fell to 7.6% from 7.7%, the decline was from more workers dropping out of the labor force than actually being hired.
Opportunities - US Bonds and Japan
After a 9 month decline in prices, the 30 year bond has reversed it’s downward trend:

This reversal is due to:
1) Investors who are not caught up in the current euphoria stage of the stock market and are reallocating away from equities and into safe haven assets.
2) Flight to safety from European investors worried about a post Cyprus fallout.
3) Poor economic data has bond investors hoping the Fed will continue its stimulus strategy throughout 2013.
The other big news this week was the Bank of Japan announced a massive stimulus package in order to stop Japan’s 15 year deflationary cycle by injected $1.4 trillion over the next two years.
Just to give you an idea of how large that is – if we equalized Japan’s GDP with the US, the Fed would be purchasing $200 billion per month or $2.4 trillion per year!
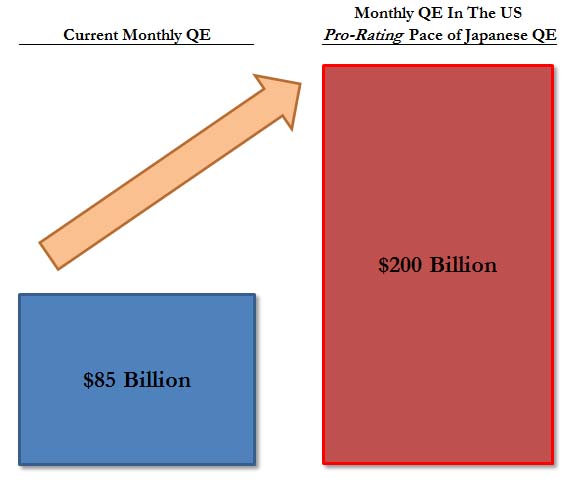
Source: Zero Hedge
Conservative investors may be fleeing for US bonds, but more aggressive global investors may be looking to replace US equites with Japanese equities and bonds. The Bank of Japan is clearly attempting to do what ever it can to re-inflate Japan’s economy. This is the opposite of what the Fed is doing as US investors are trying to guess if the Fed will slowdown its stimulus program later in 2013 (after Friday’s poor economic numbers however, a slowdown in 2013 is unlikely).
So, what's next for the US stock market?
Past market pull backs which have occurred in the recent multi-year uptrend have ended near the S&P 500′s 200 day moving average. This would be a “healthy” 8-9% drop from where we are today:
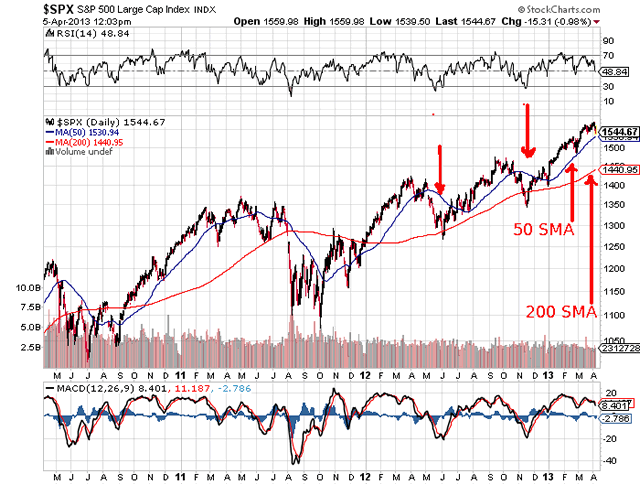
A break below the 200 day moving average would signal that the markets are in for a larger multi-month decline – but let’s not get ahead of ourselves yet.
As I have mentioned in past reports, volatility in the market is still low and the reversal in US bonds seems to be just beginning -indicating most investors are still in a Pollyanna stage. A break below the 50 day SMA may quickly spook investors who have had it pretty easy in 2013.