So far, so good. Optimist falling from a skyscraper.
Thankfully, 2008 has become a distant memory. We’ve made back its 37% loss and a lot more. Things are good, but are they going to stay that way? We still face anemic economic growth, burgeoning debt, global social unrest and more. The S&P 500 has returned 145% in the past 55 months (4.5 years).
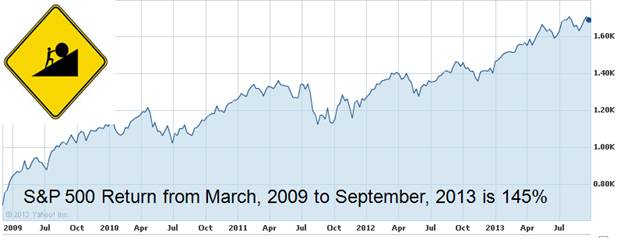
Source: Yahoo Finance
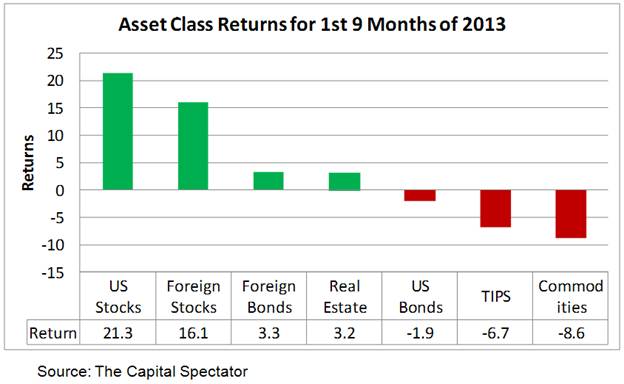
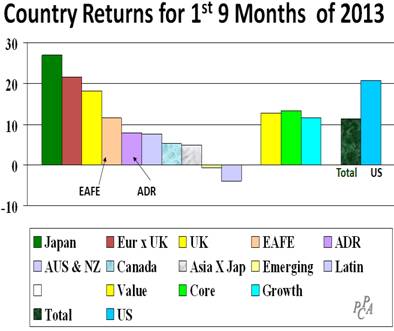
As for the more recent past, U.S. stocks earned 6% in the third quarter of 2013, bringing the year-to-date return to a lofty 21%. The EAFE index did even better in the quarter, earning 12%, bringing its year-to-date return to 16%. In fact, as shown in the following graph, no other asset class comes close to the return on U.S. stocks so far this year. Although, upon closer inspection we find that Japan has outperformed the U.S. and Europe has matched us, both on a dollar-basis. Will this dominance continue? Read on for some clues.
In the following, I examine the details of what worked in stocks around the world in the year-to-date, providing quick insights into market segments that have succeeded and failed. I also provide a forecast of what will work in the next quarter if momentum effects prevail. I conclude with a discussion of a couple “hot topics,” namely target date funds and hedge funds.
U.S. stocks
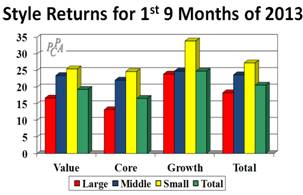
Growth stocks have led the way in 2013. Small-cap growth stocks performed best, earning 35%. By contrast, large-cap-core companies earned only 13%, and large-value earned only 17%. Other than these extremes, style returns clustered around 23%, a pretty good place to be. This has been one of those unusual periods where the “stuff in the middle” (core) has not performed in line with the “stuff on the ends.” I use Surz Style Pure® classifications throughout this 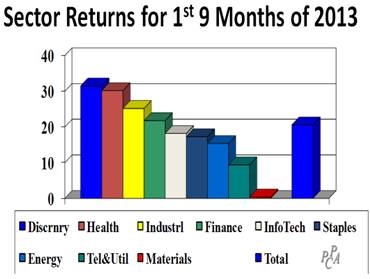 commentary.
On the sector front, consumer discretionary and health care fared best, earning more than 30%. By contrast, materials eked out a measly .4%, and telephones-&-utilities also lagged with a 9% return.
But the interesting details lie in the cross-sections of styles with sectors, especially if we are interested in exploiting momentum effects. In Searching for Alpha in Heat Maps, published in early April, I showed how heat maps could be used for profit, and forecasted future winners and losers, based for the year ending just prior to each quarter. The forecast for this third quarter is my third forecast, and I am keeping score. I’ll report the results for the full year in my fourth quarter commentary.
A heat map shows shades of green for “good,” which in this case is good performance relative to the total market. By contrast, shades of red are bad, indicating underperformance. Yellow is neutral.
The following table shows the forecast I made in July (check me out) and the actual results. The “high” market segments were forecast to outperform the total market’s 6% return in the third quarter on average, investing equally in all three segments. The “low” segments were forecast to perform less than the market.
|
U.S. Market in 3rd Quarter of 2013 Earned 6% |
|||
|
High MomentumEarned 8.6 |
Low MomentumEarned 8.1 |
||
|
Large Value Consumer Discretionary |
10.3 |
Small-cap Core Telephones & Utilities |
12.5 |
|
Small-cap Growth Utilities & Phones |
13.3 |
Small-cap Growth Materials |
7.8 |
|
Small-cap Growth Financials |
2.1 |
Large-cap Core Technology |
4 |
As you can see, momentum worked in the third quarter, with my picks to outperform actually outdistancing the market with an 8.6% return, although my forecast underperformers still outperformed the market, earning 8.1% on average. These returns are not adjusted for risk.
Looking forward to the fourth quarter, the table below is the heat map for the year ending September 30, 2013. We see that the best performing market segment was comprised of large-value companies in the consumer discretionary sector, earning 54%. And the worst performing segment was small-cap growth in the materials sector, losing 20.4%. Many quantitative managers employ momentum in their models, buying the “green” and selling the “red.” Fundamental managers use heat maps as clues to segments of the market that are worth exploring, for both momentum and reversal potential.
U.S. Heat Map for the Year Ending September 30, 2013
|
STAP |
DISC |
HLTH |
MATL |
TECH |
ENER |
INDU |
UTEL |
FINC |
TOTL |
|
|
LGVL |
9.3 |
54 |
20.7 |
-4.4 |
19.8 |
5.7 |
27.1 |
1.4 |
27.5 |
17.4 |
|
LGCO |
12.1 |
19.4 |
21.2 |
5.9 |
-12.9 |
19.5 |
24.7 |
14.5 |
30.8 |
12.5 |
|
LGGR |
16.2 |
34.3 |
40 |
2.8 |
14.9 |
18.2 |
38.5 |
6.1 |
32.9 |
22.1 |
|
MDVL |
28.2 |
35 |
51.9 |
9.4 |
36.9 |
18.3 |
36.4 |
13.4 |
27.2 |
28 |
|
MDCO |
37.9 |
28.3 |
27.7 |
9.8 |
24.8 |
16.4 |
32.7 |
6.6 |
21.8 |
25.4 |
|
MDGR |
22.3 |
46.1 |
32 |
-10 |
25.4 |
16 |
33.7 |
16.9 |
22 |
25.1 |
|
SCVL |
37.8 |
40.5 |
26.9 |
18.6 |
41.4 |
18.9 |
47.4 |
14.5 |
24.7 |
30.4 |
|
SCCO |
39.6 |
34.6 |
27.2 |
-1.3 |
28.4 |
26.8 |
40.6 |
-14.2 |
22.4 |
27.7 |
|
SCGR |
42.3 |
49 |
36.9 |
-20.4 |
39.5 |
5.6 |
41.8 |
44.6 |
31.4 |
31.3 |
|
TOTL |
15.3 |
35.7 |
29.5 |
1 |
13.6 |
12.4 |
32 |
5.9 |
28.2 |
21 |
Source: PPCA Inc
I forecast the following winners and losers for the next quarter. I’ll continue to track the results on a cumulative and quarterly basis. Let the games continue.
|
Forecasts for U.S. Markets in Q4, 2013 |
|
|
High |
Low |
|
Large Value Consumer Discretionary |
Small-cap Growth Materials |
|
Mid-cap Value Healthcare |
Small-cap Core Utilities & Telephone |
|
Small-cap Value Industrials |
Large-cap Core Technology |
 Foreign stocks
Looking outside the U.S., foreign markets earned 11%, lagging the U.S. stock market’s 21% return and matching EAFE’s return. Japan has been the big story, earning 27% on a dollar basis. The return in Japanese yen was an even more impressive 40%. The Japanese stock market has soared this year as the yen was weakening against the dollar. Europe was not far behind Japan, earning 21%, matching the U.S. return. By contrast, all countries outside Europe and Japan earned less than 10%, and Latin America lost 4%.
On the style front, core surprised, as it did in the U.S., but core led rather than lagged, although not by much.
Like the U.S., I had forecast winning and losing segments for this quarter. As shown in the following table, my foreign forecast for winners was on the money, but like the U.S. I was wrong about the losers. The “high” momentum outperformed as predicted, but so did the “low” momentum, even outdistancing the “high.” I’ll put this quarter in the semi-win column for foreign momentum investing.
|
Foreign Markets in Q3, 2013 Earned 9.1% |
|||
|
High MomentumEarned 11.2% |
Low MomentumEarned 13.2% |
||
|
Canadian Health |
13.9 |
Canadian Materials |
5.7 |
|
Small-cap Value Health |
10.9 |
Small-cap Growth in Australia & NZ |
14 |
|
Japanese Financials |
8.7 |
Materials in Australia & NZ |
19.9 |
Now let’s turn to momentum effects leading into the fourth quarter. The following table is a heat map for the year ending September, 2013. As you can see, healthcare stocks in Canada have thrived with a 51.7% return, while materials in Canada have suffered 34.7% losses.
|
STAP |
DISC |
HLTH |
MATL |
TECH |
ENER |
INDU |
UTEL |
FINC |
||
|
LGVL |
19.2 |
36.2 |
27 |
-1.5 |
34.3 |
7.7 |
28 |
18 |
27.3 |
|
|
LGCO |
20.5 |
32.3 |
29.3 |
-8.7 |
29.9 |
0.6 |
32.9 |
7.8 |
14.7 |
|
|
LGGR |
14.5 |
39.7 |
22.7 |
-11.4 |
18.5 |
1.7 |
19.7 |
26.6 |
19.9 |
|
|
MDVL |
26.1 |
38.6 |
34.9 |
7.8 |
22.5 |
5.7 |
30 |
13.9 |
21.1 |
|
|
MDCO |
18.9 |
29 |
22.5 |
6.3 |
17.3 |
2.3 |
27.1 |
9 |
21 |
|
|
MDGR |
12.6 |
30.7 |
23.3 |
-8.9 |
37 |
0.6 |
18.1 |
7.7 |
23 |
|
|
SCVL |
21.9 |
27.8 |
41.5 |
11.9 |
29 |
9.3 |
30.4 |
19.5 |
27.9 |
|
|
SCCO |
15.6 |
20.4 |
24.9 |
5.6 |
21.7 |
9.9 |
22.1 |
14.7 |
19.9 |
|
|
SCGR |
11.1 |
18.9 |
32.3 |
-13 |
33.6 |
-7.5 |
23.2 |
8.7 |
21.7 |
|
|
UK |
20.1 |
46 |
21.1 |
-1.7 |
26.8 |
4.8 |
36.2 |
32.2 |
41.2 |
|
|
JAPN |
13.8 |
42.8 |
11.6 |
37.5 |
29.6 |
2.2 |
30.3 |
31.9 |
47.1 |
|
|
CANA |
25.9 |
37.2 |
51.7 |
-34.7 |
34.7 |
3.4 |
23.9 |
4.5 |
20.9 |
|
|
AUST |
13.7 |
40.1 |
23.9 |
-8.4 |
28 |
3.2 |
16.3 |
23.1 |
26.5 |
|
|
APXJ |
2.5 |
18.4 |
32.9 |
-2 |
14.4 |
-2.4 |
12.5 |
12.4 |
14.4 |
|
|
EURO |
27.2 |
46 |
34 |
23.8 |
43.6 |
13.5 |
40.7 |
24.9 |
30.5 |
|
|
EMRG |
11.8 |
10.5 |
8.1 |
-8.5 |
15.5 |
0.9 |
-4 |
2.1 |
6.7 |
|
|
LATN |
8.3 |
0.2 |
9.4 |
-15.2 |
25.2 |
-8.7 |
7.7 |
2.5 |
9.3 |
|
|
OTHR |
16.6 |
36.9 |
28.8 |
2.3 |
41.8 |
9.2 |
12.9 |
31 |
24.7 |
|
|
TOTL |
16.5 |
34.2 |
26.3 |
-0.7 |
25.6 |
4.4 |
25.2 |
16.9 |
23.3 |
|
|
UK |
JAPN |
CANA |
AUST |
APXJ |
EURO |
EMRG |
LATN |
OTHR |
TOTL |
|
|
LGVL |
21.9 |
28.7 |
16.2 |
23.6 |
12.3 |
33.1 |
1.5 |
8.6 |
20.5 |
20.6 |
|
LGCO |
21.4 |
26.3 |
-2.2 |
15 |
5.8 |
34.3 |
-4.5 |
-3.5 |
32.4 |
18.2 |
|
LGGR |
21.7 |
37.5 |
-2.6 |
1.8 |
6.3 |
24.9 |
4.1 |
-1.3 |
17.4 |
17.2 |
|
MDVL |
30 |
38.5 |
2.4 |
17.3 |
11.2 |
39.2 |
13.1 |
7 |
28.6 |
21.8 |
|
MDCO |
35.5 |
28.5 |
12.9 |
22.1 |
7.9 |
37 |
-4.6 |
11.7 |
24.4 |
20.1 |
|
MDGR |
36.5 |
38.4 |
-2.4 |
3.4 |
13.5 |
38.6 |
-1.6 |
-1.4 |
16.7 |
16.9 |
|
SCVL |
39.2 |
32.8 |
5.3 |
16.7 |
23.2 |
41.7 |
13.8 |
-0.4 |
31.7 |
25.5 |
|
SCCO |
46.5 |
23.7 |
-3 |
9.7 |
16.8 |
29.9 |
2.9 |
-5.4 |
34.1 |
18.6 |
|
SCGR |
25.2 |
43.6 |
-10.1 |
-23.4 |
19.1 |
23.8 |
-1.9 |
2.7 |
22.6 |
16.2 |
|
TOTL |
24.3 |
33.1 |
7.3 |
16.2 |
11.3 |
31.9 |
3.4 |
2.3 |
23.4 |
17.7 |
Source: PPCA Inc
Accordingly, my forecasts for foreign market returns in the upcoming quarter are as follows:
|
Forecasts for Foreign Markets in Q4, 2013 |
|
|
High |
Low |
|
Canadian Health |
Canadian Materials |
|
Japanese Financials |
Small-cap Growth in Australia & NZ |
|
Small –cap core UK |
Materials in Latin America |
How to use this information
So now you have outlooks for the next three months based on momentum effects, but momentum doesn’t always work. Specifically, reversals can and do happen, so you can choose to bet with or against me, but importantly I’ve given you some places to look for opportunities.
Ronald Surz is President of PPCA Inc. and its Target Date Solutions subsidiary, both in San Clemente, CA. He is also Vice President of eVestment in Marietta, GA. Ron can be reached at (949)488-8339 or [email protected].
© PPCA