Be fearful when others are greedy and greedy when others are fearful. Warren Buffett
Introduction
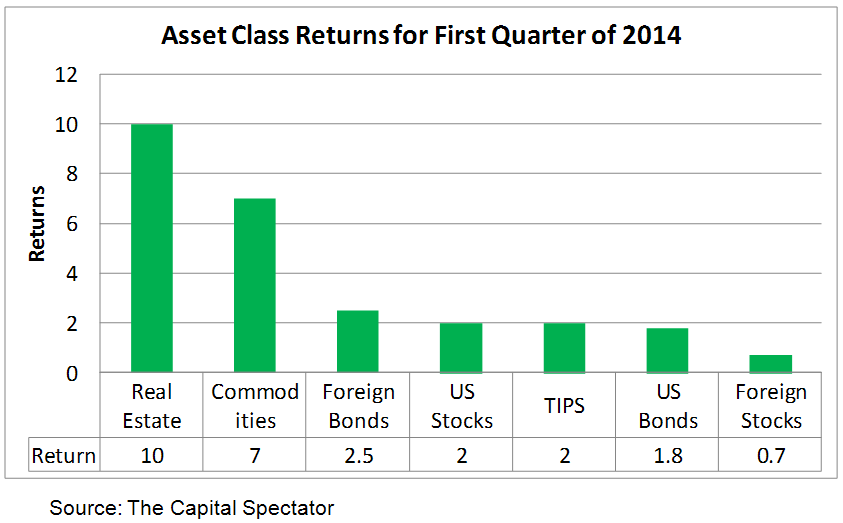
Unlike 2013, diversification worked in the first quarter of 2014. As revealed in our 2013 market commentary, U.S. stocks dominated with a 33% return while diversifying assets like commodities lost 10%. As shown in the graph on the right, diversification into real estate and commodities was handsomely rewarded in the first quarter.
Drilling deeper, there were also some reversals within U.S. and foreign stock markets, as described in the following. But momentum was not entirely dead. Some segments and styles continued the trends they manifested in 2013. There’s plenty in the first quarter for the momentum investor as well as the regression-to-the-mean investor.
U.S. Stocks
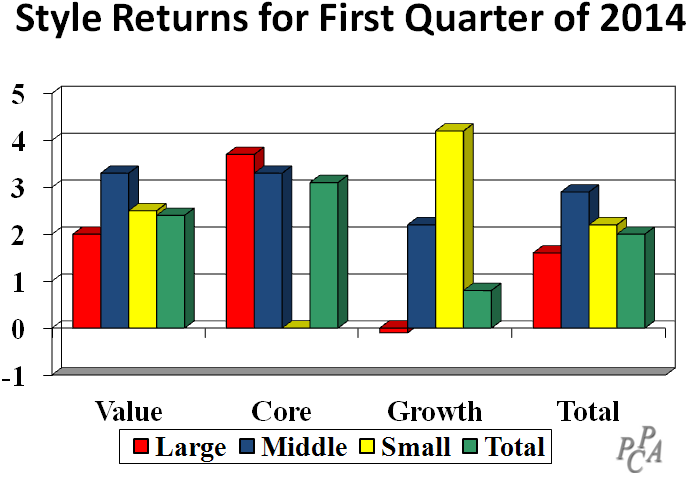
Like 2013, smaller stocks, especially small growth companies, led the way in the quarter, with mid-caps earning 3%. By contrast, large growth and small core companies earned nothing.
On the reversal front, large and mid-cap core were better performing styles in the quarter, whereas they lagged in 2013. This was one of those unusual periods where the “stuff in the middle” (core) did not perform in line with the “stuff on the ends.” I use Surz Style Pure® classifications throughout this commentary.
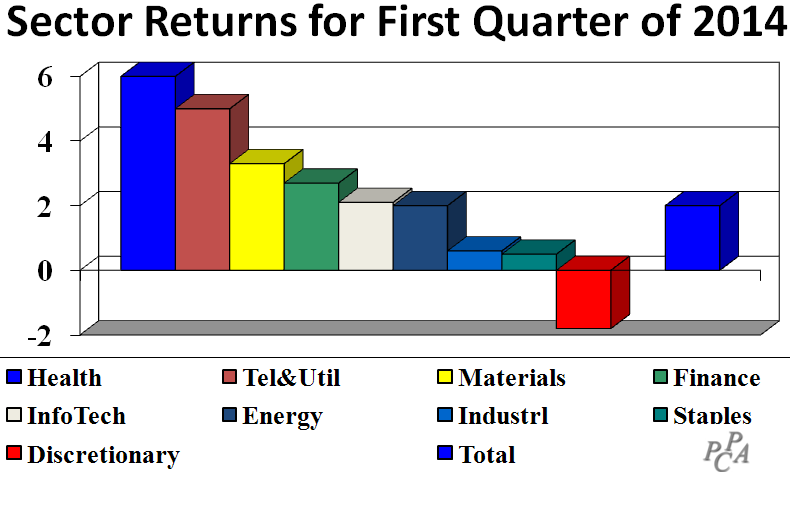
On the sector front, health care and telephone-and-utility stocks fared best, earning 6% and 5% respectively. By contrast, consumer discretionary stocks lost 2% in the quarter, reversing 2013’s dominance, having earned 45%.
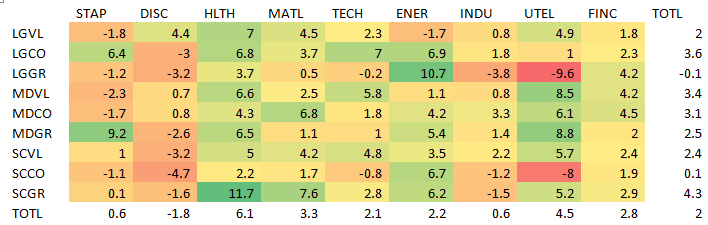
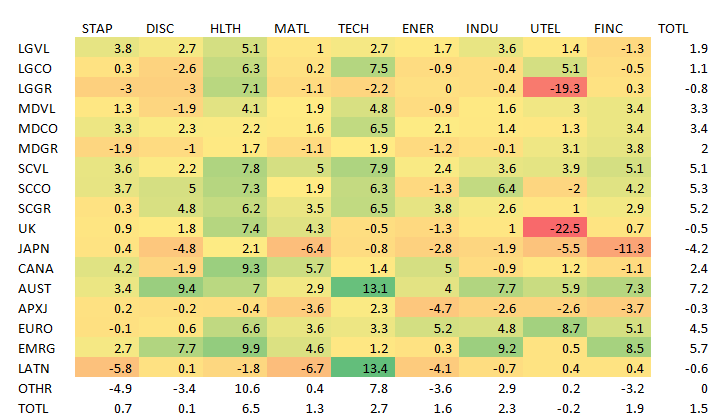
But the interesting details lie in the cross-sections of styles with sectors, as shown in the following heat map. A heat map shows shades of green for “good,” which in this case is good performance relative to the total market. By contrast, shades of red are bad, indicating underperformance. Yellow is neutral. In the table below, we see that the best performing market segment was comprised of small-cap growth companies in the healthcare sector, earning 11.7%. And the worst performing segment was large cap growh in the utilities sector, losing %. Many quantitative managers employ momentum in their models, buying the “green” and selling the “red.” Non-quants, also known as fundamental managers, use heat maps as clues to segments of the market that are worth exploring, for both momentum and reversal potential.
Foreign Stocks
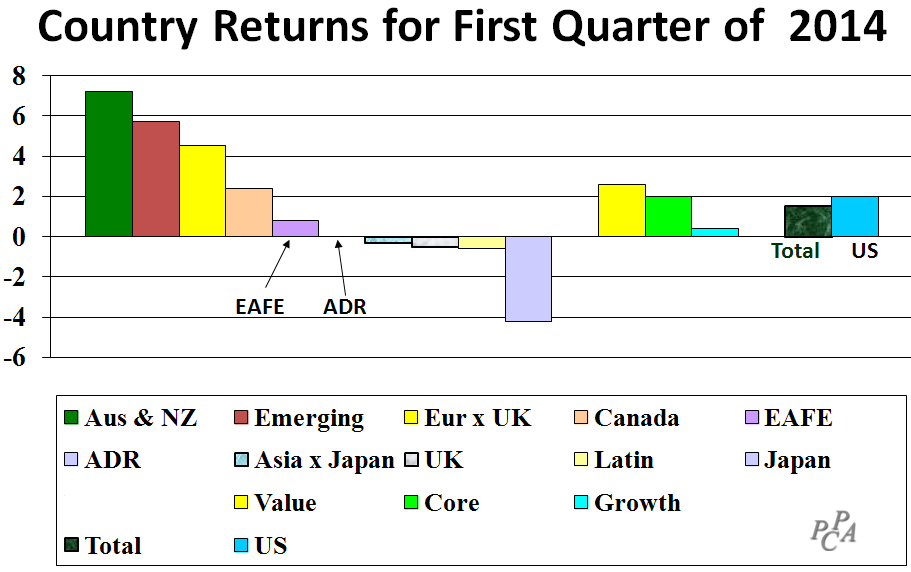
Looking outside the US, foreign markets earned 1.5%, lagging the U.S. stock market’s 2% return. EAFE lagged the total market with a 0.8% return because it is underweight the better performing regions of Australia-and-New-Zealand and Emerging Markets. In another reversal, this quarter’s leaders were among last year’s laggards. Japan was the big story, losing 4%, reversing 2013’s outperformance of 40%. The Japanese stock market soared last year as the yen was purposely weakened against the dollar.
On the style front, value led in the quarter with a 2.5% return, while growth stocks were flat.
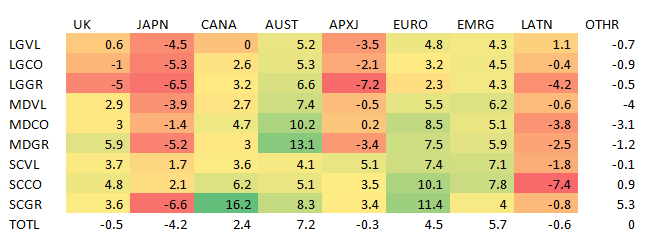
Like the U.S., further insights into market behavior are provided by heat maps, as shown in the following. As you can see, Latin America was red in almost all styles but actually had the best performing technology stocks, with a 13.4% return. The worst performing market segment was utilities-and-telephones in the UK.
How to Use This Information
We all have outlooks on the economy and the stock market, and adjust our thinking as results roll in. I personally remain surprised and grateful that stocks have performed so well in the past 5 years. As 2014 has unfolded so far, bargain hunting has won, and asset flow has lost. You can use the information above to test your personal outlooks, to see which are unfolding as you think they should and which are not, with the intention to clear the haze from those crystal balls.
© PPCA