“So the Wizard unfastened his head and emptied out the straw. Then he entered the back room and took up a measure of bran, which he mixed with a great many pins and needles. Having shaken them together thoroughly, he filled the top of the Scarecrow's head with the mixture and stuffed the rest of the space with straw, to hold it in place.” – L. Frank Baum, The Wonderful Wizard of Oz
Throughout L. Frank Baum’s tale, the Scarecrow believes himself a fool, while consistently displaying wisdom. He refuses to recognize his own talents until the Wizard fills his head full of bran, pins, and needles. Similar to the Scarecrow, we fear that investors are shunning their own analysis, reaching for products advertised to increase investment prowess. Unfortunately, some of these products may be bran/needle equivalents. It is no secret that some investors are looking to decrease exposure to the equity markets in their portfolios due to the parabolic nature of these markets since late February 2009.
Indeed, we have warned of the migration of investors to speculators and examined the new word surrounding boutique investment strategies: “Alternatives”. In our article on alternative investments, we also examined exchange-traded funds (ETFs). ETFs are enticing vehicles for investors wishing to expose themselves to asset classes offering potentially uncorrelated returns to the equity markets. However, in examination of these alternative ETFs, we urged diligence and caution. Another ETF style that investors may wish to employ is one which provides inverse or short equity market exposure.
These ETFs, which are advertised to provide an investor with short exposure to the broad equity markets (e.g. shorting the NASDAQ or the S&P500), may appear to provide a simple solution in a portfolio allocation strategy to reduce equity market risk. In our opinion, this solution is not so simple. These ETFs are comprised almost completely of swap agreements, derivative instruments, of varying negative notional amounts with many counterparties, i.e. large financial institutions. Additionally, if a levered short equity market ETF is employed, the complexity increases as does our aversion.
The objective of most of these funds is to produce the inverse and/or levered inverse return of the select equity market’s performance over a single trading day. These funds do not guarantee the generation of true negative correlation over any period of time longer than one day. The levered ETFs carry additional risk: The compounding of leveraged returns on a daily basis and associated fees make these ETFs untenable as long-term investment strategies that help mitigate equity market risk. Investors may read the above and choose to ignore issues related to true negative correlation. We believe investors may choose to disregard performance disparities, holding these instruments as insurance in the case of a severe market downturn, and hoping for a partial victory.
The non-levered inverse ETF does not seem equipped to handle a large market correction—we see risks in the view of these instruments as insurance and see them at most as a partial hedge on the market. A partial correlation is a partial hedge. Additionally, the counterparty risk associated with investment in these ETFs is enormous if one looks at these instruments as a guard against a large market correction. If one or two of these counterparties were to collapse, it is possible that one will not experience returns correlated to the inverse of the select equity market. Having stated this, we do acknowledge that the high volume un-levered inverse funds performed reasonably well during the Global Financial Crisis—ETFs benefit from the market forces of supply and demand for price discovery.
Market forces exert themselves on two levels: Authorized Participants—mostly broker-dealers, the market makers for ETFs—can create or redeem large baskets of shares of the funds in their market-making function. Secondary market investors buy and sell shares at market price, not necessarily at a fund’s net asset value (NAV). However, we continue to worry about how these instruments compliment a long-term investment horizon. An example of the discrepancies in net asset values of the funds versus their objective on a daily basis is shown below. We used SH (ProShares Short S&P500) and SDS (ProShares Ultrashort S&P500) as examples.
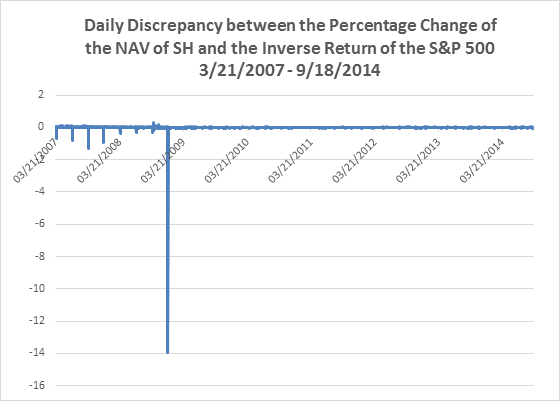
(Source: FRED, ProShares)
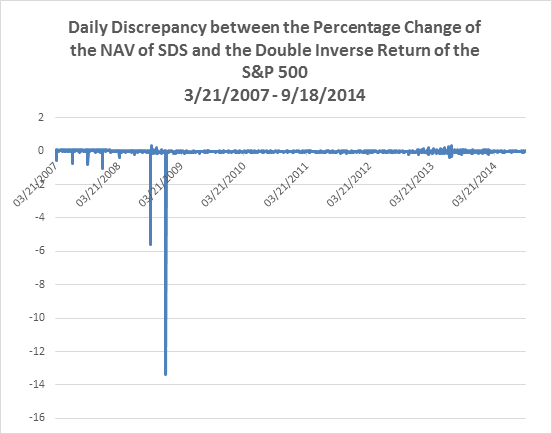
(Source: FRED, ProShares)
On December 23, 2008, the S&P500 fell 0.97%. The NAV of SH fell 12.97%, while the NAV of SDS fell 11.43%. While SH should have returned 0.97% on that date, its actual price return was -12.81%; SDS should have returned 1.94%, its return was -11.45%. In this case, the market allowed these funds to drift with their NAV. With these large corrections present in the charts, the delta or change between the NAVs and their objectives looks small throughout most of the time period displayed. The discrepancy between the daily objective and the NAV of the unlevered inverse product, SH, usually ranges between 0% to about 0.05%. This may seem small on a daily basis, but the compounding of these discrepancies can create larger disparities of return over time.
We must remind readers that the charts show a comparison of the NAV struck at the end of the day, and not the price. It appears that a cash dividend may have played a role in the drastic change in NAV versus the objective on December 23, 2008. We note larger than normal discrepancies around the Lehman Brother’s default in September 2008 as well—the second largest disparity in SDS happened on September 24, 2008, another dividend distribution date. While these funds provide short exposure to the market, we remind investors of the above when one argues for these instruments as insurance.
One thing that we find attractive about these instruments is that they do not have the risks associated with traditional methods of shorting securities. As many investors know, in a long-only instrument one can only lose 100% of their investment. When one shorts a stock, the upside reward is at the most 100% of the invested assets—minus associated carrying costs—while the downside potential is infinite. In this manner, on a day-to-day basis, these instruments are likely safer for the average investor who wishes to bet on the downside direction of the market.
The same analysis above applies to inverse equity sector ETFs (e.g. shorting the financial sector) and inverse international equity index ETFs. In the case of sector ETFs, the swap arrangement is generally against an index based on the corresponding sector. While inverse international equity market ETFs are swap agreements written against the associated international index.
These instruments all promote market timing, the leveraged ones even more so. We believe that one can be right about directional trends. We do not believe the investor can be right about direction and timing at the same moment, which makes us hesitant to recommend exposure to these instruments. Investors should ask themselves if swap agreements with major financial institutions are appropriate investment vehicles for any market downturn they may anticipate. If one wishes to trade leveraged inverse ETFs, we think time may be better spent in Vegas.
Inverse ETFs have allowed the retail investor to participate in large-scale swap agreements against the direction of the select index with a large amount of counterparties. One should pay close attention to fees. The low costs associated with non-inverse non-leveraged equity index ETFs are not in concert with their inverse cousins. For example SH carries an expense ratio of 0.90%, while the long S&P500 ETF from State Street, SPY, has a net expense ratio of 0.09%. Inverse ETFs do provide negative correlation to the market. However, between fees, tracking error, and compounding in the levered products, we urge investors to read each prospectus thoroughly, while considering the suitability of the instruments for long-term portfolio allocation. When the Scarecrow returned to his companions with his new brain, the Cowardly Lion announced that the needles protruding from the straw in his head demonstrated that he was sharp; we hope investors do not get cut by these figurative needles.
tl;dr (The millennial in our midst introduced us to the internet meme, ‘too long; didn’t read’—used to sum up points from a long article):
- Inverse equity ETFs appear to be simple vehicles that allow an investor to diversify a portfolio away from the market. When one looks at the structure of these ETFs, one realizes that these vehicles are far from simple.
- One must understand the structure of these instruments. A simple price evaluation may mask severe deficiencies between the allocation objective and the instrument employed.
- These instruments are designed to return a daily inverse return. Inverse correlation over time is not guaranteed. However, besides a few large discrepancies, the instruments generally provide negative correlation.
- Levered vehicles should not be considered as long-term investments. At most these instruments should be deployed tactically over very short periods of time if at all.
- An investment in these products is a participatory investment in swap agreements, which are derivative instruments. These products also carry much larger fees than the long equity market funds.
- These instruments may not provide insurance through a large market correction.
- These instruments allow short exposure without the need for a margin account or infinite downside risk.
- After considering the above, we note that these inverse ETFs do generally provide negative equity market correlation over time. They may be suitable for investment. However, we urge caution and due diligence.
- Not All ETFs Are Created Equal.
Good Fortune!
Bob Andres is editor of The Andres Review and founder of Andres Capital. Bob’s career includes stops as: chief investment officer at Merion Wealth Partners, chief investment strategist at Envestnet (PMC division), co-founder at Martindale Andres & Co., a firm he grew to $2.4 billion before its sale, President at Merrill Lynch Mortgage Capital, etc. He has been quoted and featured in various media: CNBC, Fox Business, Barron’s, Institutional Investor, etc.
© Andres Capital Management


