A Look behind the GDP Numbers: The Search for Organic Growth
As with many investors, we looked anxiously to the U.S. GDP release on Thursday morning after viewing the FOMC statement on Wednesday. When the headline number for GDP came out at the top range of the forecast at 3.5%, we began to ask ourselves whether the analysts projecting 3% inflation by year end may actually be on to something. However, upon reading the report, we became less enthralled with the prospect of above trend growth, which would signal rising inflation.
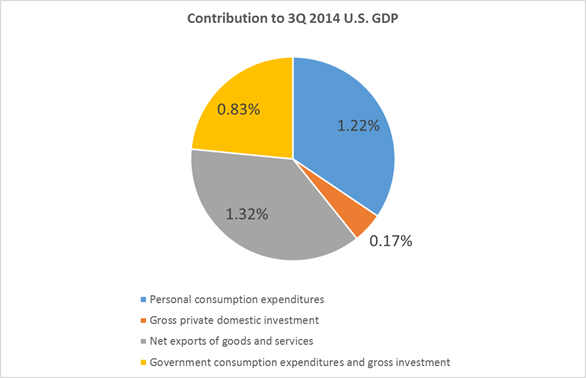
While various media outlets were praising the prospect of U.S. growth, we were concerned about the contribution tables. As is shown below, consumption remains relatively healthy and continues to be a large contributor to GDP. While we noted with caution that inventories levels added significantly to 2Q GDP, Inventory contribution was negative for the third quarter. While we are encouraged by the health of the consumer and the absence of inventories as contributors to GDP, we worry about the decrease in private domestic consumption, which includes inventories as well as private fixed investment, the level of exports to imports, and the significant contribution of government spending to overall GDP.
(Source: Bureau of Economic Analysis, http://www.bea.gov/iTable/iTable.cfm?ReqID=9&step=1#reqid=9&step=3&isuri=1&903=2)
Private Domestic Consumption. While fixed investment contributed positively to GDP this quarter, it was lower in almost every category versus 2Q. Fixed investment was almost neutralized by a negative contribution from inventories. Recall that inventories contributed 1.42% of the total 4.6% number in 2Q. This is less extreme than the initial readings of 1.66% of the total 4.0%, but it still represents a contribution of 30.87% of GDP in 2Q. Private domestic consumption was essentially a wash this quarter providing 17 basis points of contribution to the 3.5% headline number.
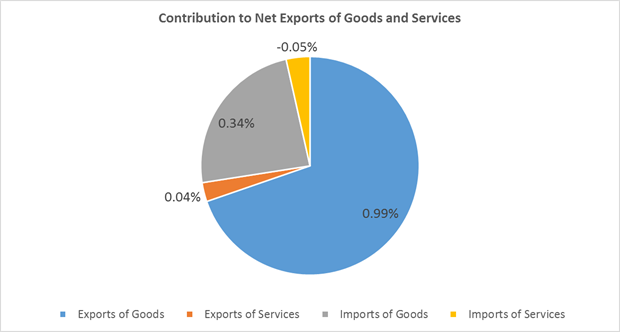
Net Exports of Goods and Services. The contributions from net exports of goods and services worries us as a signal of future growth. Net exports were the largest contributor to GDP this quarter at 132 basis points or 37.71% of the headline numbers. While this sub-headline may seem positive at first glance, we need to look at what these numbers mean for future growth. Therefore, we need to look at the contributors to Net Exports of Goods and Services:
(Source: Bureau of Economic Analysis, http://www.bea.gov/iTable/iTable.cfm?ReqID=9&step=1#reqid=9&step=3&isuri=1&903=2)
As shown above, exports of goods made up the lion’s share of net exports of goods and services. This is troubling if one believes in a strengthening U.S. dollar as one consequence of the end of Quantitative Easing. We know that export-oriented economies benefit from a weaker currency, while import-oriented economies benefit from a stronger currency. This is related to the concept of a carry trade or utilizing the differentials in currency valuation to increase profit. A strengthening U.S. dollar argues for an increase in imports and a decrease in exports. While this is not only detrimental to the contribution of the exports of goods to GDP, it is compounded by the fact that imports detract from growth, i.e. the positive contribution of the imports of goods means that imports of goods fell 2.4% during the quarter.
We should also note that many investors are welcoming the decline in the price of oil, which is increasing confidence in the economy. Declining oil prices have both a good and a bad side. The United States has benefitted from a high price of oil in the midst of the natural gas revolution brought about by fracking. Our cheap natural gas against expensive crude has created a significant competitive advantage and aided many flailing state economies. If the price of crude falls to a level where liquid natural gas is no longer competitive, then we may all be fracked.
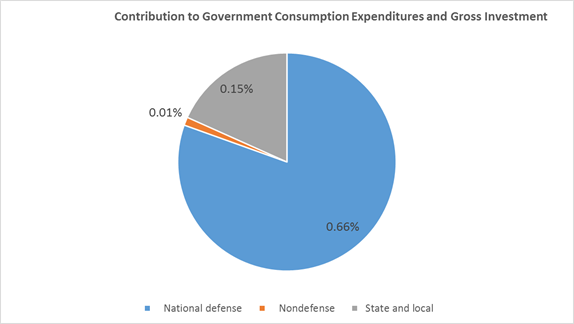
Government Consumption Expenditures and Gross Investment. Government spending increased 4.6% this quarter contributing 83 basis points or 23.71% of 3Q GDP. Federal spending increased by 10%, primarily due to a 16% increase in defense spending. Is this organic or sustainable? Let’s look at the contributors to government spending:
(Source: Bureau of Economic Analysis, http://www.bea.gov/iTable/iTable.cfm?ReqID=9&step=1#reqid=9&step=3&isuri=1&903=2)
It should be noted that national defense is truly government spending. While investments in national defense showed a negative contribution, national defense consumption expenditures contributed 69 basis points to overall GDP. Again, government national defense spending was 19.71% of GDP. We do not see this as sustainable or organic.
We would be remiss if we did not mention a few other items of note. While we noted that Personal Consumption Expenditures remained a large contributor to GDP, personal durable goods orders contributed roughly half of what was contributed last quarter. Durable goods orders are considered a good indicator of consumer outlook as durable goods orders are usually large purchases.
There are also items in the GDP report that fall into an addendum section, which do not count towards GDP contribution. While the items under, “Disposition of Personal Income” show a slight increase in personal savings rates, we quote the following with emphasis:
Disposition of personal income
Current-dollar personal income increased $152.9 billion in the third quarter, compared with an increase of $223.0 billion in the second. The deceleration in personal income primarily reflected a deceleration in wages and salaries, a downturn in farm proprietors’ income, a deceleration in personal dividend income, and a downturn in personal interest income.
Personal current taxes increased $26.4 billion in the third quarter, compared with an increase of $11.2 billion in the second.
(Source: http://www.bea.gov/newsreleases/national/gdp/gdpnewsrelease.htm)
We return to the question with which we started this article: How much of the GDP headline is sustainable and organic and what does this mean for U.S. inflation? We noted that bond prices were relatively unchanged. We wondered whether the bond market was remaining rationale, while the equity market quickly dove and then recovered well during the day. We have repeated over the past few months that above trend growth is the one of the only economic events that we see as getting inflation to 3% or higher at the end of the year, a target that has recently fallen away from consensus.
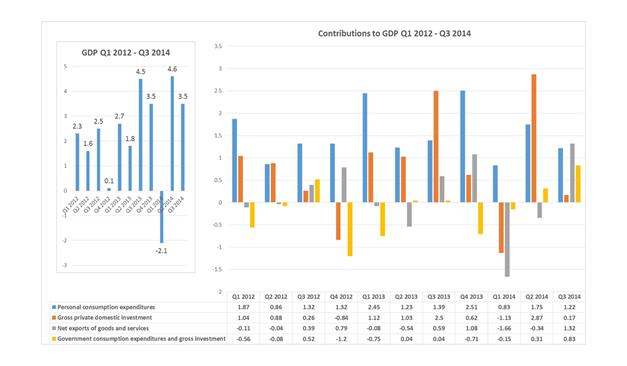
With government spending and exports in question as sustainable/organic we suggest that one may wish to look at this number without these two large contributions. We see this level of national defense spending as an outlier. If the U.S. dollar strengthens, exports should fall as imports rise. Declining exports and increasing imports would have a negative compounding effect on GDP. If one subtracts the 99 basis points of exports of goods as well as the 66 basis points from national defense spending from the headline number of 3.5%, the result is 1.85%. While these subtractions are extreme, we note the ten year yield is hovering around 2.3% and the TIPS market is signaling inflation of about 1.9%. We ask, again, if investors think the 3.5% GDP represents sustainable growth. Below is a chart of quarterly GDP since 1Q 2012 as well as the quarterly contributors:
(Source: Bureau of Economic Analysis, http://www.bea.gov/iTable/iTable.cfm?ReqID=9&step=1#reqid=9&step=3&isuri=1&903=2)
The colors in the graph above conform to the colors in the original pie chart of GDP contributors for better reference. One can note that Personal Consumption Expenditures (the consumer, in blue) is a steady contributor to GDP. Net Exports (grey) and Government Consumption Expenditures (yellow) seem to vary quarter to quarter as to their positive or negative contribution. The most significant contributor from last quarter, Private Domestic Investment (orange), was the smallest contributor this quarter. While, the headline number against last quarter’s headline number seems to suggest that we are seeing above trend growth, we continue to have doubts.
What should the investor do with this information? Be skeptical, look Behind the Numbers, do your homework, and in our view stop believing that inflation is going to come roaring any time soon. Remember, Not All Bonds Are Created Equal.
Good Fortune!
Bob Andres is editor of The Andres Review and founder of Andres Capital. Bob’s career includes stops as: chief investment officer at Merion Wealth Partners, chief investment strategist at Envestnet (PMC division), co-founder at Martindale Andres & Co., a firm he grew to $2.4 billion before its sale, President at Merrill Lynch Mortgage Capital, etc. He has been quoted and featured in various media: CNBC, Fox Business, Barron’s, Institutional Investor, etc.


