In a volatile quarter full of downs and ups, equity returns wound up close to where we started in 2016. Underlying these unremarkable results was the real story—the leadership shift to small-cap value.
Another Wild Ride – Volatile Market & Muted Returns
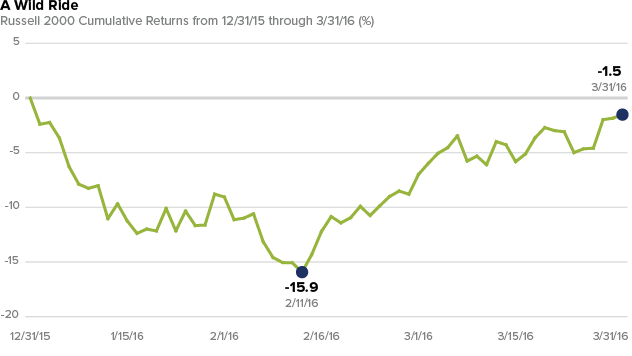
Rarely before has a quarter seen such high volatility for small-cap stocks (Russell 2000 daily volatility was higher than 87% of all quarters since inception) with such a muted return (-1.5%).
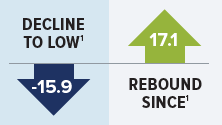
The quarter split into near mirror images, with a decline of 15.9% through the YTD low on 2/11 and a subsequent rebound of 17.1% through the end of March.
Our Outlook: This sort of tumult is typical of a market undergoing a change in leadership.
Is the Worst Behind Us?
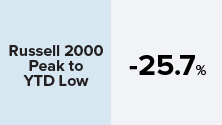
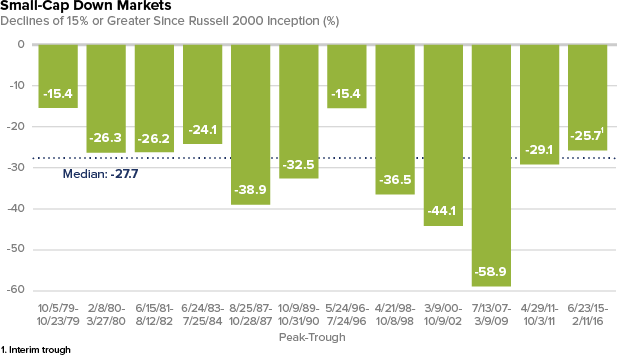
From the small-cap market peak on 6/23/15 through 2/11/16, the Russell 2000 Index lost 25.7%.
This loss is close to the median return of -27.7% for all declines of 15% or greater (from prior index peaks) since the inception of the Russell 2000 on 12/31/78. However, all five periods with declines of 30% or more were accompanied either by a recession (1990, 2002), a dramatic financial market event (1987, 1998), or both (2008-2009).
Our Outlook: While it's difficult to rule out a "black swan" financial event, in the absence of that or a recession, which we think is unlikely, we believe the worst of the small-cap decline is behind us.
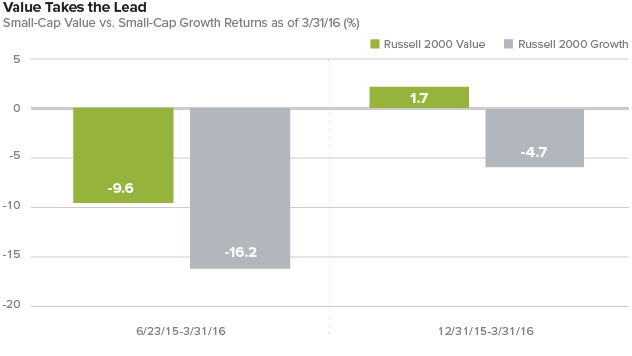
Small-Cap Leadership Shift – Value Over Growth
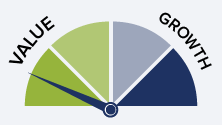
In the volatile first quarter, the Russell 2000 Value Index took the lead, advancing 1.7%, considerably better than the Russell 2000 Growth Index, which fell 4.7%.
The period of outperformance for small-cap value actually extends back to last June's small-cap peak, as the Russell 2000 Value outperformed the Russell 2000 Growth Index, -9.6% vs.-16.2% from 6/23/15 through 3/31/16.
This style reversal is important as the prior extended period of growth's outperformance helped to create a meaningful headwind for most active managers.
Our Outlook: We expect that small-cap value's leadership period has a long way to go.
Odd Couple: Utilities Lead, Health Care Lags
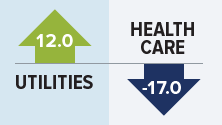
There was a surprising mix in quarterly small-cap sector results. The best performers within the Russell 2000 were Utilities, Telecommunication Services, and Materials, though solid results also came from more cyclical, economically sensitive areas such as Consumer Discretionary and Industrials.
It's unusual for that collection of sectors to do well in the same quarter. On the flip side, another uncommon pairing— Health Care and Energy— showed the greatest losses.
Our Outlook: We think that Materials and Industrials can make progress versus low expectations, while Health Care and certain once fast-growing areas of IT may continue to struggle.
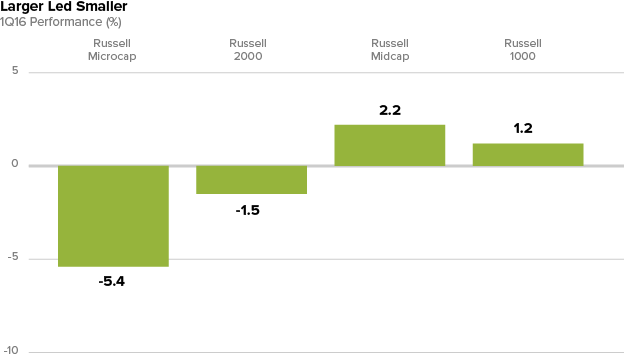
Mid-Cap Noses Ahead
In another surprise, mid-cap stocks led for the quarter, with the Russell Midcap Index up 2.2% versus an advance of 1.2% for the Russell 1000 and respective declines of 1.5% and 5.4% for the Russell 2000 and Russell Microcap Indexes. The steepest losses generally came from the smallest companies.
Due to recent underperformance, the Russell 2000 now sells at only a 3% P/E premium to the Russell 1000 Index, compared to a 24% premium at year-end 2013.
Our Outlook: We anticipate that small-cap stocks will at least keep pace and may likely lead large-caps in the next upswing.
Earnings Mattered2

The quarter also saw better performance for small-cap companies with earnings. Profitable companies in the Russell 2000 advanced 1.6%, while non-earners dropped 17.6%.
This disparity was significant as investors reversed course and (finally) seemed to recognize both the value of earnings and how low valuations had fallen outside the few industries that were successful in 2015.
Our Outlook: As capital markets are not nearly as open and generous as they were previously, we believe the market will continue to reward profitability while showing less patience with non-earning companies.
1 Russell 2000 1Q16 (%)
2 Royce defines earnings as a company's last 12 months of operating income (earnings before interest and taxes) as of its latest financial statement filing.
Important Disclosure Information
This material is not authorized for distribution unless preceded or accompanied by a current prospectus. Please read the prospectus carefully before investing or sending money. Investments in securities of micro-cap, small-cap, and/or mid-cap companies may involve considerably more risk than investments in securities of larger-cap companies. (Please see "Primary Risks for Fund Investors" in the prospectus.) Investments in foreign companies may be subject to different risks than investments in securities of U.S. companies, including adverse political, social, economic, or other developments that are unique to a particular country or region. (Please see "Investing in International Securities" in the prospectus.)
The thoughts concerning recent market movements and future prospects for small-company stocks are solely those of Royce & Associates, LP, and, of course, there can be no assurances with respect to future small-cap market performance. All indexes referenced are unmanaged and capitalization-weighted. Russell Investment Group is the source and owner of the trademarks, service marks, and copyrights related to the Russell Indexes. Russell© is a trademark of Russell Investment Group. The Russell 2000 Index is an index of domestic small-cap stocks that measures the performance of the 2,000 smallest publicly traded U.S. companies in the Russell 3000 Index. The Russell 1000 index is an index of domestic large-cap stocks. It measures the performance of the 1,000 largest publicly traded U.S. companies in the Russell 3000 index. The Russell 2000 Value and Growth indexes consist of the respective value and growth stocks within the Russell 2000 as determined by Russell Investments. The Russell Microcap Index includes 1,000 of the smallest securities in the small-cap Russell 2000 Index, along with the next smallest eligible securities as determined by Russell. The Russell Midcap Index measures the performance of the mid-cap segment of the U.S. equity universe. It includes approximately 800 of the smallest securities in the Russell 1000 Index. The performance of an index does not represent exactly any particular investment, as you cannot invest directly in an index.