In Volatile Times, a Case for Quality Investing
If you believe the Street’s consensus, market volatility could be sticking around for the remainder of 2016. However, investors don’t have to view this projection as merely a pain point. Once you’ve accepted that volatility is a part of investing, you can uncover opportunities—you just need to know where to look for quality.
We’ve explored how five different investment styles have performed during periods of high and low volatility throughout history: growth, momentum, value, minimum volatility, and quality. In this post, we’ll highlight our findings and explain why the quality style is best suited for volatile market conditions.
Our benchmark
To measure an investment style’s performance against volatile market conditions, it helps to have a benchmark. We’ll look at the historical levels of the VIX, a stock market volatility index, since its 1990 inception. This will give us more than 25 years of history to work with. Market conditions are considered stressed and volatility is deemed high when the VIX level exceeds 20 and vice versa when it falls below 20.
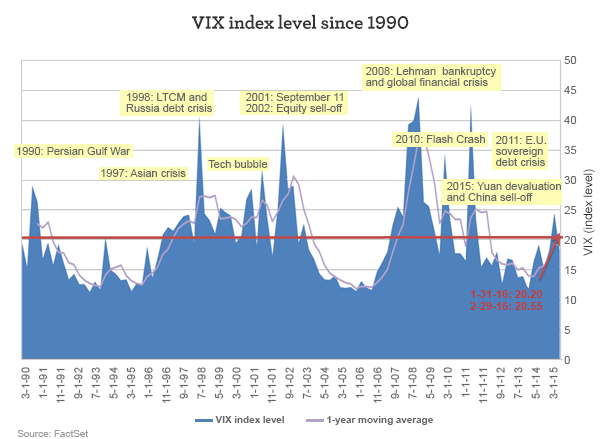
Over the past 25 years, markets have experienced a number of VIX spikes tied to various crises. Some lasted longer than others, as a spike’s duration is highly dependent on the drivers of volatility. For instance, the Flash Crash of 2010 resulted in a rather brief spike, whereas the VIX remained elevated for over two years throughout the global financial crisis that began in 2008.
Looking ahead at the rest of 2016, the consensus is that volatility will exceed prior years’ levels. Indeed, the markets ended both January and February with the VIX above 20. Given the fluctuation in commodity prices and the uncertainty around China, these levels were not exactly a surprise, at least not after the fact (at which point it’s usually easy to tell a story about why something happened).
Let’s take a look at how different investment styles have performed under high- and low-volatility periods.
Growth
The following chart shows the growth style’s excess returns over the broader universe of domestic mid- and large-cap stocks. As with each chart throughout this piece, the red area represents periods in which the VIX was above 20, signaling high volatility or stressed market environments. The green area represents periods in which the VIX was below 20—in other words, low volatility or normal regimes.
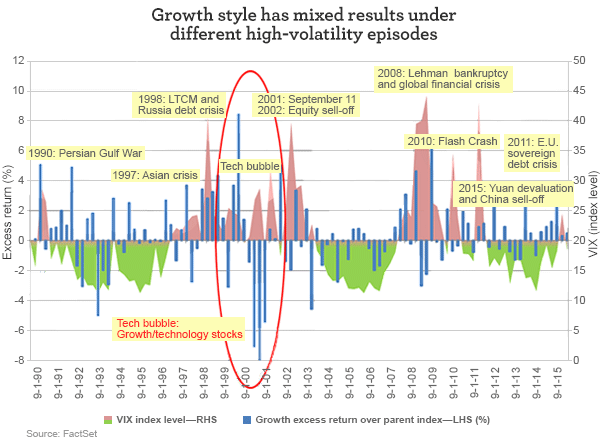
Over the past 25 years, growth has seen mixed results under different stressed market climates. However, it did offer good excess returns under a few high-volatility episodes:
- The Persian Gulf War in the early 1990s
- The Russian debt crisis in the late 1990s
- The sovereign debt crisis in Europe in 2011
- And most recently, the China-triggered sell-off in August and December 2015
It appears that growth held up better when the market crises were originated by drivers that were outside of the U.S., such as in Russia, Europe, or China. However, the style did not hold up very well during some of the more domestically driven events, such as the 2008–2009 financial crisis. And growth was crushed during the technology bubble.
Momentum
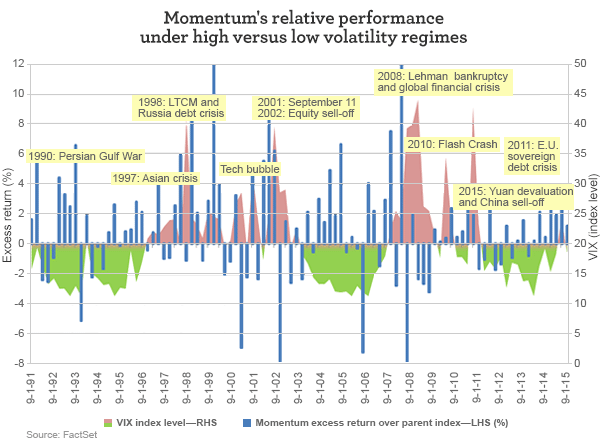
Growth has historically exhibited positive correlation with the momentum investment style, which could be explained by high-growth companies’ tendency to experience high stock-price momentum. This is a result of their favorable earnings and revenue growth characteristics or, in other words, healthy growth profiles. Therefore, it’s no surprise that momentum demonstrated similar behaviors as growth under several high-volatility historical periods.
Momentum also exhibited mixed results under different stressed environments; however, the magnitude of over- and underperformance tended to be of greater degree than the growth style, indicating more volatile excess returns relative to the market portfolio. As with growth, momentum held up better in crises that were initiated by overseas drivers but underperformed during the more domestically driven high-volatility environments. In particular, momentum experienced multiple drawdowns during the 2008–2009 financial crisis. It also underperformed the market substantially during the 2002 equity market sell-off.
Value
The value investment style has often underperformed during periods of high volatility and stressed market environments. As illustrated in the chart below, when the VIX entered the red zone, the blue columns, which represent value’s excess returns over its parent index, have mostly been negative—indicating underperformance relative to the market portfolio.
Some of value’s most notable drawdowns happened during events that were domestically driven, such as the late 1990s technology bubble and the financial crisis in the late 2000s—somewhat similar to what we saw with growth. Note that the magnitude of the value style’s underperformance was at times more pronounced than the growth style’s during both of these volatile flight-to-quality market events. These factors contribute to the empirically negative correlation between value and volatility.
On the other hand, as highlighted in the red circle, the value investment style offered strong relative performance during the September 11 terrorist attacks, a period in which the growth investment style underperformed dramatically. This is an example of how the two styles could serve to complement one another during a high-volatility regime that had little to do with companies’ fundamentals.
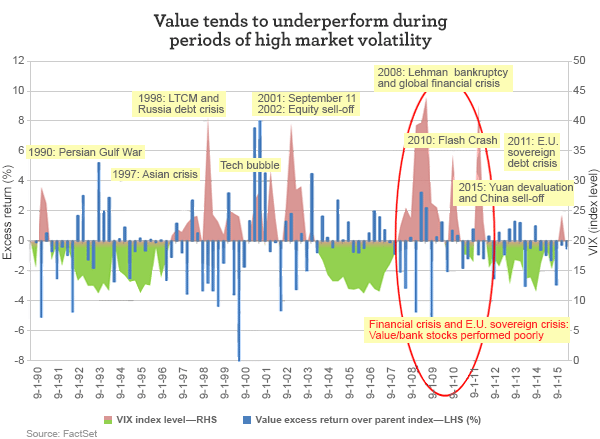
Also worth noting is the period prior to 2008, before the Federal Reserve’s extraordinary policies became effective. When the VIX entered the green zone (for example, in the first half of the 1990s and the middle of the early 2000s), value tended to outperform when the markets were relatively calm.
This is no longer the case since after the financial crisis, interest rates became severely distorted by central banks’ interventions. However, considering how wide the performance gap has grown between value and growth in recent years and assuming that rates will slowly normalize, perhaps the value style could be back in favor when paired with a low-volatility environment, whenever that may prevail.
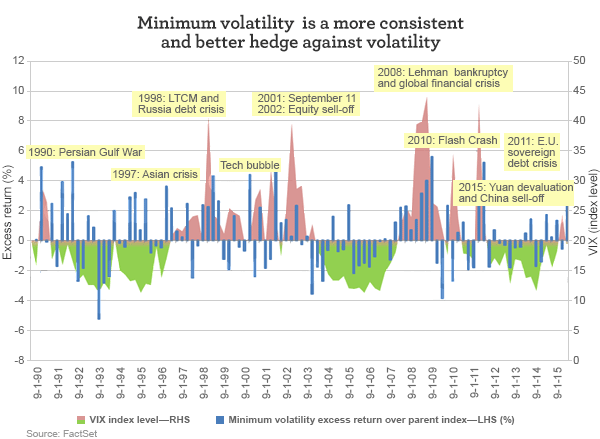
Minimum volatility
The MSCI USA Minimum Volatility Index is the minimum variance portfolio of its parent MSCI USA Index, optimized for the lowest absolute risk to minimize sector deviations, portfolio turnover, and transaction costs. Historically, the minimum volatility portfolio has shown lower beta (a measure of sensitivity to broad market moves) and volatility characteristics relative to the MSCI USA Index.
As its name implies, the minimum volatility investment style is generally a good hedge against volatility during stressed market environments. On the flip side, minimum volatility is, by design, expected to underperform the market during times when volatility is low. This was the style’s behavior for the most part under normal market conditions. As shown in the following chart, when the VIX was in the green zone, the minimum volatility investment style’s excess returns were mostly negative—indicating underperformance relative to the market portfolio.
While minimum volatility provided overall volatility mitigation over the past 25 years, it did not hold up so well relative to the market during a few high-volatility periods. This includes the Asian financial crisis in 1997, the Russian debt crisis in 1998, the equity market’s sell-off in 2002, and the second half of the global financial crisis in 2009.
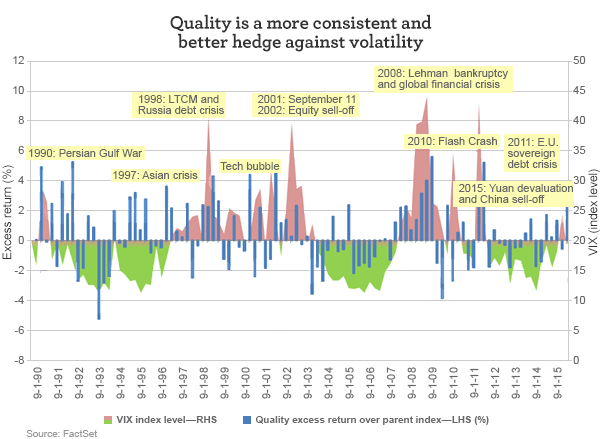
Quality
In contrast to minimum volatility, the quality style provided a more consistent safeguard against volatility throughout history. The three fundamental variables that MSCI used to construct the MSCI USA Quality Index are return-on-equity, leverage, and earnings stability.
Over the past 25 years, whenever the VIX reached the red zone, quality has been positive more consistently than any other style, indicating persistent outperformance over the market portfolio and therefore offering better defense against high volatility in stressed environments. Moreover, as shown in the next chart, quality’s outperformance was not only consistent; its magnitude was quite strong.
The next chart shows the cumulative returns for each investment style—growth, value, minimum volatility, and quality—over the past 20 years, which included periods of high, low, and normal volatility. Over the 20-year time period, the quality investment style was the top performer, followed by minimum volatility, then growth, and then value. To put this into perspective, the performance dispersion between the top and bottom style returns was as much as 83% over the 20-year period.
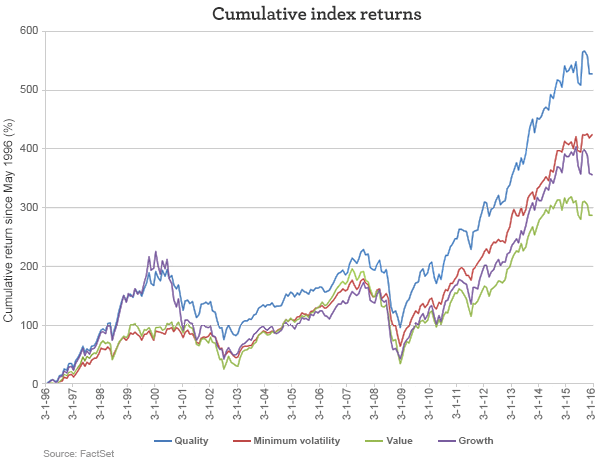
The quality investment style exhibits two important properties: downside mitigation during bad times and market-like behavior under most normalized conditions. A key reason why quality was able to produce such strong outperformance over the other four styles was its ability to avoid many of the large drawdowns that other styles experienced during market crises.
In addition, quality generally kept up with the market under normalized conditions, unlike the minimum volatility investment style, which tends to experience prolonged periods of persistent weakness when the markets are relatively calm. Over the long term, the power of compounding returns magnifies the positive effects of these two properties of the quality investment style, allowing it to have produced very strong outperformance over the other styles over time.
Given the fluctuations in commodity prices and uncertainty around China’s growth prospects, combined with questions around the pace and advisability of monetary policy normalization in the U.S., the general consensus from market participants seems to be that there is an expectation of higher volatility across the equity markets in 2016. Under this expectation, now is a good time for investors to think about investing in the quality style.
Please visit our blog, AdvantageVoice, for additional viewpoints from Wells Fargo Asset Management’s investment strategists, portfolio managers, and practice management experts. You can also follow us on Twitter at @WFAssetMgmt for real-time updates. Are you an advisor or institutional investor? Check out our website for investment professionals.
The views expressed are as of 4-6-16 and are those of Dr. Brian Jacobsen, CFA, CFP® and Jo Lee, CFA, and Wells Fargo Funds Management, LLC. The information and statistics in this report have been obtained from sources we believe to be reliable but are not guaranteed by us to be accurate or complete. Any and all earnings, projections, and estimates assume certain conditions and industry developments, which are subject to change. The opinions stated are those of the authors and are not intended to be used as investment advice. The views and any forward-looking statements are subject to change at any time in response to changing circumstances in the market and are not intended to predict or guarantee the future performance of any individual security, market sector or the markets generally, or any mutual fund. Wells Fargo Funds Management, LLC, disclaims any obligation to publicly update or revise any views expressed or forward-looking statements.
Wells Fargo Asset Management (WFAM) is a trade name used by the asset management businesses of Wells Fargo & Company. Wells Fargo Funds Management, LLC, a wholly owned subsidiary of Wells Fargo & Company, provides investment advisory and administrative services for Wells Fargo Funds. Other affiliates of Wells Fargo & Company provide subadvisory and other services for the funds. The funds are distributed by Wells Fargo Funds Distributor, LLC, Member FINRA, an affiliate of Wells Fargo & Company.
Not FDIC Insured • No Bank Guarantee • May Lose Value
© Wells Fargo Asset Management