Concerned About Inflation? Consider This Approach
Consumer prices have gone from falling 0.1% year over year in February 2015 to rising 1.0% in February 2016. Is inflation on the rise, and if so, should investors look to safeguard their portfolios against it?
Federal Reserve (Fed) Chair Janet Yellen wants to wait to see whether the increase in inflation is durable. When other countries are experiencing very low inflation, if not deflation (a decline in prices), Chair Yellen may be worried that those disinflationary pressures may pull U.S. inflation back down. Others look at the low unemployment rate (5.0%) and the recent pickup in inflation and assert that higher inflation is on its way.
I share Chair Yellen’s skepticism over inflation’s return. As for investors seeking to safeguard their portfolios against inflation, whether it’s returning or not, there are much better alternatives out there than vehicles such as Treasury Inflation-Protected Securities (TIPS). In my view, investors would be better served by investing in short-term high-yield debt to shield against an eventual rise in inflation.
In this post, we’ll explore how best to gauge whether inflation will return and what types of investments can potentially help inflation-minded investors reach their goals.
Taking stock of inflation measures
Since 2012, the Fed has made it explicit that it is targeting a 2.0% rate of inflation as measured by changes in the personal consumption expenditures (PCE) price index. This is a slightly different version than what’s measured by the Consumer Price Index (CPI). Most of the differences are in the goods and services weightings: The PCE’s basket of goods and services changes more frequently than the CPI’s. This makes PCE a more accurate reflection of people’s spending behavior. The common example is that when bananas go on sale, people might shift from buying apples to bananas and not be any worse off for it. The PCE captures that substitution effect while the CPI basket is fixed and updated only every two years.
Since 1960, the CPI has measured inflation as running about 0.5% hotter than the PCE measure. Since 2000, the CPI has run about 0.3% per year faster than the PCE. Since the economic recovery began in mid-2009, the CPI has outpaced PCE by an average of 0.1%. This difference is important when the Fed is targeting 2.0%.
Inflation’s return?
How can you predict where inflation is going? Some people might look at a chart about inflation and assume that a turn-up must indicate a building of momentum. Statistically, an increase in one quarter does tend to lead to an increase in the next quarter, though it’s not a one-for-one relationship. The effect dissipates.
There are many others that drive inflation. Some people look at the Phillips curve, which posits that a lower level of unemployment leads to wage inflation, which leads to cost-push price inflation. The problem with this view is that the Phillips curve doesn’t appear to be very stable. If there was a pretty strong relationship between inflation and unemployment in the 1950s and 1960s, you’d be hard-pressed to find a consistent and reliable relationship in subsequent decades.
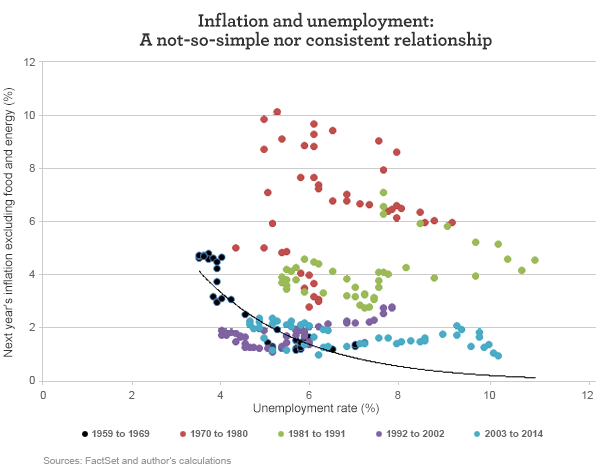
The relationship between unemployment and inflation is not so simple, and a key factor is globalization. A low unemployment rate in the U.S. might not lead to wage increases because the labor market is global, not local. Also, price increases are hard to come by, when domestic producers must compete with foreign producers. The U.S. has become much more open to trade, and globalization has transformed old empirical relationships.
So which inflation indicators are worth watching?
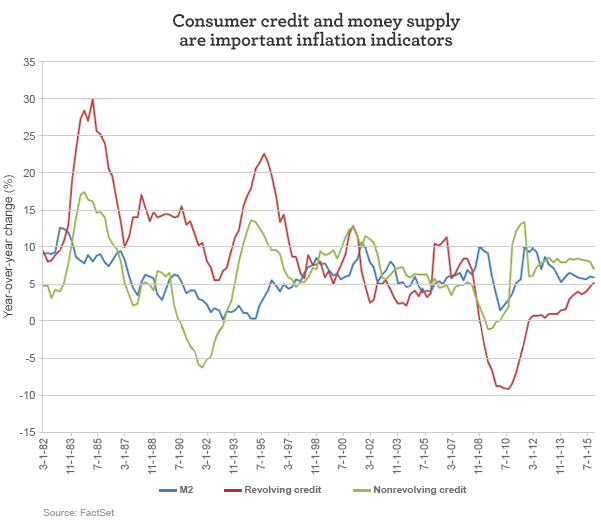
A better place to look for signs of future inflation is in the monetary and credit aggregates. The economist Milton Friedman famously said, “Inflation is always and everywhere a monetary phenomenon, in the sense that it is and can be produced only by a more rapid increase in the quantity of money than in output.” His dictum needs to complement money with credit, since not all transactions are done with cash. Credit plays a very important role. That’s why looking at credit debt outstanding, home equity lines of credit, and other forms of consumer credit are important indicators of inflation.
The sources of inflation—too-rapid growth in the money or consumer credit measures—haven’t been present in this economic recovery. Nonrevolving credit has been growing at a rapid pace, but this mainly includes student and automobile loans. What tends to correlate with future inflation is growth in revolving credit, which is primarily credit card debt. The most recent data on revolving credit shows a year-over-year increase of 5.7%, which is an improvement over the past few years but still significantly below the pace of growth in the pre–financial crisis period.
Inflation could remain near 1.5% for the next year, according to forward-looking indicators, ranging from building permits and consumer expectations to Treasury yields and credit spreads. The slow growth in revolving credit and home equity debt could be on the Fed’s radar, leading it to believe the recent uptick in inflation isn’t as durable as it would like.
How investors might defend against eventual inflation
Let’s begin with TIPS and Treasury notes. If you take the Fed at its word, inflation will eventually return to its 2% target. Maybe it will be sooner, but I think it’s still a ways off. Regardless, how can you beat inflation in a low-interest-rate world? Some have looked to TIPS as place of value. TIPS pay interest twice a year based on their adjusted principal value, which is adjusted based on changes in the CPI. If there is deflation, the principal value is adjusted down; although at maturity, you are given assurances that you will get at least the original face value back.
- You can calculate the breakeven inflation rate, which is the rate of inflation that would need to prevail to have the return on TIPS be equal to a regular Treasury security with the same maturity. Comparing a five-year TIPS to a five-year Treasury note gives you a breakeven inflation rate. If the actual pace of inflation exceeds that breakeven rate, you will make more money off the TIPS than the normal Treasury. If the actual rate of inflation is lower than the breakeven rate, you would have been better off holding the normal Treasury.
- Some people mistakenly believe the breakeven rate is a measure of inflation expectations. It’s not. There are differences in the types of investors that hold TIPS compared with normal Treasuries, leading to a type of clientele effect. This makes the breakeven rate a biased and imperfect measure of inflation expectations. TIPS also don’t garner as much interest and trading activity, so they often have a liquidity premium, further distorting the breakeven rate as a measure of inflation expectations.
- Because TIPS not only adjust coupon payments for changes in realized inflation but also provide comfort to investors who may be risk-averse to inflation changes, the breakeven rate may periodically understate investors’ actual expectations of inflation. This is especially true when low inflation (or deflation) can coincide with bad economic outcomes, like job losses or consumption declines. There are other times when high inflation coincides with bad economic outcomes, like the stagflation of the late 1970s.
In short, don’t read too much into the breakeven rate. Just use it for what it is: a way to choose between normal Treasuries and TIPS based on what you expect inflation to be over the life of the security.
As of the end of March, the breakeven rate on the 5-year TIPS was 1.49% and the breakeven on the 10-year TIPS was 1.62%. If you believe the Fed will hit its inflation target, maybe those TIPS are more attractive than normal Treasuries. Keep in mind, though, that TIPS go up and down in value. If you want to sell before maturity, it’s uncertain what you might get for them. The daily value can fluctuate, just like any other asset. If interest rates go up, TIPS obey the same iron law of fixed income as other bonds: Interest rates going up mean prices go down. If you believe interest rates will rise while TIPS outperform Treasuries, that could be of little comfort if both are going down in value.

Short-term high yield: A better option
In a falling rate environment, the median return on the Barclays U.S. Treasury Inflation-Protected Securities Index was greater than the median return on the Barclays Global Treasury Index, which was greater than the return on the Barclays U.S. Corporate High Yield Index (1-3 Year). The short-term high-yield index had the widest range of historical outcomes.
|
Annual return in excess of inflation |
|||||
|
Falling rates |
Minimum |
First quartile |
Median |
Third quartile |
Maximum |
|
Barclays U.S. Corporate High Yield Index (1-3 Year) |
-28.27 |
0.15 |
4.01 |
8.83 |
44.08 |
|
Barclays U.S. Treasury Inflation-Protected Securities Index |
-9.29 |
1.85 |
5.88 |
9.44 |
17.57 |
|
Barclays Global Treasury Index |
0.00 |
3.25 |
5.03 |
7.58 |
12.64 |
Sources: FactSet and author’s calculations
The risk/return profile in a rising rate environment is very different. Short-term high-yield bonds not only had the highest median return; they also had a return profile that was significantly biased toward the upside.
|
Annual return in excess of inflation |
|||||
|
Rising rates |
Minimum |
First quartile |
Median |
Third quartile |
Maximum |
|
Barclays U.S. Corporate High Yield Index (1-3 Year) |
-5.10 |
1.37 |
4.93 |
8.90 |
67.47 |
|
Barclays U.S. Treasury Inflation-Protected Securities Index |
-10.32 |
-2.16 |
1.15 |
5.07 |
17.85 |
|
Barclays Global Treasury Index |
-5.38 |
-2.57 |
-0.65 |
0.79 |
4.00 |
Sources: FactSet and author’s calculations
While TIPS could be a better option than normal Treasuries, I think short-term high yield can offer an even better option for those seeking to beat inflation. This area is not without its risks, especially the risk of defaults. This is why diversification and credit research are important.
Not all short-term high-yield strategies are the same. Some investors hold long-term high-yield securities but reduce the duration of the portfolio through the use of derivatives. This strategy may work, but it exposes an investor to additional risks compared with a strategy that purchases short-term securities without using derivatives to convert a long-term portfolio into a short-duration portfolio. A genuine short-term portfolio that is diversified and thoughtfully constructed is, in my opinion, a superior way to mitigate the damage done by inflation—whenever it may return.
Please visit our blog, AdvantageVoice, for additional viewpoints from Wells Fargo Asset Management’s investment strategists, portfolio managers, and practice management experts. You can also follow us on Twitter at @WFAssetMgmt for real-time updates. Are you an advisor or institutional investor? Check out our website for investment professionals.
The views expressed are as of 4-12-16 and are those of Dr. Brian Jacobsen, CFA, CFP®, and Wells Fargo Funds Management, LLC. The information and statistics in this report have been obtained from sources we believe to be reliable but are not guaranteed by us to be accurate or complete. Any and all earnings, projections, and estimates assume certain conditions and industry developments, which are subject to change. The opinions stated are those of the authors and are not intended to be used as investment advice. The views and any forward-looking statements are subject to change at any time in response to changing circumstances in the market and are not intended to predict or guarantee the future performance of any individual security, market sector or the markets generally, or any mutual fund. Wells Fargo Funds Management, LLC, disclaims any obligation to publicly update or revise any views expressed or forward-looking statements.
Wells Fargo Asset Management (WFAM) is a trade name used by the asset management businesses of Wells Fargo & Company. Wells Fargo Funds Management, LLC, a wholly owned subsidiary of Wells Fargo & Company, provides investment advisory and administrative services for Wells Fargo Funds. Other affiliates of Wells Fargo & Company provide subadvisory and other services for the funds. The funds are distributed by Wells Fargo Funds Distributor, LLC, Member FINRA, an affiliate of Wells Fargo & Company.
Not FDIC Insured • No Bank Guarantee • May Lose Value
© Wells Fargo Asset Management