Diversification: Full of Trade-Offs, Just Like Life
Diversification is supposed to reduce risk without reducing returns, right? No. Life is full of trade-offs. Diversification allows you to reduce risk, but it does come at a cost. It’s just that the cost is pretty low for what you get in return.
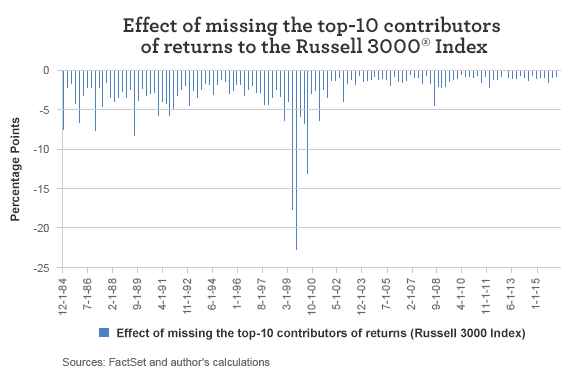
You may have heard of the Pareto Principle, which is the idea that 80% of effects come from 20% of causes. It seems to me like a similar idea could hold true in investing, where 80% of returns come from 20% of holdings. You can see this at work by looking at the quarterly contributions to equity returns on the Russell 3000 Index. If you missed out on investing in the index’s top-10 contributors every quarter, the average quarterly underperformance of your portfolio from 1985 through 2015 would have been 2 percentage points. That’s quarterly returns. That’s a lot.
Diversification can lead to disappointment if you don’t think about it in the right way. Looking in the rearview mirror of your investments can make you wonder why you even try to diversify. Look at the past three years: Large-cap U.S. stocks have dominated most other asset classes. So why not just hold large-cap U.S. stocks?
Well, there’s a reason investments carry the disclaimer “Past performance is no guarantee of future results.” How an asset class performed over the past three years doesn’t tell you much about how that asset class will perform over the next three years, or even the next year.
|
Above-average performer based on trailing 12 months (% of time) |
Above-average performer for three straight years (% of time) |
Three good years lead to a fourth (% of time) |
|
|
Russell Top 200 Index |
31.18 |
11.29 |
6.99 |
|
Russell Midcap® Index |
55.91 |
16.13 |
5.38 |
|
Russell 2000® Index |
36.02 |
2.15 |
– |
|
MSCI Emerging Markets Index |
46.24 |
20.43 |
13.98 |
|
MSCI EAFE (Europe, Australasia, Far East) Index |
38.17 |
13.44 |
6.45 |
|
BofA Merrill Lynch U.S. High Yield Index |
23.66 |
1.61 |
– |
|
BofA Merrill Lynch Global Broad Market Ex U.S. Dollar Index |
26.34 |
– |
– |
|
BofA Merrill Lynch U.S. Corporate Index |
35.48 |
4.30 |
– |
|
BofA Merrill Lynch Liquid U.S. Treasury Index |
40.32 |
4.30 |
– |
|
MSCI U.S. REIT Index |
66.67 |
21.51 |
6.99 |
Sources: FactSet and author’s calculations
As shown in the above table, REITs did well from 2011 to 2013 but were also the bottom performer in 2014. High-yield bonds did well from 2008 to 2010 but were near the bottom of the heap in 2011. Emerging markets had three good years from 2006 to 2008 but fell apart in the financial crisis. Investment-grade bonds were top fliers from 2001 to 2003 but were second to last in 2004. A three-peat isn’t an indicator that another winning year is in the making.
Here’s the problem with diversification: After the fact, diversification can look like a drag. But because you don’t know which security or asset class will do best, you diversify. If you knew which would do best, you’d just go all in on the winner, right? The problem is that if you’re wrong, you’re just holding a loser of a portfolio.
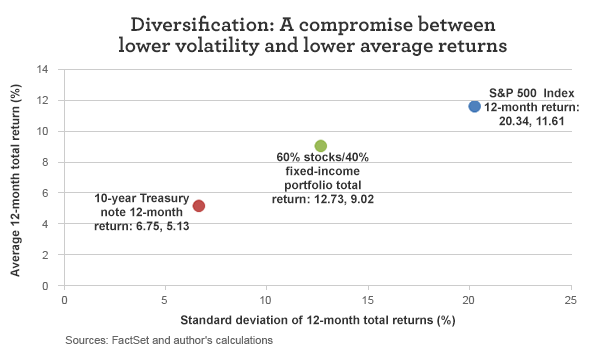
Diversification does what it’s supposed to do: It’s a compromise between lower average returns and lower volatility. From January 1900 through March 2016, the average 12-month total return on the S&P 500 Index was 11.61%, but that came with a standard deviation of returns of more than 20%. A portfolio consisting solely of 10-year Treasury notes would have returned 5.13% per annum. That’s a lot lower, but it also had lower volatility (6.75%). A balance between the two would have given you more than three-quarters of the returns on the S&P 500 Index with about three-fifths the volatility. To me, that’s a decent compromise.
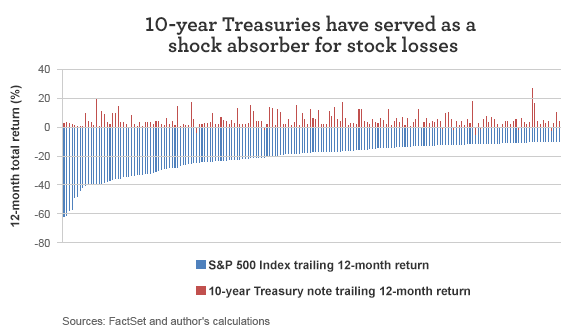
The compromise seems very attractive, especially when you focus on the periods in which the S&P 500 Index dropped 10% or more. Since 1900, Treasury notes had decent returns during those down periods for stocks. No, it wasn’t enough to completely offset the losses on stocks, but they served as a shock absorber. That’s why you hold them.
After the fact, diversification will almost always look like it’s a big disappointment. You have to position your portfolio before you know how things will play out, which is why you diversify.
Please visit our blog, AdvantageVoice, for additional viewpoints from Wells Fargo Asset Management’s investment strategists, portfolio managers, and practice management experts. You can also follow us on Twitter at @WFAssetMgmt for real-time updates. Are you an advisor or institutional investor? Check out our website for investment professionals.
The views expressed are as of 6-7-16 and are those of Dr. Brian Jacobsen, CFA, CFP, and Wells Fargo Funds Management, LLC. The information and statistics in this report have been obtained from sources we believe to be reliable but are not guaranteed by us to be accurate or complete. Any and all earnings, projections, and estimates assume certain conditions and industry developments, which are subject to change. The opinions stated are those of the authors and are not intended to be used as investment advice. The views and any forward-looking statements are subject to change at any time in response to changing circumstances in the market and are not intended to predict or guarantee the future performance of any individual security, market sector or the markets generally, or any mutual fund. Wells Fargo Funds Management, LLC, disclaims any obligation to publicly update or revise any views expressed or forward-looking statements.
Wells Fargo Asset Management (WFAM) is a trade name used by the asset management businesses of Wells Fargo & Company. Wells Fargo Funds Management, LLC, a wholly owned subsidiary of Wells Fargo & Company, provides investment advisory and administrative services for Wells Fargo Funds. Other affiliates of Wells Fargo & Company provide subadvisory and other services for the funds. The funds are distributed by Wells Fargo Funds Distributor, LLC, Member FINRA, an affiliate of Wells Fargo & Company.
Not FDIC Insured • No Bank Guarantee • May Lose Value
© Wells Fargo Asset Management