Here's What 1969 and 1975's Market Recoveries Can Teach Brexit-Conscious Investors
These charts show how markets recover after big declines
While June 23’s Brexit referendum was a milestone in history, June 24 was host to a pretty rare event in the markets: Not only did 10-year Treasury yields drop from 1.56% to 1.43% (more than a two-standard-deviation event in statistical parlance), but the S&P 500 Index also dropped nearly 3.6% (another two-standard-deviation event). Statistically, these events are rare. In fact, since March 1967, simultaneous drops in yields and stocks of these sizes have occurred only 0.5% of the time (63 trading days out of 12,797 trading days). Investors can take away interesting lessons from these historical occurrences.
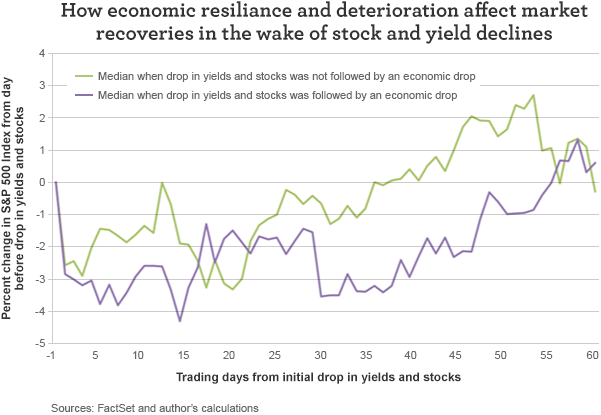
Using the Chicago Federal Reserve’s National Activity Index—a monthly economic indicator of economic expansion or contraction—I separated the previous episodes of drops in yields and stocks into two categories: those where within three months the economy deteriorated and those when it didn’t. Here are the results:
- Half the time, yield and stock drops were followed by economic slowdowns.
- In the other half of the time, there was no ensuing economic slowdown.
- In both instances, the market quickly bottomed and staged a recovery.
During times of economic resilience, when there was a setback within a month, after approximately two months the market was past its previous peak. When there was economic deterioration, the initial bounce was followed by a deeper drop. Eventually, the economy and the market recovered, but it took twice as long compared with when there was economic resilience.
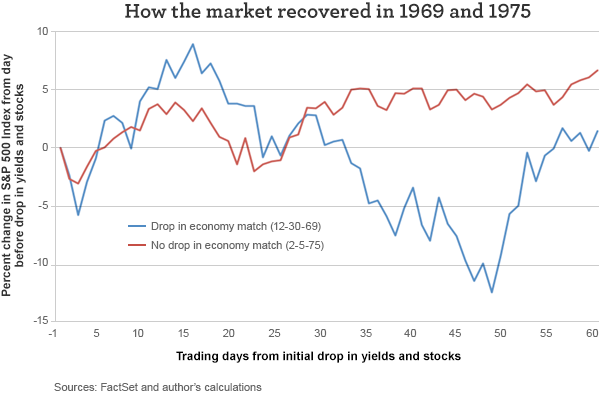
So far, the stock market is tracing out a pattern similar to the markets that started on December 30, 1969, and February 5, 1975. The 1975 experience was one where there wasn’t an ensuing economic slowdown. The 1969 experience was one where there was. In both cases, the market recovered to its previous peak within three trading days. The market charged higher—but actually faster and higher—when the economy was slowing. Of course, people didn’t know until after the fact that the economy was slowing. But the market shot 8.8% higher than its previous level in 1969, setting up for a 20% drop within a month and a half.
In 1975, the market went higher, but it didn’t bubble up like it did in 1969. There was some giveback within a month, but then it marched higher from there.
For investors, what does this mean? Don’t get too excited about market rallies, and don’t get too despondent about market routs. If your view is like mine, where you see a good Institute of Supply Management manufacturing number and decent initial unemployment claims data and think the weak May employment situation report was an aberration, then you can take solace in the fact that the most recent market drop is pretty run of the mill—at least as far as these rare market events go.
If you think Brexit will have deeper consequences, then I don’t fault you if you feel like you should wait a bit longer before reengaging with the markets. Don’t wait too long, though. Even when the market drops are justified by fundamental economic weakness, things turn eventually—and then quickly.
Please visit our blog, AdvantageVoice, for additional viewpoints from Wells Fargo Asset Management’s investment strategists, portfolio managers, and practice management experts. You can also follow us on Twitter at @WFAssetMgmt for real-time updates. Are you an advisor or institutional investor? Check out our website for investment professionals.
The views expressed are as of 7-6-16 and are those of Dr. Brian Jacobsen, CFA, CFP, and Wells Fargo Funds Management, LLC. The information and statistics in this report have been obtained from sources we believe to be reliable but are not guaranteed by us to be accurate or complete. Any and all earnings, projections, and estimates assume certain conditions and industry developments, which are subject to change. The opinions stated are those of the authors and are not intended to be used as investment advice. The views and any forward-looking statements are subject to change at any time in response to changing circumstances in the market and are not intended to predict or guarantee the future performance of any individual security, market sector or the markets generally, or any mutual fund. Wells Fargo Funds Management, LLC, disclaims any obligation to publicly update or revise any views expressed or forward-looking statements.
Wells Fargo Asset Management (WFAM) is a trade name used by the asset management businesses of Wells Fargo & Company. Wells Fargo Funds Management, LLC, a wholly owned subsidiary of Wells Fargo & Company, provides investment advisory and administrative services for Wells Fargo Funds. Other affiliates of Wells Fargo & Company provide subadvisory and other services for the funds. The funds are distributed by Wells Fargo Funds Distributor, LLC, Member FINRA, an affiliate of Wells Fargo & Company.
Not FDIC Insured • No Bank Guarantee • May Lose Value
© Wells Fargo Asset Management