Tips for Building Retirement Income (and Your Wine Cellar)
By Christian Chan, CFA, and Kandarp Acharya, CFA, FRM, portfolio managers of the Wells Fargo Dynamic Target Date Funds.
In our last post, we left you with the following piece of data: The average retirement investor will contribute roughly $299,000 to their retirement savings over the course of their lives. Depending on your perspective, $299,000 may or may not seem like a lot of money. On the one hand, that amount will buy you 149,500 bottles of Trader Joe’s two-buck chuck—that’s a lot of vino! On the other hand, that same amount will only net you about $15,000 a year in retirement income (if you assume a 20-year retirement period, excluding interest and inflation).
Now, I know what you might be thinking…$15,000 a year could buy you 7,500 bottles of two-buck chuck, which is more than 20.5 bottles per day. While this could no doubt make your house the go-to gathering spot for local retirees, sadly, most of us will have non-wine-related expenses in retirement.
Calculating future income needs
A common way to estimate how much annual income you’ll need in retirement is to take a percentage of your current income or a percentage of your estimated income just prior to retirement (this is called a replacement rate). Based on a review of several articles, the estimates range from 60% to 80% in terms of what percentage of working annual income investors will need each year in retirement. Just to keep things simple, let’s assume we’re looking for an 80% replacement rate.
So where does that leave us? Well, if you expect that your working income just prior to retirement is about $65,000 (which is the national average at age 65), then you’ll need approximately $52,000 (80% of $65,000) in annual retirement income. Multiply that by 20 (for a 20-year retirement) and you find that you’ll need approximately $1,040,000 to retire with an 80% income replacement rate (this excludes interest and inflation).
Here’s the challenge: As we’ve noted, the average retirement saver only puts away a total of $299,000 over the course of their working life—but we need $1,040,000 to comfortably retire. So how do we get from $299,000 to $1,040,000? Well, that’s where building a sound investment strategy comes into play.
Building a strategy: Scenario one
The way I like to approach retirement investing does involve some math, but conceptually, it’s quite simple. In our first scenario, we’re making assumptions around how much investors are contributing to their retirement accounts and then we’re mapping out how much those accounts may grow based on two factors: a capital market return scenario and one potential asset allocation.
Let’s focus on the average worker (who experiences average income growth and makes average retirement plan contributions) as an example. For the purpose of this exercise, we’ll assume that equities return 8% annually, bonds return 4% annually, and our average worker follows a consistent asset allocation of 60% equities and 40% bonds over the investment horizon. Here is how that scenario could play out.
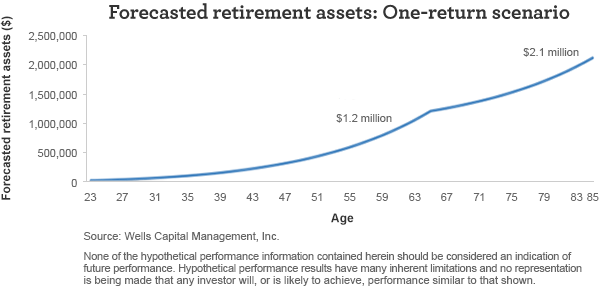
Our hypothetical account grows steadily at 6.4% (60 times our equity return of 8% and 40 times our bond return of 4%) plus contributions, resulting in an account value of $1.2 million at retirement. This is well north of our targeted $1,040,000 level (good news!). After age 65, the account continues to grow to $2.1 million at age 85 because the growth rate of 6.4% is greater than the annual withdrawal rate of $52,000 per year (even better news!). I’d say that our first scenario resulted in a pretty successful retirement outcome. Unfortunately, it’s hard to find an asset that returns 6.4% year-in and year-out. There are assets that have returned close to 6.4%, but you had to tolerate some year-over-year fluctuations. This is where scenario two comes into play.
Building a strategy: Scenario two
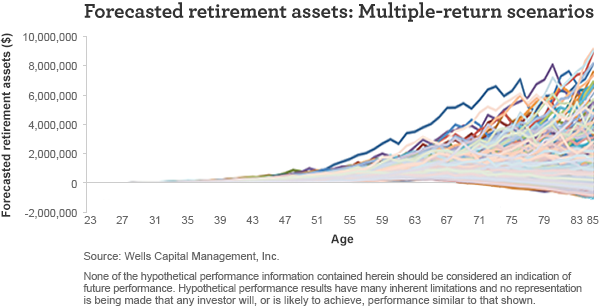
Using our in-house simulation model, we generated 10,000 potential return scenarios for our hypothetical retirement account. This enables us to look at the distribution of potential outcomes, including the average case, the median case, the best 5% case, and the worst 5% case, at any point in time.
I like to look at three statistics in particular when I evaluate these scenarios:
- Average wealth at retirement: This is the average account value for our hypothetical retirement account at age 65 across the 10,000 simulated capital market scenarios.
- Probability of retirement income shortfall: This is the probability that the hypothetical retirement savings account value is below zero at age 85. A retirement income shortfall indicates that the account value is not able to fund the targeted replacement rate during retirement.
- Magnitude of retirement income shortfall: This is the average hypothetical account shortfall, if there is an instance of shortfall.
Factoring in those statistics, here are the simulation results of our 60% equity/40% bond portfolio:
- Average wealth at retirement: $1,191,452
- Probability of retirement income shortfall: 18%
- Magnitude of retirement income shortfall: -$22,103 (annual)
While that’s still a pretty good outcome, we now have some nuances to consider. First of all, a $1,191,452 average account value at retirement is lower than the $1.2 million forecast we generated earlier using a consistent 6.4% growth rate. That’s because our 10,000-return path simulation incorporates variability in year-over-year returns.
Second, there is an 18% probability that we would run out of money in retirement. And if we run out of money, on average, we would fall short by $22,103 per year. Those last two statistics are critical because they’re related to risk. The probability of shortfall statistic indicates the likelihood that you’ll need to change your annual expenditures in retirement (that is, reduce your annual retirement spending from $52,000). The magnitude of shortfall statistic gives you an idea of how much you’ll need to change your expenditures. In this case, you would have to reduce your annual spending from $52,000 to about $30,000 (a 40% reduction).
That retirement scenario doesn’t sound quite as good, but here’s where this exercise gets fun and interesting.
How shifting your allocation mix can make a difference
Let’s say instead of investing in the consistent 60% equity/40% bond portfolio, we invest in 100% equities from age 23 to age 50, and then shift our allocation mix to 35% equities from age 50 to age 85 (resulting in an average equity allocation of 60% over the entire period). Here are the results of that portfolio model:
- Average wealth at retirement: $1,253,046
- Probability of retirement income shortfall: 19%
- Magnitude of retirement income shortfall: -$19,025 (annual)
Interesting! If we keep the same average equity allocation but start with a higher allocation and end with a lower allocation, we can get a higher average wealth at retirement, a similar probability of shortfall, and a lower magnitude of shortfall.
Why does this happen? Well, your average equity allocation tends to be a driver of your average wealth (the higher the average equity allocation, the higher the average ending wealth), but it also drives shortfall. Higher equity allocations can result in a wider range of potential outcomes, which can lead to a greater magnitude of shortfall (and a greater probability of shortfall).
To a certain extent, you can mitigate shortfall risk by lowering the range of your portfolio’s potential outcomes (that is, shifting your portfolio mix toward bonds), as you get closer to retirement and when you start withdrawing money from your retirement account. While this is consistent with many behavioral aspects of retirement planning (for example, people’s changing views of risk, the desire for certainty for financial planning purposes, etc.), I wanted to demonstrate that there is some math behind this approach, too.
Based on our hypothetical model, by adjusting your asset allocation over time, you can get a higher average ending wealth, a similar probability of shortfall, and potentially a $3,078 lower magnitude of shortfall. And for those of you still keeping track of wine-related expenditures, that’s 1,539 bottles of two-buck chuck (per year, not day).
Please visit our blog, AdvantageVoice, for additional viewpoints from Wells Fargo Asset Management’s investment strategists, portfolio managers, and practice management experts. You can also follow us on Twitter at @WFAssetMgmt for real-time updates. Are you an advisor or institutional investor? Check out our website for investment professionals.
The views expressed are as of 7-28-16 and are those of Christian Chan, CFA, Kandarp Acharya, CFA, FRM, and Wells Fargo Funds Management, LLC. The information and statistics in this report have been obtained from sources we believe to be reliable but are not guaranteed by us to be accurate or complete. Any and all earnings, projections, and estimates assume certain conditions and industry developments, which are subject to change. The opinions stated are those of the authors and are not intended to be used as investment advice. The views and any forward-looking statements are subject to change at any time in response to changing circumstances in the market and are not intended to predict or guarantee the future performance of any individual security, market sector or the markets generally, or any mutual fund. Wells Fargo Funds Management, LLC, disclaims any obligation to publicly update or revise any views expressed or forward-looking statements.
Wells Fargo Asset Management (WFAM) is a trade name used by the asset management businesses of Wells Fargo & Company. Wells Fargo Funds Management, LLC, a wholly owned subsidiary of Wells Fargo & Company, provides investment advisory and administrative services for Wells Fargo Funds. Other affiliates of Wells Fargo & Company provide subadvisory and other services for the funds. The funds are distributed by Wells Fargo Funds Distributor, LLC, Member FINRA, an affiliate of Wells Fargo & Company.
Not FDIC Insured • No Bank Guarantee • May Lose Value
© Wells Fargo Asset Management