Has the hunt for yield reached emerging markets equities?
High valuations for U.S. stocks coupled with low interest rates and ample liquidity have driven a much-talked about search, or hunt, for yield. Thankfully, we have not yet seen a broad impact on higher-yielding stocks in the emerging markets.
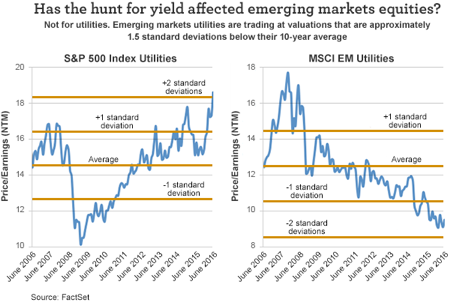
Take utilities—often the prototypical dividend sector—as an example. Over the past 10 years, the average price/earnings ratio for the next 12 months (P/E NTM) for the utilities sector, within the S&P 500 Index, was approximately 14.5. However, the last time utilities saw that level was in December 2012, and the sector recently reached a 10-year high of 18.6, as of June 30, 2016. And that two-year high for utilities represents a two-standard deviation difference from the 10-year average. (Standard deviation of return measures the average deviations of a return series from its mean and is often used as a measure of risk. It is based on historical performance and does not represent future results.)
Now let’s look at the utilities sector within the MSCI Emerging Markets Index. As you’ll note in the following chart, emerging markets utilities are actually trading at valuations that are approximately 1.5 standard deviations below their 10-year average. With utilities as a key example, clearly the search for yield has not yet affected the emerging markets equity space.
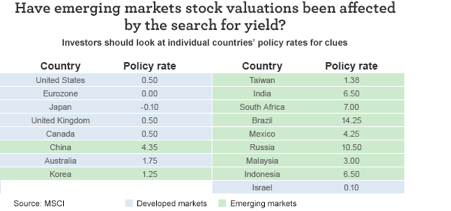
Rather than researching valuations on multiple sectors and comparing them side by side, investors may be better-served looking at the policy rates in individual countries to understand whether or not stock valuations have been affected by the search for yield. The largest components of the MSCI All Country World Index have policy rates at record lows—or even in negative territory—making higher-yielding equities potentially more attractive.
However, as the countries transition from developed to emerging in the below list, the rates start to move north—beginning with China at 4.35%—and include other large economies such as India at 6.50% and South Africa at 7.00%. The highest policy rate for a country in the MSCI Emerging Markets Index is currently Brazil at 14.25%.
Local investors in these countries don’t need to buy equities to quench their thirst for yield, and international investors may also opt for debt, or fixed-income options, as opposed to equities.
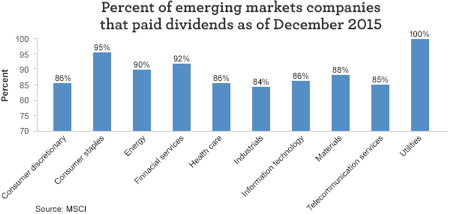
Potentially even more important than the current valuations of the stalwart dividend sector, or the individual policy rates, is the vast array of companies that pay dividends in emerging markets. Consider these statistics:
- As of the end of 2015, 89% of the companies in the MSCI Emerging Markets Index paid a dividend.
- Of that 89%, utilities led the pack with 100% of emerging markets utilities companies distributing cash back to shareholders.
- The vast majority of names in every other sector in MSCI’s index also paid dividends, bottoming out at 84% in the industrials sector.
If and when the hunt for yield does permeate emerging markets equities, investors may have the opportunity to rotate into a plethora of names in different industries, as noted in the following chart.
Please visit our blog, AdvantageVoice, for additional viewpoints from Wells Fargo Asset Management’s investment strategists, portfolio managers, and practice management experts. You can also follow us on Twitter at @WFAssetMgmt for real-time updates. Are you an advisor or institutional investor? Check out our website for investment professionals.
The views expressed are as of 8-3-16 and are those of Stephen Kinney, CFA, and Wells Fargo Funds Management, LLC. The information and statistics in this report have been obtained from sources we believe to be reliable but are not guaranteed by us to be accurate or complete. Any and all earnings, projections, and estimates assume certain conditions and industry developments, which are subject to change. The opinions stated are those of the authors and are not intended to be used as investment advice. The views and any forward-looking statements are subject to change at any time in response to changing circumstances in the market and are not intended to predict or guarantee the future performance of any individual security, market sector or the markets generally, or any mutual fund. Wells Fargo Funds Management, LLC, disclaims any obligation to publicly update or revise any views expressed or forward-looking statements.
Wells Fargo Asset Management (WFAM) is a trade name used by the asset management businesses of Wells Fargo & Company. Wells Fargo Funds Management, LLC, a wholly owned subsidiary of Wells Fargo & Company, provides investment advisory and administrative services for Wells Fargo Funds. Other affiliates of Wells Fargo & Company provide subadvisory and other services for the funds. The funds are distributed by Wells Fargo Funds Distributor, LLC, Member FINRA, an affiliate of Wells Fargo & Company.
Not FDIC Insured • No Bank Guarantee • May Lose Value