Strong Rebound for Small-Cap Stocks as Fears Dissipate
From its year-to-date 2016 low on 2/11/16 through 8/11/16, the Russell 2000 Index was up an eye-catching 29.9%. While domestic small-caps are leading off that low so far, large-caps have also put up strong double-digit returns. Over the same roughly six-month span, the S&P 500 Index rose 20.8%, and the Russell 1000 was up 21.6%.
Small-Caps Recover Strongest Since February 11 Market Low3
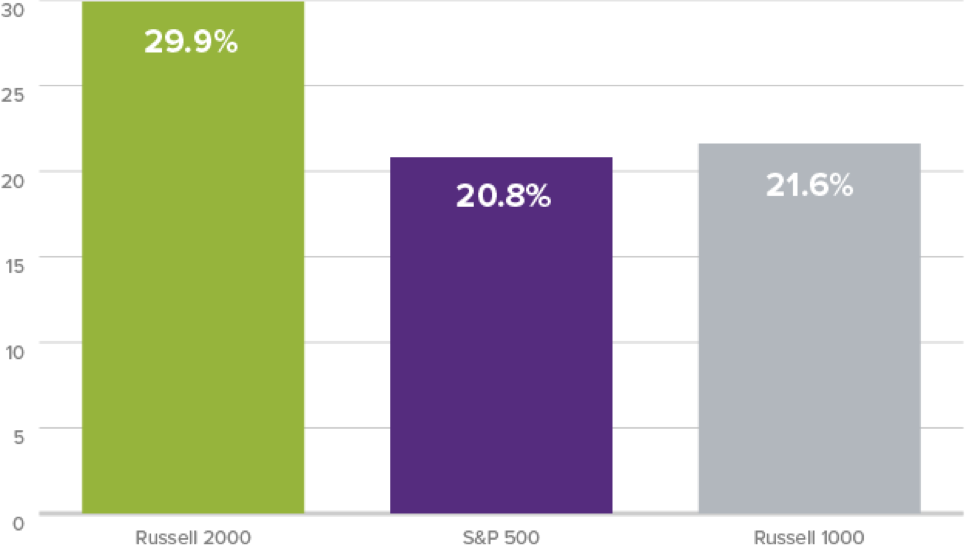
3 Chart shows performance from 2/11/16 to 8/11/16.
These figures demonstrate clearly the very impressive run equities have enjoyed after overcoming losses earlier in the year. What, then, has been lifting share prices to such lofty heights so far in 2016?We think much of the market's strength comes from what hasn't happened so far in 2016. There were a series of intense anxieties that shook markets at various times in 2016 that have so far not materialized.
At one point or another this year, investors were worried that the Fed would raise interest rates in June (thus blunting or contracting the already slow pace of economic growth) or that a non-U.S. economy would face catastrophe (likely driven by a commodity price collapse), or that China would enter a recession.
The Brexit vote raised related concerns, which included the implosion of the European Union and an imminent recession for the U.S. Through much of the year's first seven-plus months, we have also heard warnings of a profit recession for U.S. companies.
The argument holds that with growth so stubbornly slow and top-line expansion so hard to come by, the greater efficiencies that many U.S. companies have developed in the years following the Financial Crisis would begin to show diminishing returns and thus reduce or reverse earnings growth.
Yet GDP growth continues to be positive, even if the pace is tortoise-like. In fact, this slow steady growth, along with other, more positive news, seems stronger than the fear of events that have not happened.
The housing and auto markets are strong while job and wage growth is steady overall. Consumer confidence has been a bit wobbly at times but solid overall.
For our part as small-cap specialists, we have been watching the earnings picture for small-cap companies very closely. Our friends at Furey Research Partners reported on August 12 that year-over year earnings growth for the Russell 2000 was 6.5%. This is a more than respectable number, one that speaks loudly against worries about profits disappearing.
It can also be contrasted with performance for the Russell 2000, which was down 3.5% from its most recent peak on 6/23/15 through 8/11/16. (The small-cap index was up 3.1% from 8/11/15-8/11/16.)
Small-Cap Stocks Down Despite Increase in Earnings
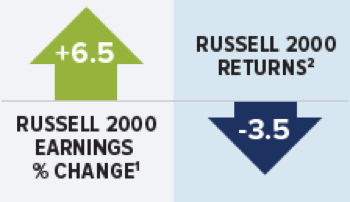
Source: Furey Research Partners
1 Last 12 Months
2 Since 6/15 peak, chart shows performance from 6/23/15 to 8/11/16.
More pertinently for our portfolios, companies in more cyclical sectors have been notably strong as well. This has been the main difference between 2015 and 2016 for many of our holdings—as well as one of the sources for the relative strength of several Royce portfolios versus their respective benchmarks so far this year.
Returns for several cyclical sectors have been strong so far in 2016, particularly off the Russell 2000’s year-to-date low 2/11/16. From that low through 8/11/16, cyclical sectors—Materials, Energy, Industrials, Financials (led, it should be noted, by REITs), Information Technology, and Consumer Discretionary—outpaced their defensive counterparts in Health Care, Utilities, Consumer Staples, and Telecommunication Services.
Cyclical Stocks4 Outperform Defensives Since February 11 Market Low5
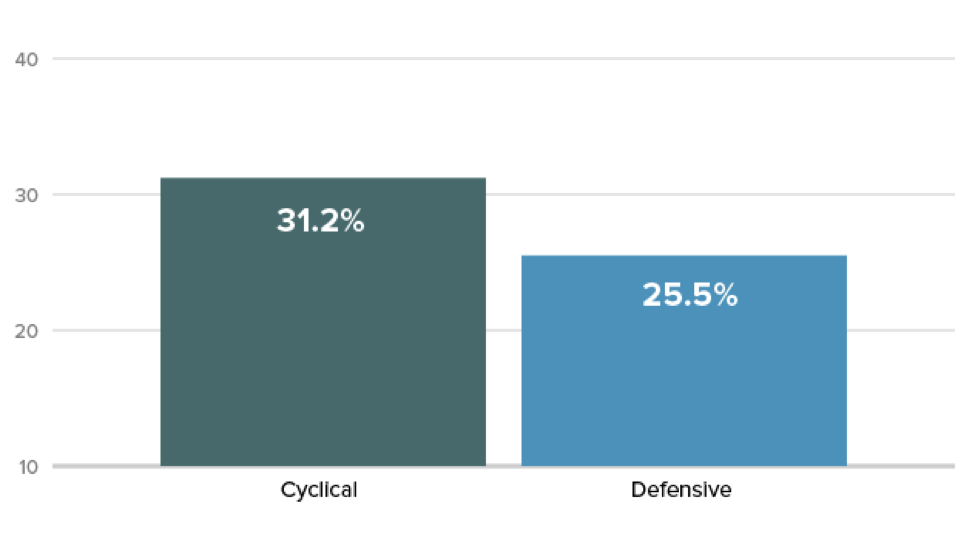
4 Cyclical and Defensive are defined as follows: Cyclical: Consumer Discretionary, Energy, Financials, Industrials, Information Technology, and Materials. Defensive: Consumer Staples, Health Care, Telecommunication Services, and Utilities.
5 Chart shows performance from 2/11/16 to 8/11/16.
Earnings have been solid, and returns have been strong throughout the small-cap universe since mid-February. So while risks and uncertainties remain, worries about an imminent recession—whether at the level of profits or the wider economy—seem misplaced.
Perhaps most important is that we still see many cyclical companies with valuations that look more attractive to us than what can be found in defensive areas such as utilities and REITs.
Going forward, we think this can benefit those cyclical businesses. Simply put, reasonably valued companies with earnings look like a sounder bet than more expensive businesses with earnings or those that don’t look to be going positive any time soon.
At a broader level, recent earnings strength also implies that the intensity of certain fears—about recession, inflation, etc.—are exaggerated. The upshot for now is that the global economy keeps limping along at its unsteady pace, while the U.S. continues to show enviable resilience and progress.
That may be all that's needed for many economically cyclical sectors to stay strong—in terms of both earnings and performance.
Stay tuned…
Important Disclosure Information
Mr. Gannon's thoughts and opinions concerning the stock market are solely his own and, of course, there can be no assurance with regard to future market movements. No assurance can be given that the past performance trends as outlined above will continue in the future.
This material is not authorized for distribution unless preceded or accompanied by a current prospectus. Please read the prospectus carefully before investing or sending money. Smaller-cap stocks may involve considerably more risk than larger-cap stocks. (Please see "Primary Risks for Fund Investors" in the prospectus.)
The Russell Investment Group is the source and owner of the trademarks, service marks, and copyrights related to the Russell Indexes. Russell® is a trademark of Russell Investment Group. The Russell 2000 Index is an unmanaged, capitalization-weighted index of domestic small-cap stocks. It measures the performance of the 2,000 smallest publicly traded U.S. companies in the Russell 3000 Index. The Russell 1000 index is an index of domestic large-cap stocks. It measures the performance of the 1,000 largest publicly traded U.S. companies in the Russell 3000 index. The S&P 500 is an index of U.S. large-cap stocks selected by Standard & Poor's based on market size, liquidity, and industry grouping, among other factors. The performance of an index does not represent exactly any particular investment, as you cannot invest directly in an index.