Why Stock Valuation Is in the Eye of the Beholder
Today we have a joint blog post from Dr. Brian Jacobsen, CFA, CFP® and Melissa Duller, CIMA®
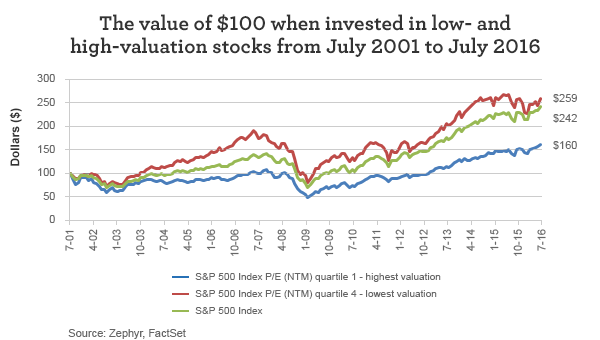
Investors value different attributes at different periods of time. However, most people think of value as it relates to a company’s earnings. From the 1920s through the early 1990s, it was well believed there was a value premium. This means lower-valuation stocks based on price/earnings (P/E) ratio outperformed higher-valuation stocks. In the chart below, note how much money investors would have made buying lower-valued stocks versus higher-valued stocks over the past 15 years.
(Note: P/E ratio is based on the average of analysts’ expectations of a company’s earnings per share over the next 12 months.)
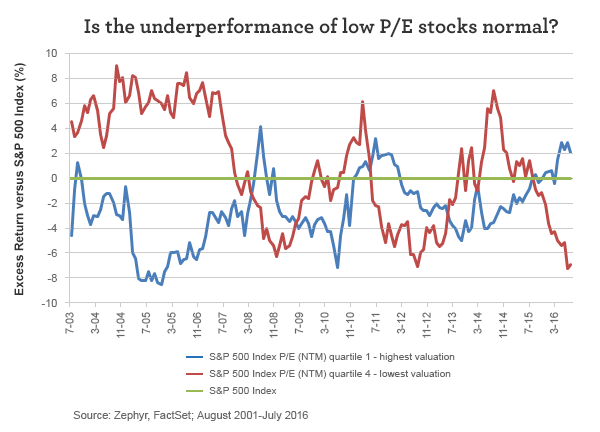
In the past three years, however, this dynamic has changed. In six of the past seven quarters, high P/E stocks have outperformed low P/E stocks. Apparently there hasn’t been much value in value. There appears to be cyclicality—or something akin to fashion fads—to what performs better: low or high P/E. Low P/E stocks outperformed markedly in periods such as 2003–2006, 2009, 2012, and 2013. Looking at rolling two-year performance spreads, low-valuation stocks have underperformed by the widest margin in 10 years.
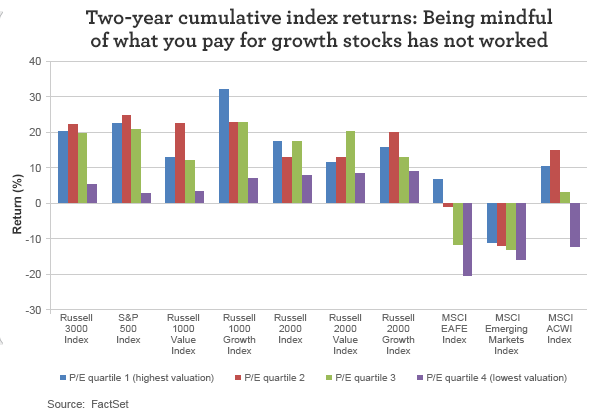
Underperformance of low P/E stocks isn’t just a phenomenon among U.S. large cap stocks. Hunting for value in low P/E stocks just hasn’t worked, whether you’re looking at U.S. large- or small-cap, value or growth, or in foreign markets.
Since the fourth quarter of 2014, when expensive stocks began outperforming cheap ones, the expansion of the P/E multiple has been much more significant for expensive stocks (quartile 1) and can account for their outperformance. By contrast, cheap stocks have not had an increase in P/E multiples to date.
How much can performance be explained by multiple expansion?
|
Since P/Es last troughed (Q4 2011) |
Since high P/Es began outperforming (Q4 2014) |
|||||
|
Change in P/E |
Cumulative return |
Percent of return resulting from multiple expansion |
Change in P/E |
Cumulative return |
Percent of return resulting from multiple expansion |
|
|
Most expensive stocks |
64% |
96% |
66% |
20% |
19% |
103% |
|
Cheapest stocks |
55% |
102% |
54% |
-5% |
1% |
0% |
|
S&P 500 Index |
57% |
113% |
50% |
9% |
15% |
65% |
Sources: FactSet, Zephyr
S&P 500 Index used to create “cheapest stocks” (P/E NTM quartile 4) and “most expensive stocks” (PE NTM quartile 1) groupings.
What investors should remember
Looking for undervalued companies (low P/E stocks) with such attributes as improving fundamentals, strong balance sheets, experienced management teams, and well-positioned products that should exhibit price appreciation hasn’t been rewarded. However, it appears that trend may be changing. It’s early, but in July and thus far in August, lower-valuation stocks outperformed higher-valuation stocks. If history is any guide, when these trends turn, they can turn for a while.
Please visit our blog, AdvantageVoice, for additional viewpoints from Wells Fargo Asset Management’s investment strategists, portfolio managers, and practice management experts. You can also follow us on Twitter at @WFAssetMgmt for real-time updates. Are you an advisor or institutional investor? Check out our website for investment professionals.
The views expressed are as of 8-30-16 and are those of Dr. Brian Jacobsen, CFA, CFP®, Melissa Duller, CIMA®, and Wells Fargo Funds Management, LLC. The information and statistics in this report have been obtained from sources we believe to be reliable but are not guaranteed by us to be accurate or complete. Any and all earnings, projections, and estimates assume certain conditions and industry developments, which are subject to change. The opinions stated are those of the authors and are not intended to be used as investment advice. The views and any forward-looking statements are subject to change at any time in response to changing circumstances in the market and are not intended to predict or guarantee the future performance of any individual security, market sector or the markets generally, or any mutual fund. Wells Fargo Funds Management, LLC, disclaims any obligation to publicly update or revise any views expressed or forward-looking statements.
Wells Fargo Asset Management (WFAM) is a trade name used by the asset management businesses of Wells Fargo & Company. Wells Fargo Funds Management, LLC, a wholly owned subsidiary of Wells Fargo & Company, provides investment advisory and administrative services for Wells Fargo Funds. Other affiliates of Wells Fargo & Company provide subadvisory and other services for the funds. The funds are distributed by Wells Fargo Funds Distributor, LLC, Member FINRA, an affiliate of Wells Fargo & Company.
Not FDIC Insured • No Bank Guarantee • May Lose Value
© Wells Fargo Asset Management