3Q16 was a strong quarter for small-cap stocks. The Russell 2000 Index (+9.0%) was ahead of both the large-cap S&P 500 (+3.9%) and Russell 1000 (+4.0%) Indexes. Small-cap strength broadened in 3Q16, and 10 of 11 sectors posted positive returns YTD.
History Suggests the Small-Cap Rally Has Room to Run

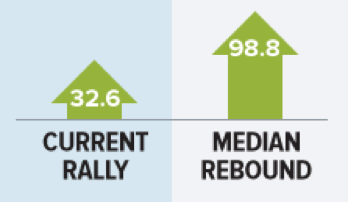
Small-cap rallies typically extend beyond the Russell 2000's 32.6% increase from its most recent trough on 2/11/16 through 9/30/16. (And at the end of 3Q16, small-caps were just shy of their 6/23/15 peak).
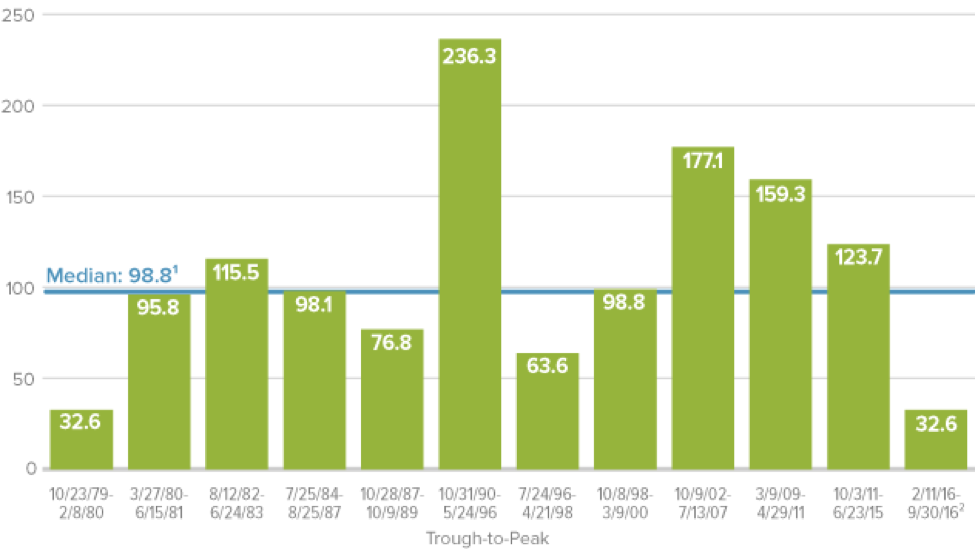
There have been 12 declines of 15% or more for the Russell 2000 since its inception in 1979. The median return for the subsequent recovery period was 98.8%.
Far Short of the Median
Small-Cap Up Market Performance After a Decline of 15% or Greater Since Russell 2000 Inception (%)
¹ Median includes only full recovery periods
² Interim trough through current
Additionally, there is pervasive pessimism about the outlook for stocks. We've seen persistent outflows from equity funds and heard increasing notes of caution from investors. These are not the signals we would typically expect at or near a performance peak.
Outlook: As contrarians, we think we are still some distance from the next small-cap peak. The U.S. economy continues to muddle through with key pockets of solid growth including housing and employment.
To be sure, this comes with the caveat that global risks remain very real, with more than the usual amount of uncertainty, and a correction would not be surprising.
Small-Cap Growth Wins the Quarter, Value Leads YTD
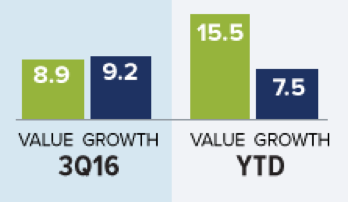
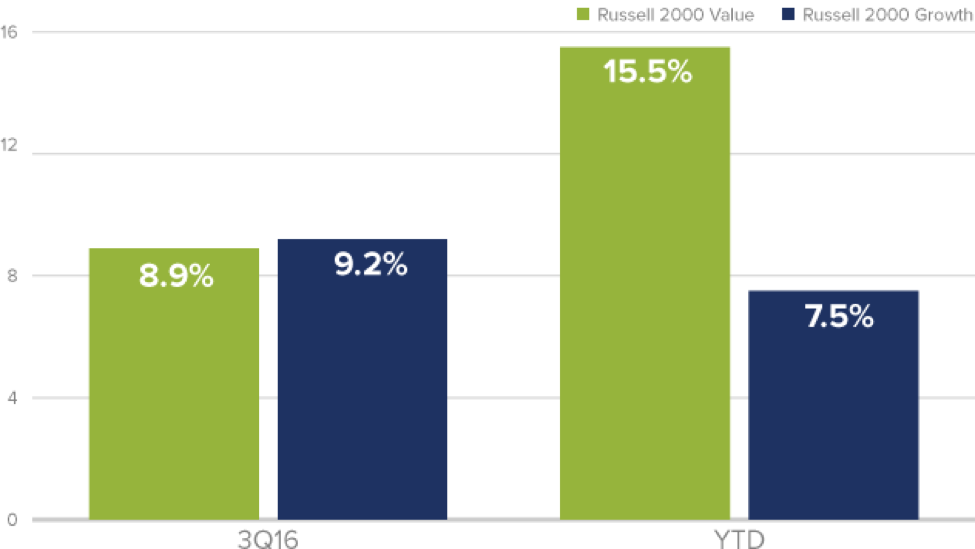
The Russell 2000 Growth Index nosed ahead of the Russell 2000 Value this quarter, but value stocks had strong absolute results and still led year-to-date.
Several overlapping areas of small-cap caught up to value stocks, with micro-caps, growth, and low-quality (as measured by earnings, profitability, and returns on invested capital) all flexing their muscles in the form of better quarterly results. Unsurprisingly in a growth-led quarter, cap-weighted returns for the Russell 2000 were higher than equal-weighted returns, which was in contrast to the first half of the year.
Outlook: In more than four decades of investment management, we have observed few forces more powerful than reversion to the mean. So we expect the long-running historical advantage for value over growth to reassert itself.
Following a lengthy period of underperformance, small-cap value's recent leadership is new, having started with the Russell 2000's peak on 6/23/15. Though we may see short-term performance shifts as the small-cap rally matures, we expect value to outperform for the cycle as a whole.
Small Value Slightly Trails Growth in 3Q16, Leads YTD
Russell 2000 Value and Growth Returns
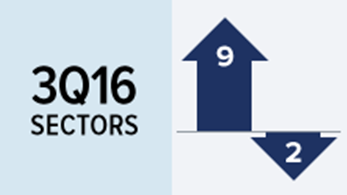
Widespread Sector Strength As Cyclicals Advance
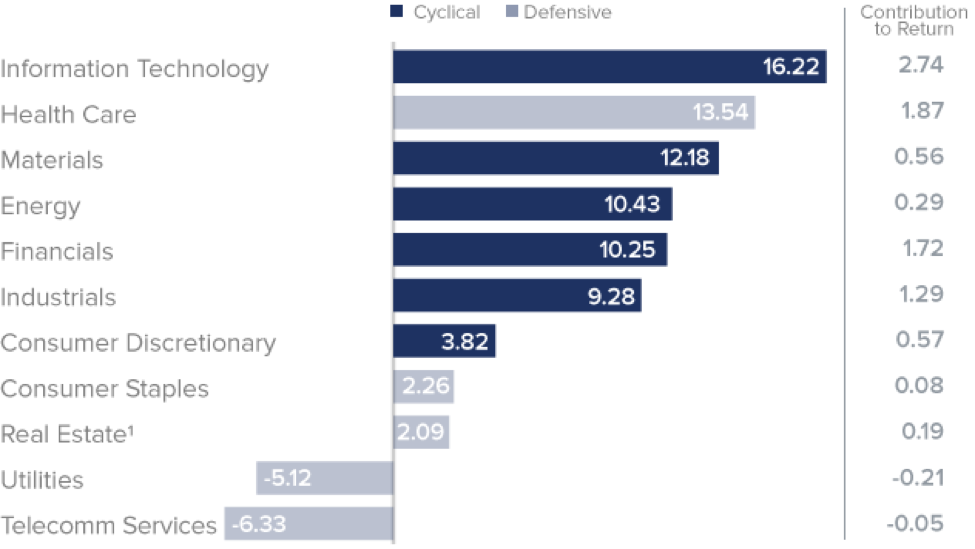
3Q16 saw a sharp contrast of its own, this time to previous growth-led periods (most notably to 2015). There was widespread sector strength in the quarter, as there has been in 2016 as a whole. Nine of the Russell 2000's 11 GICS sectors were in the black in 3Q16, with Information Technology, Health Care, Materials, and Energy making the greatest contributions to quarterly returns.
In fact, cyclical areas such as Energy, Financials, Information Technology, Industrials, and Materials all did well, while the rebound for Health Care was an anomaly among defensive sectors, contrasting relative weakness in Consumer Staples, Real Estate, Telecommunication Services, and Utilities—the last two of which were negative for the quarter.
Outlook: We expect small-cap sector strength to remain broad and perhaps keep expanding. Historically, more expansive markets have been better for value stocks.
Widespread Small-Cap Sector Strength 3Q16
Sector Returns and Contributions to Russell 2000, 6/30/16-9/30/16
1 Real Estate, formerly part of Financials, became a separate GICS sector on 8/31/16.
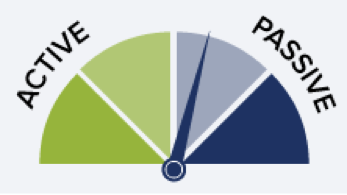
Passive Outperformed Active in 3Q16
As is more common in growth-led markets, small-cap passive strategies were ahead of active management in 3Q16, with the Morningstar Small Blend Category (our proxy for small-cap active management) up 7.1% versus a 9.0% advance for the Russell 2000.
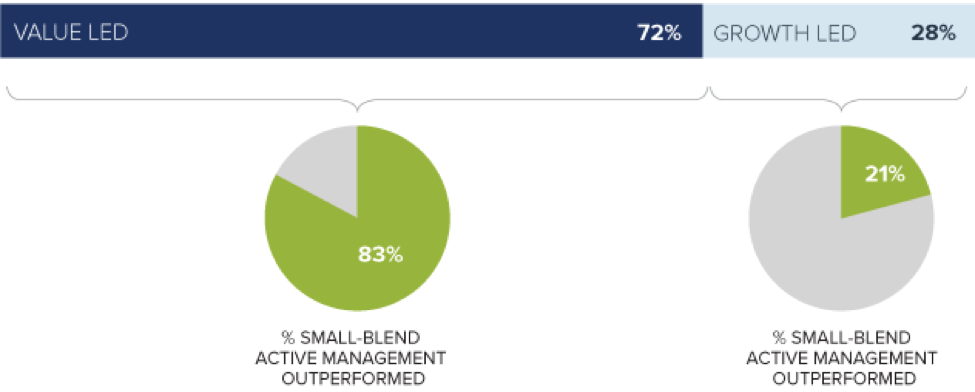
Outlook: We expect that active management will shine as small-cap value continues to lead. Our recent study, The Undiscovered Connection, showed that small blend active management has outperformed more frequently in value-led markets.
5-Year Monthly Rolling Returns from 12/31/78 through 9/30/16 (394 Periods), and % of the Periods Morningstar Small Blend Category 1 Average Beat the Russell 2000
1 There were 550 US Small Blend Funds tracked by Morningstar with at least five years of performance history as of 9/30/16
Source: Morningstar
Important Disclosure Information
This material is not authorized for distribution unless preceded or accompanied by a current prospectus. Please read the prospectus carefully before investing or sending money. Investments in securities of micro-cap, small-cap, and/or mid-cap companies may involve considerably more risk than investments in securities of larger-cap companies. (Please see "Primary Risks for Fund Investors" in the prospectus.) Investments in foreign companies may be subject to different risks than investments in securities of U.S. companies, including adverse political, social, economic, or other developments that are unique to a particular country or region. (Please see "Investing in International Securities" in the prospectus.)
The thoughts concerning recent market movements and future prospects for small-company stocks are solely those of Royce & Associates, LP, and, of course, there can be no assurances with respect to future small-cap market performance. All indexes referenced are unmanaged and capitalization-weighted. Russell Investment Group is the source and owner of the trademarks, service marks, and copyrights related to the Russell Indexes. Russell© is a trademark of Russell Investment Group. The Russell 2000 Index is an index of domestic small-cap stocks that measures the performance of the 2,000 smallest publicly traded U.S. companies in the Russell 3000 Index. The Russell 1000 index is an index of domestic large-cap stocks. It measures the performance of the 1,000 largest publicly traded U.S. companies in the Russell 3000 index. The Russell 2000 Value and Growth indexes consist of the respective value and growth stocks within the Russell 2000 as determined by Russell Investments. The performance of an index does not represent exactly any particular investment, as you cannot invest directly in an index.
For the Morningstar Small Blend Category: © 2016 Morningstar. All Rights Reserved. The information regarding the category in this piece: (1) is proprietary to Morningstar and/or its content providers; (2) may not be copied or distributed; and (3) is not warranted to be accurate, complete or timely. Neither Morningstar nor its content providers are responsible for any damages or losses arising from any use of this information.
© The Royce Funds