The word secular originates from a series of Latin words that mean an extended period of time or an era. It is actually closer to you than you might realize. On the back of the one-dollar bill, look below the pyramid on the left; the one with the strange eye above it. The term Novus ordo seclorum means a new order for the ages, a new American era. Seclorum is the word in that phrase that means ages or era. Thus, the term secular stock market cycles relates to extended periods, or eras, in the stock market.
For the stock market, secular cycles are generally qualified as either bull or bear cycles. Bull cycles are periods when stock market returns are good and bear cycles reflect periods of weakness.
That’s where agreement among secular stock market analysts and market pundits ends.
Too often, the concept of secular cycles is dismissed or misunderstood by investors because they are confronted with a lot of incorrect or contradictory information about these cycles. First impressions can be a powerful force. Adding to the confusion, there are at least three schools of thought about the causes or drivers of secular bulls and secular bears. The principles and theories within those schools are quite different.
This article seeks to help you to differentiate the various sources of secular stock market information and understand the basis of their positions. It will explore in detail key principles from the third school and conclude with a quantitative outlook for the stock market environment and expected future returns. This will show that secular cycles are mathematically-driven and not phenomena or coincidences. It will also highlight the need to focus on decade-long periods and not century-long average returns.
Keep in mind as we discuss secular stock market cycles, that these longer-term cycles are distinct from the short-term cyclical cycles that occur numerous times within secular periods. The shorter cyclical cycles are driven by emotion, events, funds flows, or any number of temporary factors. Secular cycles are extended periods of longer-term trends in the stock market.
THREE SCHOOLS
The most commonly followed school identifies secular cycles based upon chart patterns or average length of past cycles. For example, extended periods that appear to be rising (e.g., the 1980s and ‘90s) are designated as secular bulls. Extended flat or declining periods are designated as secular bears. Alternatively, other analysts in this school define bulls and bears based upon years (e.g., 17 years for secular bears). This school has a wide range of explanations for the causes behind the cycles. They include economic conditions, major events, investor psychology, etc. to explain the phenomenon driving chart patterns or time periods. Ultimately, however, the designation of secular period under this approach can be fairly subjective or it relies upon an undefined force. This school not only has the largest following of observers; it also has the largest audience of skeptics.
The second school identifies secular cycles based upon the force of reversion. The members of this school believe that the market’s valuation level is naturally drawn back to its historical mean over time. The most common measure of valuation for this mean-reverting cycle is the price-earnings ratio (“P/E”). This school believes that the market exhibits a cyclical pattern whereby P/E rises toward relative highs, then is pulled downward and through a natural mean level. The mean is considered to be the all-weather level of fair value. Then the market often overshoots into relatively low levels before reverting back toward its natural level at the mean. As this process continues, according to this school, the result is a cycle of secular bulls and bears. Members of this school are reversion-to-the-meanists that can be identified by their underlying assumption that future market returns will be impacted by the reversion of market valuation to its historical mean.

The third school believes that secular stock market cycles are driven by fundamental principles of finance and economics. In particular, Crestmont Research develops analyses and graphics that identify the inflation rate as the primary driver of P/E over secular cycles. Secular cycles are the effect of these principles; they are not patterns or phenomenon that are explained by forces or events. These principles are not merely rules or criteria, they are essentially axioms for secular stock market cycles. Crestmont’s axioms will be the primary subject of this article.
CRESTMONT’S AXIOMS
- There are only three components of general stock market returns: earnings growth, dividend yield, and the change in P/E over the investment period.
- Earnings growth is closely correlated with and caused by economic growth.
- Dividend yield is significantly driven by the level of valuation (i.e., P/E) at the time of investment.
- The level and trend of P/E is driven by the inflation rate: low, stable inflation drives P/E higher; high inflation or deflation drives P/E lower.
First, there are three components to stock market returns: earnings growth, dividend yield, and the change in P/E over the investment period. Earnings growth and P/E change determine capital gains or losses. Dividend yield provides return in addition to any capital gains or losses. These three components determine the stock market’s (or any passive stock portfolio’s) total return.
Second, each of the three components has drivers rooted in finance or economics. Each of the three components can be estimated over longer-term investment horizons with reasonably accurate ranges based upon economic assumptions. Stock market returns are not random over longer-term periods. Although the general level of stock market return is challenging to predict over days, weeks, quarters, and a few years, the relative level of stock market return is often fairly predictable over periods of 5-10 years or longer.
Third, earnings growth is closely correlated with, and derived from, economic growth. Over complete business cycles, earnings growth for a market index like the S&P 500 Index will be slightly slower on a nominal basis than the overall economy (reflecting that larger, public companies generally have slightly slower average growth than the economy with its new start-ups and sometimes faster-growing small companies). Since the range of forecasts for future economic growth is relatively narrow, earnings growth can be estimated within a relatively narrow range.
Fourth, dividend yield is most affected by the level of valuation at the time of investment. Companies distribute dividends based upon available earnings. When investors pay a high multiple of earnings (i.e., high P/E), the yield represented by the amount of dividend received is lower than the yield from the same dividend when P/E is lower. High valuation stock market periods necessarily deliver relatively low dividend yields and vice versa.
Fifth, the level and trend of P/E is driven by the inflation rate. This is the most significant principle, because it explains secular stock market cycles in financial and economic terms—and thus makes secular cycles mathematically-driven and not phenomena or coincidences. This principle identifies the significant effect that stock market revaluation has on realized market returns. It also highlights the need to focus on decade-long periods and not century-long average returns.
P/E is the current price of the market divided by the current earnings of the market. Market prices, over the longer-term, adjust to the market’s estimate of today’s value (i.e., present value) of expected future earnings at a given discount rate.
The discount rate for financial assets (e.g., stocks, bonds, etc.) is driven by the inflation rate. When the inflation rate rises, the value today for a set of future cash flows, whether stocks or bonds, declines. The result is a lowering of P, and thus the lowering of P/E. This relationship is readily accepted for the bond market. For example, rising inflation drives bond yields higher and bond prices lower. For the stock market, however, traditional wisdom about random returns and long-term averages seems to have clouded the understanding that stocks are financial securities with long-term cash flows and thus they react similarly according to changes in the inflation rate.
In contrast, during periods of deflation, the nominal level of future earnings declines. As the rate of decline increases, today’s value decreases, thereby lowering the P in P/E. Therefore, P/E’s decline during deflation is driven by a decline in the nominal level of future cash flows, not by a change in the discount rate.
As a result, P/E peaks at levels of low and stable inflation and declines as inflation moves away from price stability. The peak for P/E for periods with historically average economic growth (i.e., approximately 3% real GDP) is in the mid-20s. The trough for P/E with significantly adverse inflation or deflation conditions has typically been between 5 and 10.
THE IMPLICATIONS
The stock market is fairly-valued when the level of P/E appropriately corresponds to the level and trend of the expected inflation rate. For example, a stock market with a P/E of 25 is not necessarily overvalued if the economic conditions include low, stable inflation. Keep in mind, “fairly-valued” does not mean that investors will receive average returns. Fairly-valued means that investors should expect to receive returns commensurate with the valuation level.
The effects of a period of low, stable inflation on the three components of stock market returns are: (1) relatively lower nominal earnings growth, (2) relatively high valuation that makes dividend yield lower, and (3) a relatively high starting level for P/E that generally precludes a significant increase in P/E. As a result, periods that start with low inflation and high P/E necessarily experience below-average returns.
Extended periods of a low inflation rate and high P/E that do not have a significant change in P/E rely upon earnings growth and dividend yield for return. The low inflation rate in these periods results in relatively low nominal earnings growth. The commensurate high P/E results in relatively low dividend yield. The combination means relatively low returns from the stock market. These extended periods with a generally high P/E are periods of “secular-bear-in-hibernation.” The result is that these periods have low or modest returns, but avoid the negative effect of P/E declining.
Most notably, a secular bull cannot start from a level of high P/E—not only are the returns from earnings growth and dividend yield relatively low, but also there is little possibility of a positive contribution from P/E increasing when it starts at high levels. Secular bulls are periods with relatively high returns as the result of a positive addition from P/E increasing.
From a level of relatively high P/E, a secular bull cannot start until P/E completes its trek downward to levels where it can again double or triple. [The obvious exception would be a secular bubble, where P/E ascends from normally high levels to abnormally higher levels. …but hope springs eternal.]
Therefore, periods with high P/E deliver modest returns from earnings growth and dividend yield. Periods that start with high P/E and end with lower P/E experience a negative effect on returns. The net result is the near zero return commonly experienced from secular bear markets. Secular bears are periods with relatively low or negative returns as the result of a negative effect from P/E decreasing.
On the contrary, the effects of a period of relatively high inflation on the three components are: (1) relatively higher nominal earnings growth, (2) relatively low valuation that makes dividend yield higher, and (3) a relatively low starting level for P/E that generally precludes a significant decrease in P/E and often portends an increase in P/E. As a result, periods that start with high inflation and low P/E have solid nominal returns from earnings growth and dividend yield. But to actually experience above-average returns, investors must also receive the benefit of P/E increasing—a secular bull market. Secular bulls need a positive addition to returns from P/E increasing.
Lastly, the effects of a period of relatively significant deflation on the three components are: (1) likely negative nominal earnings growth, (2) relatively low valuation that makes dividend yield higher, and (3) a relatively low starting level for P/E that generally precludes a significant decrease in P/E and often portends an increase in P/E. The net result is low nominal returns and modest real returns. When deflation ends and the inflation rate returns to low and stable levels, the related increase in P/E adds to total return. This is an example of a secular bull market, as P/E expands due to restoring a low and stable inflation rate.
SUMMARY OF PRINCIPLES
There are generally three schools of thought about the cause of secular stock market cycles: (1) observed patterns (including time), (2) mean reversion, and (3) finance and economics (e.g., inflation-driven). All three approaches generate graphical presentations of secular cycles and enable forecasts of expected returns over the longer-term based upon assumptions or scenarios. That is evident by the wide range of views about the current secular market status and expected future returns.
Crestmont’s approach of inflation-driven valuation changes explains secular cycles with readily-accepted principles of economics and finance. It essentially bases the concept of secular cycles in mathematics. Crestmont’s graphs and secular cycle designations represent the application of the principles; history is the laboratory of experience that confirms the applicability of the principles.
Secular stock market cycles are the effect of market revaluation due to trends in the inflation rate. Trends in the inflation rate have the effect of either changing the valuation discount rate or, in deflation, decreasing the nominal amount of future earnings. Secular bulls and bears are periods when total return from the market is multiplied or offset by changes in the valuation level (i.e., P/E). Furthermore, the starting level of P/E has a significant effect on the core return from dividend yield and earnings growth. With these principles in mind, let’s view the history of secular stock market cycles and take a look at the future of returns.
HISTORY
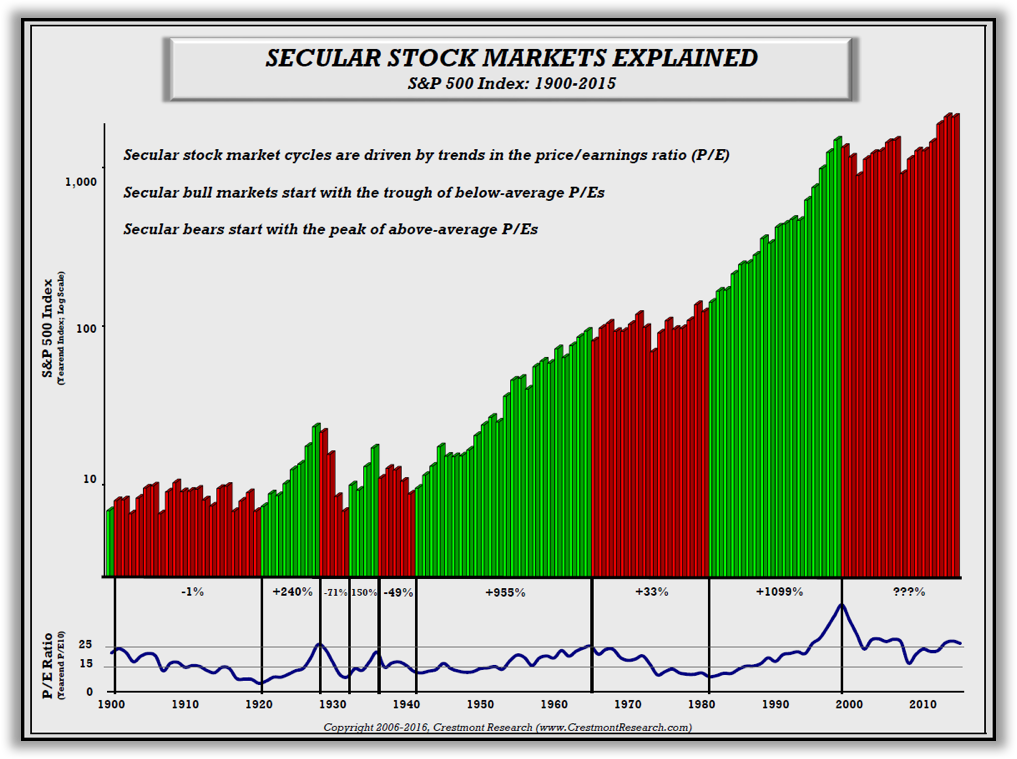
Figure 1 presents the long-term history of secular stock market cycles. Each bar in the graph represents the closing level of the stock market going back to 1900. The secular bull periods have been shaded green; the secular bears are shaded red. Note that the secular bulls provide solid gains, while the bears remain fairly flat or even decline.
The insight in Figure 1 is the blue line at the bottom of the chart. The line reflects the P/E ratio for each of the years in the chart. Note that the green bull periods represent a rising trend for P/E, while the red bear periods are driven by a declining trend for P/E.
Figure 1. Secular Stock Market Cycles Explained
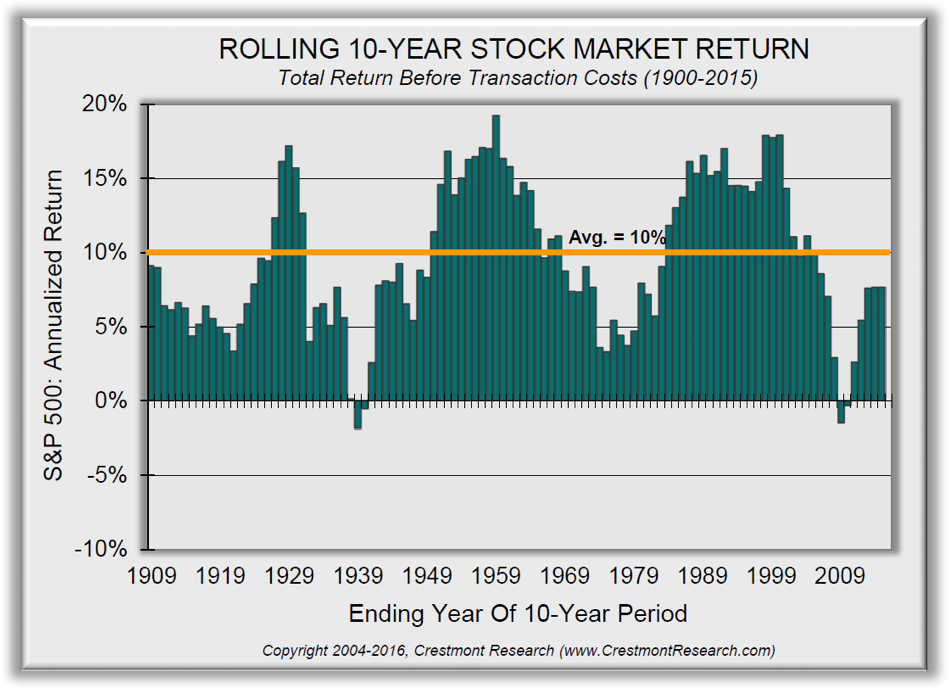
Figure 1 presents more than a century of history. Yet most investors don’t think (or invest) in terms of centuries. Instead, they tend to view investment horizons in terms of decades. For that view, Figure 2 has been developed to present all 10-year periods in the stock market since 1900. The first bar is 1900-1909, the second bar is 1901-1910, and so on. The chart reflects total return, thus it includes capital gains and dividends.
First, note the cyclical pattern in the chart. That is the effect of secular bull and bear markets on total return over investors’ horizons. Second, you’ll see that the average total return has been 10%. Third, note that average rarely happens. Most periods are well-above or well-below average. Almost 80% of the 10-year periods delivered annualized returns greater than 12% or less than 8%.
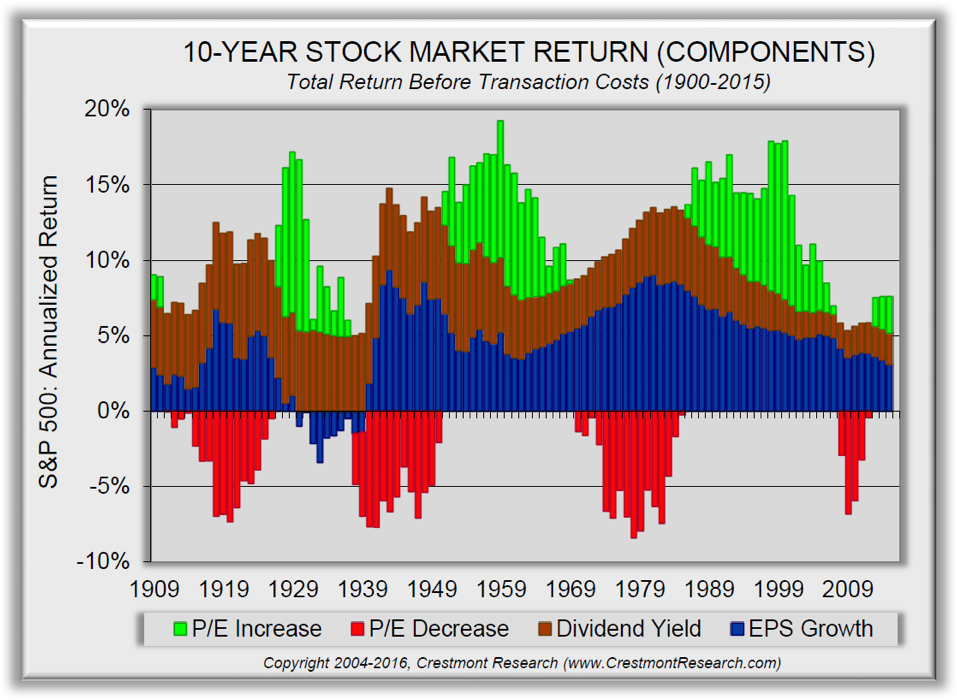
To see the factors driving returns, we can dissect total return into three component parts: earnings growth, dividend yield, and P/E change. This provides insight into the drivers that are needed for above-average returns and insight into the causes of below-average returns.
Figure 2. Rolling 10-Year Stock Market Return
Figure 3. Rolling 10-Year Stock Market Return: Components
Figure 3 presents the same rolling 10-year periods as Figure 2. Each bar has been recolored to reflect the contribution of each component. The portion of total return attributable to earnings growth is designated in blue. The portion related to dividend yield is shaded brown.
Finally, when P/E rose over the 10-year period, thus adding to total return, the final portion of the bar is shaded green. When P/E declined over the period, then a red-bar extension is added in negative territory to reflect the offset to total return. The most significant red bar extensions of P/E decline turn solid gains from earnings and dividends into the near zero total return troughs that are shown in Figure 2.
For another look at secular cycles, let’s take the blue line of P/E in Figure 1 and place the individual legs of each cycle on a chart. First, let’s review the green-bar bull cycles.
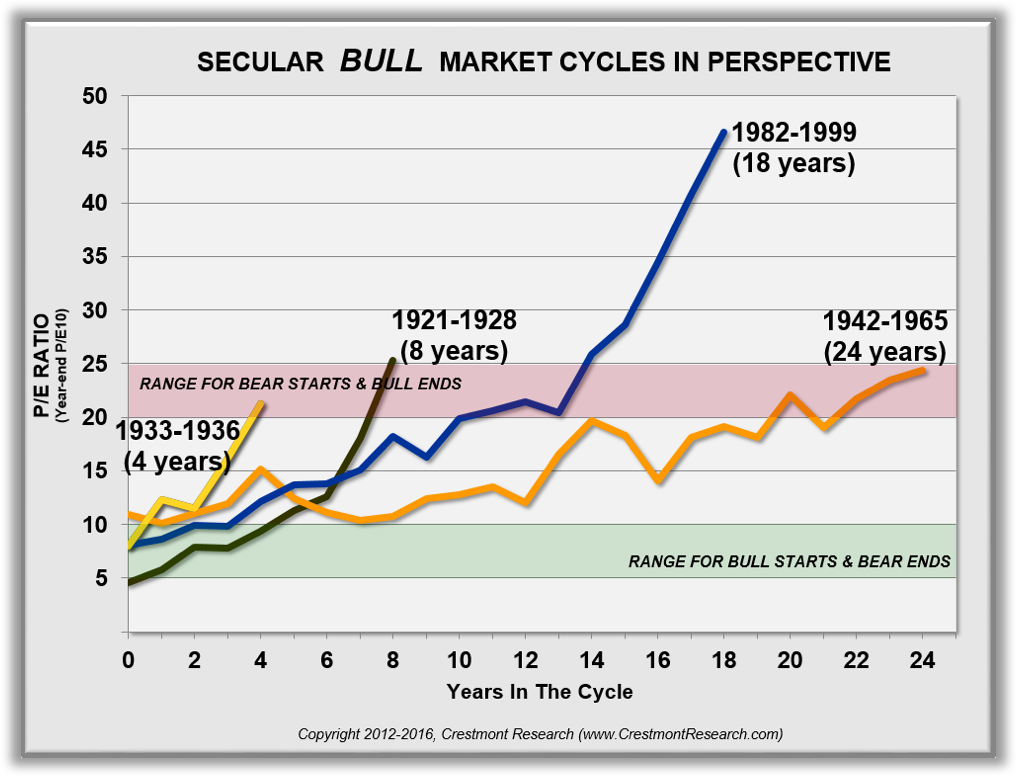
Figure 4 reflects the P/E ratio for each of the four secular bull markets since 1900. The level of P/E is on the left axis and the cycle length in years is on the bottom axis. Some secular bulls ran well less than a decade, while the others lasted near two decades.
Figure 4. Secular Bull Market Cycles in Perspective
Consistent with the principles of our previous discussion, all of the cycles reflect an increase from relatively low levels for P/E to much higher levels. All of these periods had an inflation rate that trended back to low levels from either higher inflation or deflation.
In the chart, note that for P/E the range from 5 to 10 has been shaded green. This has been the range for bull starts and bear ends. Also note that the range from 20 to 25 has been shaded red. This has been the range for bear starts and bull ends. There are mathematical reasons that P/E has typically peaked in the low- to mid-20s, yet we’ll save those details for a later discussion.
A key takeaway to note is that the most recent secular bull in the 1980s and ‘90s not only reached the red zone of bull ends, but P/E further ascended to bubble levels. Although investors during that secular bull realized incredible returns, there were consequences that followed.
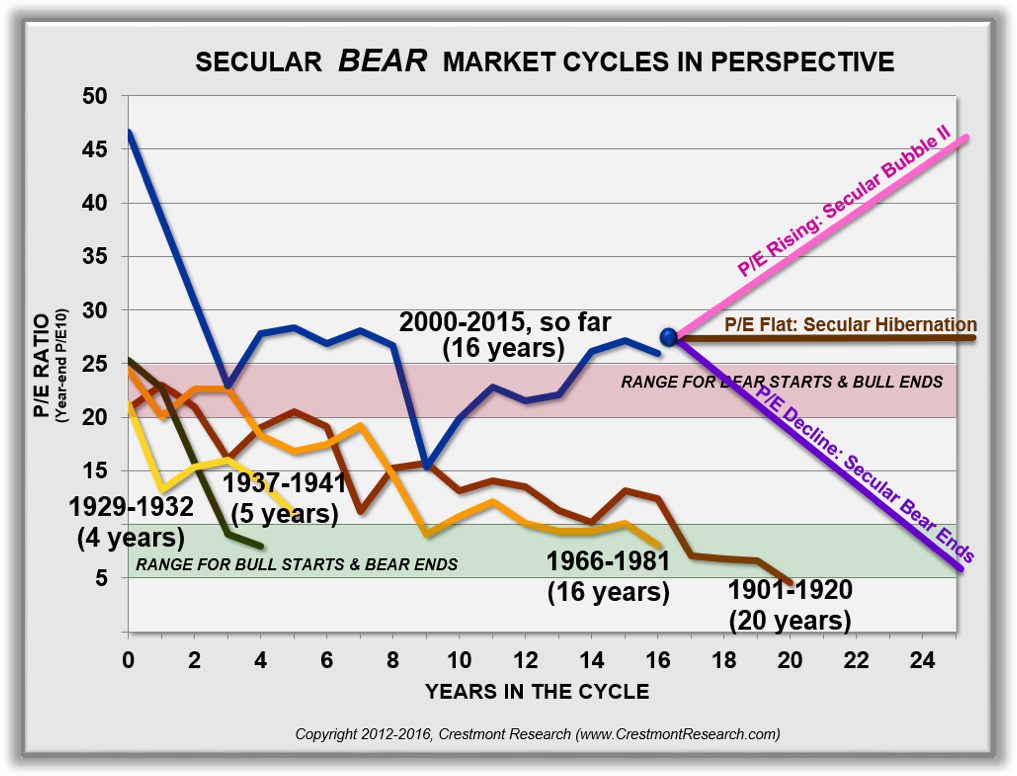
Figure 5 reflects the P/E ratio for each of the five secular bear markets since 1900. As in the bull cycle chart, some cycles were shorter, while others were longer. And like the bull cycle chart, start and end zones are designated with red and green.
Figure 5. Secular Bear Market Cycles in Perspective
Since bears start where bulls end, the current secular bear emerged at extremely lofty levels for P/E. Although the current secular bear has lasted for more than sixteen years, and many investors are hoping for an end soon, the stock market is currently above the range of bear starts! Keep in mind that there has been secular cycle progress; P/E has declined by nearly as many points as a typical secular bear—but this bear started at stratospheric levels.
A blue dot has been added to the chart to reflect the increase in P/E since the end of last year (the market is up 6%, more than earnings growth, thus an increase in P/E). In addition, the chart reflects three scenarios from here.
The first scenario is an increase in P/E to bubble levels. Although that would result in short-term gains for the market, a bubble-leg would serve only to set-up significant longer-term pain. Regardless, hope is not a strategy; and, it’s unclear whether rational investors should want another trek to valuation levels where the market’s air is too thin to breathe.
The second scenario reflects a flat line hibernation of P/E. As previously discussed, this scenario provides returns from only dividend yield and earnings growth. With dividend yield near 2% and economic growth (driving earnings growth) forecast to average near 4%, annualized stock market returns under this scenario would be indefinitely 5%-6%. Of course, investors should not expect a steady 6% each year. Returns would still come with dramatic multi-year cyclical bulls and bears. But, over time, this scenario generates cumulative returns at modest levels.
The third scenario is that P/E declines and ultimately completes this secular bear. Regardless of the number of years that it takes, the effect of the decline in P/E will be negative to total return. If this decline happens fairly quickly, say five years or less, the result would be negative annualized returns from the stock market. If the decline extends another decade or two, the negative effects would be stretched over time. That should still enable annualized returns be positive…but just barely positive. Regardless, under any scenario that completes this secular bear, total return from today will be well-below the optimistic hibernation scenario of 5%-6%.
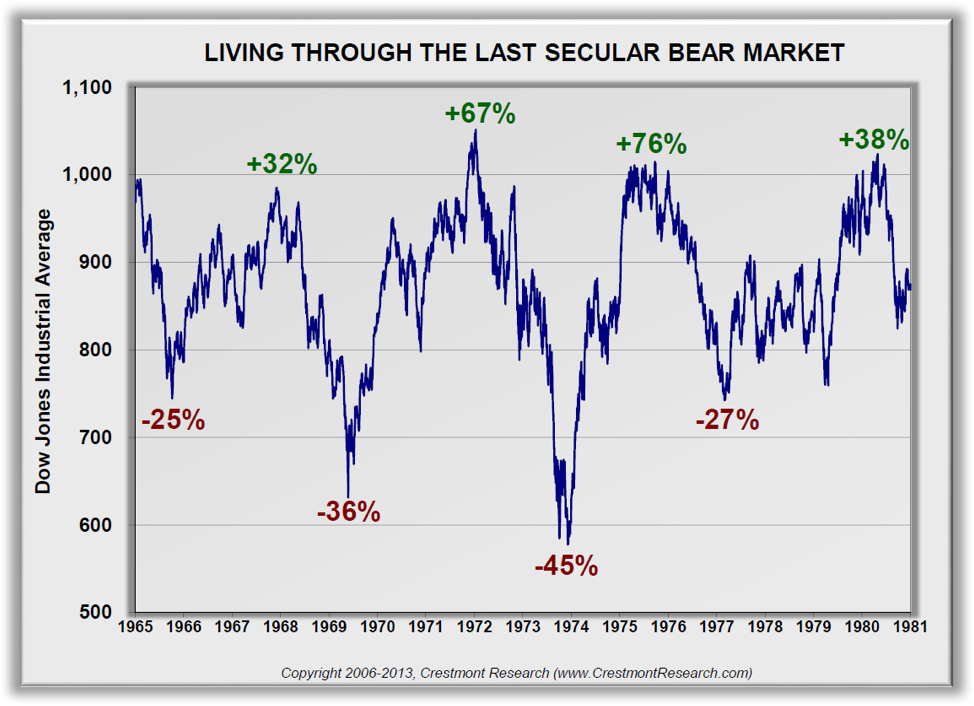
As described above, stock market returns during secular bears may look relatively flat and calm on long-term charts. However, secular bears include multiple short-term cyclical bull and bear cycles. Figure 6 presents the daily closing price across the last full secular bear market (1966-1981).
Note the dramatic swings from peak to trough and back again. Although the market index ended with minimal change over that sixteen years, as reflected in Figure 5, the market P/E progressed from the red zone of secular bear starts to the green zone of secular bear ends. The churn of cyclical market cycles over time enabled the secular bear cycle to revert market valuation from high P/E to low P/E, thereby enabling the secular bull market that followed in the 1980s and ‘90s.
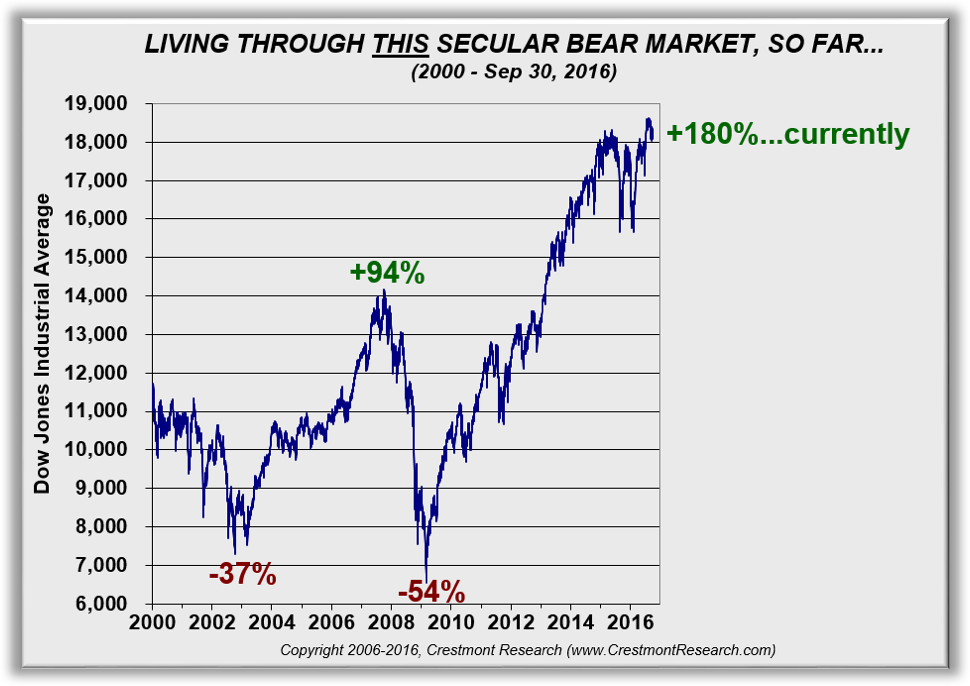
The past sixteen years have exhibited a pattern similar to the first half of the 1960s secular bear. The difference, as shown in Figure 7, is that the recovery from the last trough has more than exceeded typical cyclical bull runs in secular bear cycles. This has likely occurred because the Fed has thus far been successful at their stated goal of promoting stock market returns for the purpose of promoting a wealth effect to help drive economic growth. As a result, as shown in Figure 5, P/E is now above the red zone of secular bear starts. Investors may want to keep this in perspective as they position portfolios and develop expectations for future returns.
Figure 6. Living Through The Last Secular Bear Market
Figure 7. Living Through This Secular Bear Market…Thus Far
By the way, some analysts designate some or all of the market’s run since 2009 as a secular bull market. Crestmont maintains that the market’s surge is a cyclical bull in a secular bear. This is because the decline and recovery have occurred due to temporary factors and not due to secular forces. The decline and much of the recovery occurred due to market liquidity and investor psychology; the remainder of the gains have been driven by Fed actions and investor psychology. The market’s run has not been driven by the secular forces of a significant trend and change in the inflation rate.
Yet, regardless of how we characterize all or part of the past seven years, the market is now (and has been for several years) at valuation levels indicative of secular bear starts—far away from the conditions needed to sustain a secular bull.
SUMMARY & CONCLUSION
Currently, there is a host of market analysts describing the current environment as a secular bear market. They range across all three schools of thought.
There also is an expanding camp of analysts advocating the secular bull market case. None of the bulls support their call with mean reversion. Many of them support their case with chart patterns or time periods. Some of them seek to support their bull positions with economic outlooks, yet they generally include assumptions about one or more of the components of return that are unrealistic.
The level of valuation (P/E) for the stock market is relatively high. The market’s P/E is above 25 based upon reported earnings (i.e., GAAP earnings) as well as normalized earnings (e.g., CAPE P/E10 and Crestmont’s P/E). The historical average for both reported and normalized earnings is near 16.
P/E, based upon the more subjective operating earnings, is near 20. Even using forward, operating earnings, P/E is near 18. Keep in mind, as this graph shows, the historical average for P/E based upon forward, operating earnings is 12.
Every measure of the market’s P/E is relatively high when compared to its appropriate historical average.
Investors can expect total returns from the stock market over the next 5-10 years to be 0% to 6%. The upper end of the range represents the returns if this secular bear stays in hibernation. The lower end of the range assumes that the secular bear extends most of the next decade to complete its course.
Total return from the stock market is limited to (1) capital gains and (2) dividend yield. Capital gains consist of (a) earnings growth and (b) P/E change. As a result, there are only three components of return from the stock market.
Earnings growth cannot outrun economic growth over the longer-term. Almost all economists will agree and long-term historical data confirms that earnings growth for the overall stock market (e.g., S&P 500 Index) has actually been slightly lower than nominal GDP growth (which includes start-ups, fast growing small companies, etc.).
Nominal economic growth (nominal GDP) consists of real economic growth and inflation. Most economists and the Fed expect real GDP growth to be 2.0%-2.5% over full cycles including recessions. Further, most assumptions about the inflation rate, including the Fed’s target, fall in the range of 1%-2% annually. Nominal GDP growth of 4.5% (using the upper end of both ranges) would result in earnings growth for the S&P 500 Index near 4% over the longer-term.
At the current level of market P/E, the dividend yield for the S&P 500 Index is near 2%. Keep in mind that a change in valuation (P/E) in the future will enable new investments to get a higher yield, but current investments effectively lock-in today’s lower dividend yield.
As a result, the core return from the stock market is forecast to be 6%. The current level of market P/E leaves little room, if any, for an increase in P/E to increase that total return. Any trend downward for P/E will reduce total return. For example, a decline over the next decade to the green zone of secular bear ends would drive annualized returns negative. Even if the decline only gets to the historical average market P/E, it would leave investors with total annualized returns near 1%.
Given the relatively high level of P/E, the stock market is destined to deliver below-average returns. Of course, that does not mean that investors are destined to achieve below-average results. Further, this does not mean that all years will be below-average—quite to the contrary. Secular bear market periods present significant variability across the individual years. The current environment is an opportunity to use the rowing strategies of diversification, active management, or alternative strategies and investments to enhance portfolio returns. Passive, buy-and-hold sailing strategies will need to wait until P/E is again low enough to start the next secular bull market.
Ed Easterling is the author of Probable Outcomes: Secular Stock Market Insights and the award-winning Unexpected Returns: Understanding Secular Stock Market Cycles. He is currently president of an investment management and research firm. In addition, he previously served as an adjunct professor and taught the course on alternative investments and hedge funds for MBA students at SMU in Dallas, Texas. Mr. Easterling publishes provocative research and graphical analyses on the financial markets at www.CrestmontResearch.com.
© Crestmont Research