Brexit One Year Later, in Five Charts
Membership required
Membership is now required to use this feature. To learn more:
View Membership Benefits
One year ago today, British voters cast their ballots in favor of leaving the 28-member European Union, defying multiple opinion polls leading up to the Brexit referendum that said the “remain” camp would notch a narrow victory.
In a pre-Brexit Frank Talk last year, I wrote that Brexit would be regarded as the most consequential political event of 2016. President Donald Trump’s surprise election notwithstanding, I stand by my earlier comment.
Brexit, in fact, laid the groundwork for Trump. Both movements, described by many observers as populist and nationalistic, exposed an impatience and frustration with rampant bureaucracy, strangulating regulations, lax border security, political correctness and a sense of a loss of autonomy. “Take our country back!” and “We want our country back!” were the battle cries of supporters of Trump and Nigel Farage, then-leader of the UK Independence Party (UKIP).
EU membership has been nothing if not costly. As I shared with you last year, the U.K. is the third-largest net contributor to the Brussels-based bloc after Germany and France, paying the equivalent of between $11 billion and $14 billion every year. On top of that, the 100 most expensive EU regulations, passed down by unelected officials, are estimated to cost somewhere in the vicinity of 33.3 billion pounds, or $49 billion.
Although the British economy is showing signs of slowing down, the country has not contracted or imploded as many Brexit opponents had predicted. In fact, certain British sectors such as exports and manufacturing continue to expand.
Further Reading on Brexit:
Now that the “leave” camp has its country back, the hard work of negotiating a satisfactory departure from the EU, of which it has been a member for four decades, has begun. Talks are expected to last at least two years. In a closely-watched speech before the House of Lords this week, Queen Elizabeth II, attired in what many saw as a not-so-subtle EU flag-inspired gown and hat, said that her government’s priority “is to secure the best possible deal as the country leaves the European Union.”
|
|

That task, however, has recently been complicated by Prime Minister Theresa May’s humiliating loss of her government majority in the June 8 snap election. The disappointing outcome possibly signals waning public support for Brexit, which Brussels officials could very likely capitalize on and see as giving them increased leverage over making demands. A 100 billion pound exit fee, which has been hinted at, would be a decisive negotiation defeat.
What’s unclear at this point is what kind of Brexit the U.K. and the EU will pursue: a “hard” or “soft” exit. The former, favored by British nationalists, would strip the U.K. of all access to the single market and customs union. The country would effectively have full control of its borders and would also be required to assemble new trade deals from scratch.
A “soft” arrangement, on the other hand, would keep in place the country’s role in the European single market, meaning goods and services could still be traded tariff-free. As such, the U.K. would need to adhere to some basic rules involving the movement of goods, capital and people. Other European countries with similar arrangements include Iceland, Norway and Liechtenstein.
A piece in the Financial Times makes it clear that it’s this latter arrangement, the “soft” exit, that’s highly favored by British businesses of all sizes and from every sector. To be able to trade freely across borders without tariffs or other barriers, and to be able to hire skilled workers from the continent, would ensure that U.K. companies could remain competitive.
At this point, it’s really too early to tell which direction the two parties might take, but May’s crippling setback earlier this month will undoubtedly have a significant impact.
Below are five charts that illustrate where the U.K. has been in the 12 months following Brexit, both the good and bad—and where it could be headed next.
1. Stocks Head Higher
The benchmark British index, the FTSE 100 Index, has performed relatively well since last year’s referendum, despite skeptics’ pessimistic attitudes. Stocks have risen about 18 percent, even though they’ve trailed the Euro Stoxx 50, which has likely benefited from the euro’s rally since the start of the year.
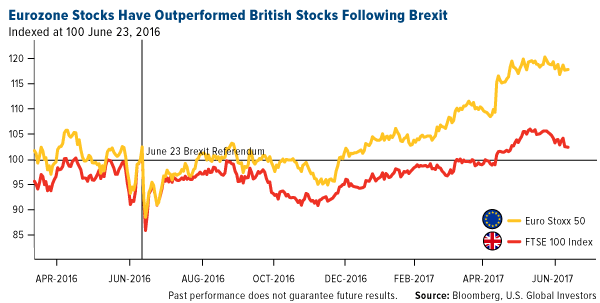
Working in the FTSE 100’s favor is the weaker British pound, which has contracted 13.5 percent against the U.S. dollar as of today. A weaker national currency gives exporters a more competitive advantage and helps boost corporate earnings.
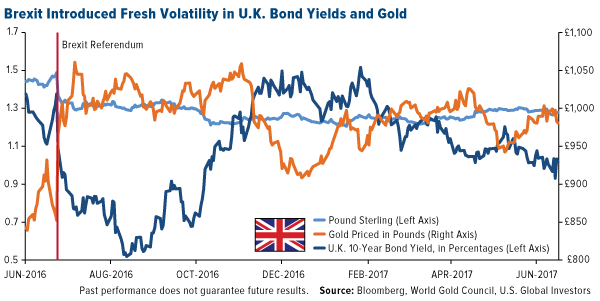
2. Gold Profits from Volatile Government Bonds
Also as a consequence of a weaker currency, gold priced in pounds is up close to 14 percent over the same period, from 861.2 pounds to 980.6 pounds. Supporting the yellow metal is low government bond yields, with nominal yields decaying to nearly 0.5 percent in August and September of last year.
3. Economic Growth Stalls
GDP growth in the U.K. was worse than expected in the first quarter of 2017, gaining only 0.2 percent, its weakest showing in 12 months. The eurozone, by comparison, rose 0.5 percent in the March quarter.
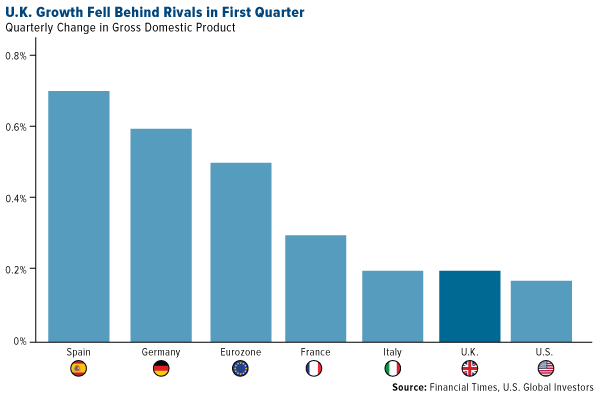
CBI, the U.K.’s top business organization, recently announced expectations that the country’s economy will slow in the coming years. The group sees the U.K. growing at a weak 1.6 percent this year and 1.4 percent in 2018, with “domestic political turmoil” mostly to blame. Strength in manufacturing and exports could be tempered by higher-than-expected inflation and low wage growth.
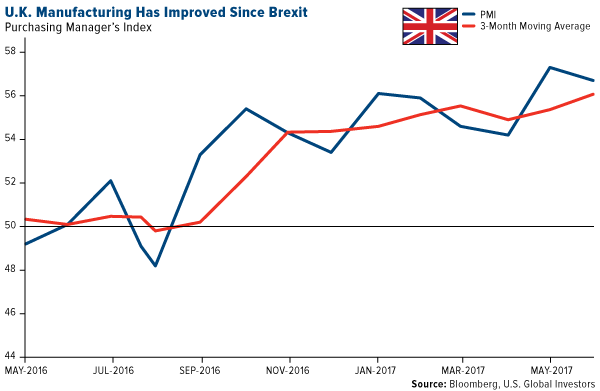
Many naysayers of the U.K. leaving the EU said demand for British-made goods would crumble, but the reverse has happened. The manufacturing sector remained strong and resilient in May, the most recent date of available data, with the PMI posting a 56.7. Output and new orders were strong, and job creation—its rate was positive for a straight 10 months—stood at a 35-month high, according to IHS Markit. What’s more, a survey of manufacturers found that 56 percent expected conditions to improve during the next 12 months.
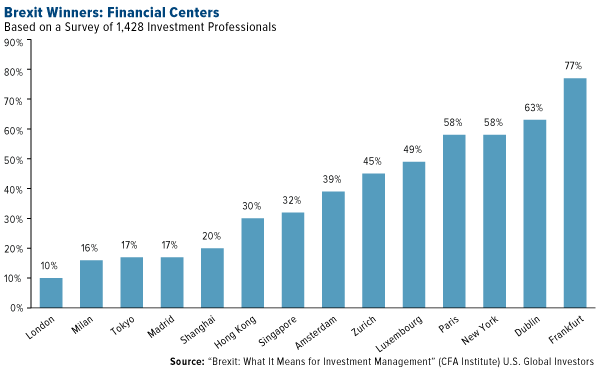
5. Financial Trouble Brewing?
Manufacturing might be looking good, but the financial sector is preparing for the worst. A survey conducted recently by the CFA Institute found that 70 percent of respondents said Brexit has deteriorated competitiveness of the market. Troublingly, 57 percent said they thought financial institutions based primarily in the U.K. would eventually reduce their presence in the U.K. because of added uncertainty. And when asked which world cities were poised to benefit from Brexit, participants placed London last at only 10 percent. Frankfurt, Dublin and New York topped the list of cities expected to benefit from financial professionals relocating from the U.K., should the country lose access to the single market.
A similar study conducted by financial consultancy firm Synechron found that, were the U.K. to leave the European single market, giant financial services firms with a presence in the U.K. could face some steep departures. JP Morgan Chase could lose up to 1,000 personnel; Morgan Stanley, 1,250; Bank of America, 1,386; Goldman Sachs, 1,603; and Citigroup, 2,000.
Again, we’re too early in the divorce process to make any firm predictions. We could be looking at two long years that hopefully aren’t as grueling and messy as some people fear.
- The major market indices finished up this week. The Dow Jones Industrial Average gained 0.05 percent. The S&P 500 Stock Index rose 0.21 percent, while the Nasdaq Composite rose 1.84 percent. The Russell 2000 small capitalization index gained 0.64 percent this week.
- The Hang Seng Composite rose 0.54 percent this week; while Taiwan was up 2.18 percent and the KOSPI rose 0.71 percent.
- The 10-year Treasury bond yield fell slightly to 2.14 percent.
Domestic Equity Market
Strengths
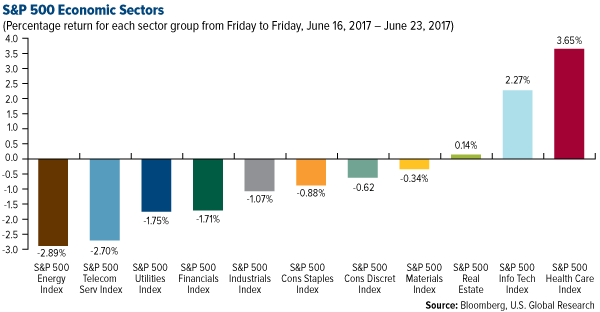
- Healthcare was the best performing sector of the week, increasing by 3.65 percent versus an overall increase of 0.21 percent for the S&P 500.
- Advanced Micro Devices was the best performing stock for the week, increasing 23.86 percent.
- Oracle crushed its earnings report. The company earned an adjusted $0.89 a share on adjusted revenue of $10.94 billion, both much higher than estimates.
Weaknesses
- Energy was the worst performing sector for the week, falling 2.89 percent versus an overall increase of 0.21 percent for the S&P 500.
- Bed Bath & Beyond was the worst performing stock for the week, falling 16.08 percent.
- Bed Bath & Beyond plunged after missing marks across the board. The company’s earnings, revenue, and same-store sales all fell short of Wall Street expectations.
Opportunities
- One of the oldest stock market indicators is flashing a buy signal. The measure, known as Dow Theory, sends a bullish signal when transportation and industrial stocks make new 52-week highs simultaneously. This happened back in October and nothing has derailed its course despite the naysayers.
- Nvidia is getting a lift from the rally in one of the hottest cryptocurrencies. The stock has been getting a big boost from ethereum, which has seen about $100 million worth of GPUs added to its network in just 11 days.
- Morgan Stanley said Microsoft shares could jump 46 percent over the course of the next year. Analysts pointed to rising earnings and Microsoft's expanding cloud business.
Threats
- Mizuho Securities sees conditions that are ripe for a market decline of 10 percent or more. The company’s biggest concern is that stocks are expensive, especially when compared to the rate of U.S. economic growth and corporate profitability. This will be exacerbated as the yield curve flattens amid faltering inflation. Also worrisome to the firm is the historically low volatility in the market, which is sitting close to 50-year lows.
- Chipotle warned that it's spending more on marketing to lure customers after the food-safety crisis. The company said marketing and promotion costs were expected to be up by 20 to 30 basis points on a quarter-over-quarter basis.
- Macquarie warned that Chesapeake is expected to "materially" outspend its cash flows, which is bad news given the company's already high leverage. Macquarie is concerned about Chesapeake's liquidity if it continues to spend money it doesn't have, in an effort to extract oil and gas that’s worth much less than it used to be.
Strengths
- Sales of new homes rebounded in May, and government data was revised upward to show a stronger spring selling season than had been previously reported. New home sales ran at a seasonally-adjusted annual rate of 610,000, the Commerce Department said Friday. That was 2.9 percent higher than in April and 8.9 percent higher than a year ago. It was also higher than the forecasts of a 590,000.
- The biggest U.S. banks passed the first round of stress tests. As such, the 34 biggest U.S. banks all would have enough capital to withstand an extreme recession, according to the results of the first round of the Federal Reserve's annual stress tests.
- Bloomberg’s Economic Expectations Index for June came in at 52, above the previous month’s 49.5
Weaknesses
- The preliminary Markit U.S. Manufacturing PMI for June came in at 52.1, lower than the expected 53.0.
- Citigroup's Economic Surprise Index, a widely followed indicator of how the data are matching up to expectations, continues to fall to new lows. The index hasn't been this low since August 2011, when the White House and Congress brought the country to the brink of a debt default, economists were worried about a double-dip recession, and the European debt crisis was in full swing.
- The New York Fed revised its second-quarter economic growth estimate lower to 1.9 percent from 2.3 percent.
Opportunities
- The durable goods orders report on Monday will tell if business investment is rebounding.
- Wednesday's consumer confidence survey and Friday's personal income/spending data should paint a fairly healthy picture of the household sector.
- Paul Ryan said the GOP's tax reform bill will be passed by the end of the year. While he did not offer any new details on the plan, he reiterated Republicans' commitment to seeing the bill through this year. Tax cuts have been Wall Street’s focus from the government’s policy as they are likely to boost corporate profits.
Threats
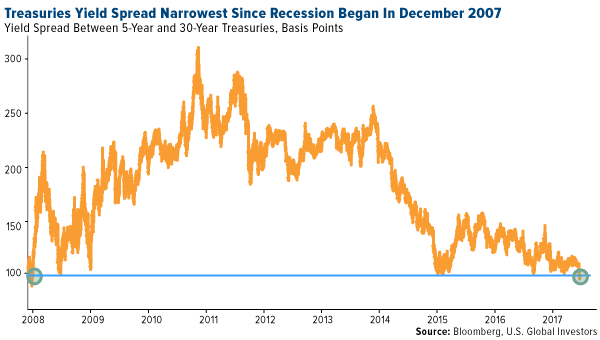
- The difference in yield between 5-year and 30-year Treasuries has fallen below 1 percent, the narrowest since December 2007. Shorter-term U.S. debt has underperformed as Federal Reserve officials reiterate plans to stick to their path of rate hikes, even as inflation expectations fall.
- According to Citigroup, now is an opportune time to short municipal bonds. The firm deems the Markit MCDX Index as an attractive tool to short municipal bond fundamentals. Currently, the index is not reflecting the deterioration of Illinois and Chicago.
- The head of fixed income strategy at Nomura Securities International is urging investors to underweight duration. He cited the Fed’s plan to reduce its bond holdings as a pivotal point that will send 10-year yields higher.
This week spot gold closed at $1,256.75, up $3.10 per ounce, or 0.25 percent. Gold stocks, as measured by the NYSE Arca Gold Miners Index, ended the week higher by 3.51 percent. Junior-tiered stocks underperformed seniors for the week, as the S&P/TSX Venture Index rose only 0.17 percent. The U.S. Trade-Weighted Dollar Index finished the week slightly higher by 0.14 percent.
| Date | Event | Survey | Actual | Prior |
|---|---|---|---|---|
| Jun-22 | Initial Jobless Claims | 240k | 241k | 238k |
| Jun-23 | New Home Sales | 590k | 610k | 593k |
| Jun-26 | Hong Kong Exports YoY | 7.7% | -- | 7.1% |
| Jun-26 | Durable Goods Orders | -0.6% | -- | -0.8% |
| Jun-27 | Conf. Board Consumer Confidence | 116.0 | -- | 117.9 |
| Jun-29 | Germany CPI YoY | 1.4% | -- | 1.5% |
| Jun-29 | U.S. GDP Annualized QoQ | 1.2% | -- | 1.2% |
| Jun-29 | Initial Jobless Claims | 240k | -- | 241k |
| Jun-30 | Eurozone CPI Core YoY | 1.0% | -- | 0.9% |
Strengths
- The best performing precious metal for the week was gold, up 0.25 percent. In the weekly survey of gold traders, Bloomberg reports the majority are bullish, for the first time in three weeks. The gold price has recovered from a one-month low.
- Bloomberg reports rising gold imports in many of the key markets. Swiss gold exports rose 39 percent month-over-month in May, with an increase of 40 percent to India and 70 percent more going to Hong Kong. The exports are the most since December 2016.
- Fed fund futures data show that traders are anticipating a 43 percent chance of a rate hike by December. The lower expectations for a rate hike reflect the dampening of the equity bull market, reflected by more assets going into gold. In addition, oil’s price decline to below $45 per barrel has correlated with gold demand. European equities have also dropped, spurring more haven demand for gold.
Weaknesses
- The worst performing precious metal for the week was palladium, down 1.13 percent, perhaps as weaker economic data indicates some loss of momentum. More notable perhaps is the gold-to-silver ratio, which is at the highest level in over a year. Gold hasn’t changed much in the second quarter, while the silver price has dropped 9 percent. Bloomberg reports that some traders look to this ratio as a sign to sell gold and buy silver, since the ratio of 75 is above the 10-year average of 62.5.
- Shareholders of the gold mining company formerly known as Peter Hambro Mining Plc (now Petropavlovsk Plc) have voted out the chairman and founder Peter Hambro, due to complaints of poor performance. Hambro, age 72, says he will still be in the mining business.
- An article posted by Seeking Alpha notes that IAMGold is overstating the economics of their Cote Gold project. The acquisition cost of the project was $508 million. However, none of the company’s published net present value (NPV) or internal rate of return (IRR) statements have taken into account this sunk cost. The author claims that the actual NPV and IRR are merely a fraction of what IAMGold is stating.
Opportunities
- The Hong Kong exchange is introducing gold futures, to be denominated in renminbi and the U.S. dollar, on July 10. The futures will be the first commodity futures that can be physically delivered in Hong Kong, differentiating them from other commodity futures. The Hong Kong exchange will waive the trading and settlement fees and exempt commission levies for the first six months of trading to promote the launch of the new products.
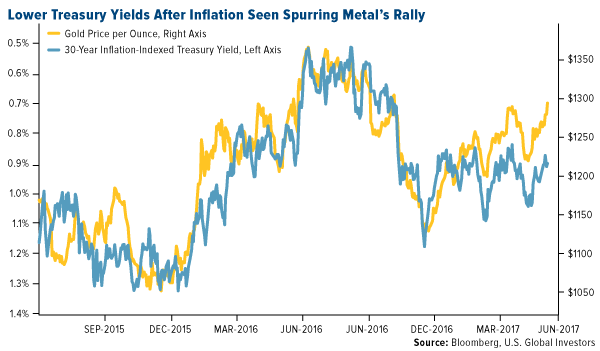
- Bloomberg reports that falling bond yields are fueling gold’s climb. Neil Dutta, head of U.S. economics at Renaissance Macro Research LLC, states, “The opportunity cost of holding a non-interest-bearing asset is lower.” Even with all the talk of interest rate hikes starting in December 2015, the price of gold has climbed 18 percent. And Georgette Boele, a currency strategist at ABM Amro Bank NV in Amstardam, says that gold will edge higher toward $1,300 later in the year.
- Klondex is still finding silver linings in events of the recent months. The company reported just less than 300,000 ounces at 16.8 grams per tonne of initial gold resource at the Gloria zone of the Hollister mine. But investors are have higher interest in the Hatter Graben vein system, where drilling has just been initiated. Klondex’s stock price had been knocked down earlier this year after it was required to switch from IFRS accounting to U.S. GAAP, making the last quarter look like an earnings miss. And then later it was impacted again as a result of the dramatic rebalance of the GDXJ. Now the stock has rallied 23 percent over the last three weeks with the index rebalancing out of the way. Klondex still trades at roughly a 50 percent discount on 2018 P/CF at 4.0x vs. peers at 7.7x. Management has an excellent track record and is one of a small handful of gold stocks that have delivered a positive return on invested capital since going into to production.
- Central banks are watching oil’s decline. Bloomberg reports that weak crude oil and other commodity prices mean that inflation will continue to be weak. In this environment, the central banks will be less likely to raise rates; however, inflation is typically identified as a driver for gold prices.
- The situation in Tanzania is escalating, after President John Magufuli’s attempts to reform the mining industry, and accusations of tax evasion by Acacia Mining. More than 500 people, residents of the villages surrounding Acacia’s North Mara gold mine, invaded the mine and attempted to steal gold ore. Security forces arrested 66.
- Arvind Sanger, managing partner at Geosphere Capital, said that equities will continue to be favored in India over traditional stores of value like gold and real estate.
Energy and Natural Resources Market
Strengths
- Nickel was the best performing commodity this week rallying 2.75 percent. Nickel prices rallied on the back of expanding positions by speculators, supported by a rising demand from alloy makers in Asia, according to the Economic Times of India.
- The best performing sector this week was the S&P/TSX Composite Diversified Metals and Mining Sub Industry Index. The index rose 8.29 percent on the back of risk-on sentiment and rallying base metal prices.
- Thyssenkrupp AG, A German multinational conglomerate, was the best performing stock this week finishing up 7.63 percent. The company rallied on the back of a positive news release stating that it is planning to cut costs worth at least $112 million to meet financial targets.
Weaknesses
- Crude oil was the worst performing commodity this week dropping 6.57 percent. Crude oil officially entered into bear market territory this week, down over 20 percent from its highs this year, as concerns surrounding OPEC-led output cuts won’t succeed in rebalancing the market. In a Reuter’s article, Gene McGillian, Manager of Market Research at Tradition Energy, stated that given the expectation of higher production in several areas of the world, this will negatively affect all efforts put forth by OPEC’s curbs to reduce production that’s currently flooding the market.
- The worst performing sector this week was the S&P Super Composite Oil & Gas Equipment & Services Sub Industry Index. The index fell 4.81 percent on the back of falling oil prices this week.
- The worst performing stock for the week was Fibria Celulose SA, a pulp and paper company headquartered in Brazil. The company fell 9.4 percent on the back of negative investor sentiment.
Opportunities
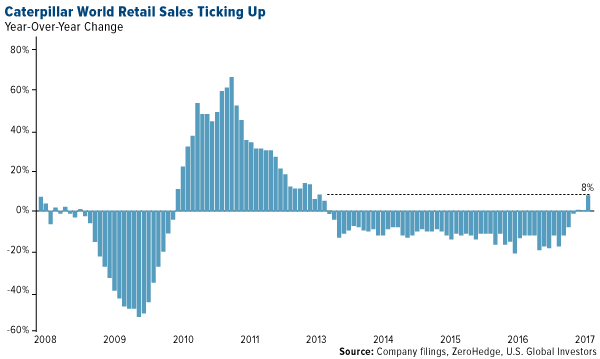
- Caterpillar retail sales rose the most in 54 months, according to Zero Hedge. After a record 51 consecutive months of annual declines, the company has officially ended its great depression where global sales grew by 1 percent on the back of a surge from China and Asia sales. For the month of May, construction activity in China increased 11 percent after rising 8 percent in April, both of which have helped contribute to increasing purchase orders from the machinery company.
- Oil market fundamentals are heading in the right direction, according to Saudi Energy Minister Khalid al-Falih in Reuters. Despite oil’s tumultuous week, al-Falih stated that market fundamentals are going in the right direction, but in light of a large surplus in stockpiles over the past years, the cut needs time to take effect. In addition, he stated that current expectations indicate the market will rebalance in the fourth quarter of this year and short-term volatility is mostly a reaction to short-term factors such as speculation.
- Demand from China and the electric car battery market could boost nickel prices, according to the Financial Times. Nickel prices have been beaten down hard, since 2014 the price of the commodity has halved in price; however, the metal’s fundamentals are beginning to improve. According to Goldman Sachs, demand for the metal out of China is estimated to grow by 6 percent annually over the next two years on the back of a crackdown to reduce environmental hazards from the use of pig iron in blast furnaces to separate out nickel. In addition, from battery demand from the makers of new electric cars which are expected to come online in the coming years.
Threats
- South African mining stocks crash to 5-year low valuations after a policy shock, according to Zero Hedge this week. The department of Mineral Resources in South Africa released a newly revised charter this week stating that all local mines should be 30 percent black owned which shook investors across the board. As a result, the average price-to-earnings ratio of the country’s miners has fallen to the lowest level in five years. HSBC stated that mining stocks in South Africa will become non-investable if the new regulations are executed in the current form of the revised charter.
- Corn futures fizzled under heavy supply, according to Reuters. After an 11-day buying rally, corn futures have started to pull back as money managers piled into 200,981 short contracts creating a net short position overall. Over the past decade, funds have been net short corn futures during summer months only twice.
- U.S. PMI’s tumbled to nine-month lows, according to Zero Hedge. U.S. PMI’s collapsed this week falling down to 13-month lows following China’s disappointing drop in PMI’s last week. According to Chris Williamson, Chief Business Economist at HIS Market, the economy ended the second quarter on a softer note where weak PMI’s in June indicate the second weakest expansion of business activity since last September. A negative read-through for raw material demand.
Strengths
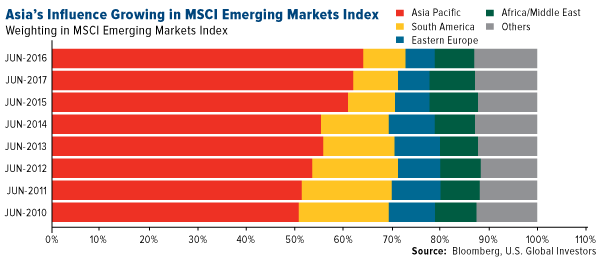
- After years of rejecting China’s A-shares for Emerging Markets Index inclusion, this week MSCI’s Index Policy Committee announced that China’s domestic equities will now qualify for its index inclusion beginning in 2018. The historic announcement means a larger potential role for China’s equities in investor portfolios around the world, from 401(k)s to ETFs, even though initially the Chinese market will only comprise about 0.7 percent of the MSCI Emerging Markets Index. Notably, inclusion also means continued internationalization of China’s currency, which last year achieved reserve currency status in the International Monetary Fund’s Special Drawing Rights (SDR) basket.
- Taiwan’s year-over-year export orders jumped to a 9.1 percent growth rate in May, ahead of analysts’ expectations for 7.5 and up from April’s 7.4.
- On another positive note for Taiwan, the country’s TWSE Index closed up 2.22 percent for the week, the top gainer among regional indices.
Weaknesses
- Malaysia’s FTSE Bursa Malaysia KLCI Index finished down 66 basis points for the week. Singapore’s Straits Times Total Return Index fell 68 basis points in the same timeframe.
- The People’s Bank of China (PBOC) guided the daily yuan (CNY) fixing weaker over the last five trading days, leaving the CNY at a 6.8366, weaker than from last Friday’s 6.8105.
- Singapore’s year-over-year industrial production fell to 5.0 percent, down from 6.7 percent in April and below analysts’ expectations for a 7.5 percent showing.
Opportunities
- Hong Kong Exchanges & Clearing Ltd. announced an intention to overhaul some of its listing policies to accommodate startup companies and pre-profit growth firms, as Hong Kong seeks to win more listing business and remain competitive.
- Bloomberg reported this week on statements made by PBOC Governor Zhou Xiaochuan at a Shanghai Forum this week. Zhou explained that the Chinese financial services sector needs to continue to be opened up and made transparent. In so doing, Zhou argued, the sector will be strengthened.
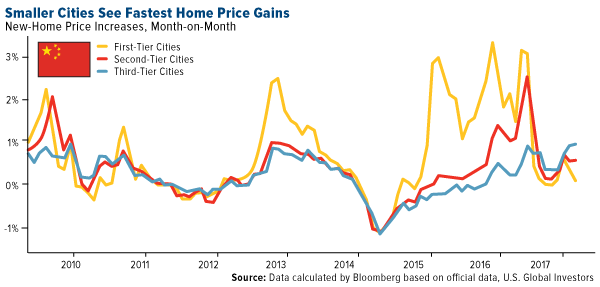
- Due to cooling measures by local authorities, China’s home prices increased in fewer cities last month, reports Bloomberg. However, official data from Monday showed the fastest price gains were across smaller cities. As seen in the chart below, new-home values jumped the most in almost eight years in third-tier cities, while prices were essentially unchanged on average across the bigger cities of Beijing, Shanghai and Shenzhen.
Threats
- North Korea remains a hot topic this week after the release and sad subsequent death of young Otto Warmbier. As South Korea’s President Moon Jae-in travels to the U.S. next week, and in light of additional missile testing by North Korea, one expects that Pyongyang will be high on the list of topics under consideration by presidents Moon and Trump.
- To be sure, China’s historic MSCI inclusion is a significant milestone, as indeed was the renminbi’s SDR basket inclusion, announced last year. But as with SDR inclusion, expectations will be higher for China going forward. As a succinct title of a Bloomberg article this week summed up the situation: “China’s MSCI Induction Puts Onus Back on Xi’s Market Reformers.” China will need to continue to deliver.
- This week Chinese regulators have asked some lenders to provide information on overseas loans made to finance certain foreign acquisitions, singling out some deals by companies like Fosun International Ltd. and Dalian Wanda Group for close scrutiny. Chinese companies’ overseas spending spree—which hit as much as $310 billion since the start of 2016—may get tamped down if the deals are not favored by regulators.
Strengths
- Russia was the best performing country this week, up 2.44 percent.
- Romania’s leu was the best performing currency this week, up 27 basis points after the ouster of Prime Minister Sorin Grindeanu. The prospect for talks on Monday to form a new government, and the commitment of President Klaus Iohannis to resolve the political crisis swiftly, have helped the currency, according to ING Group NV.
- The industrials sector was the best performing sector among eastern European markets this week.
Weaknesses
- Romania was the worst performing country this week, down 1.42 percent. Romania’s governing coalition toppled its own prime minister after he clashed with the leader of the ruling party, paving the way for a new cabinet just six months after elections. This is the latest bout of political turmoil in Romania, which has had 13 prime ministers in 27 years.
- The Russian ruble was the weakest performing currency this week, down 3.20 percent against the U.S. dollar. The ruble retreated to the weakest level in three months, succumbing to lower oil prices and broadened U.S. sanctions.
- The healthcare sector was the worst performing sector among eastern European markets this week.
Opportunities
- Consumer confidence improved again in the euro area in June, with levels rising further above long-term averages. The index rose to minus 1.3 from a previous minus 3.3, while the median estimate of economists surveyed by Bloomberg News centered on minus 3. Lower oil prices and ever-improving labor market conditions are helping lift the consumer mood. BI Economics expects household spending to continue, contributing positively to the region’s expansion in coming quarters.
- The Polish economy continues to grow at an annual rate of near 4 percent this quarter, as suggested by the May retail sales and industrial output data. According to MBank analyst fiscal year growth will slightly exceed 4 percent, driven by public investments recovery and persistently strong consumption. The real retail sales growth in the second quarter seems to be holding close to the prior-quarter level, which means that consumption growth should remain at around 5 percent, MBank estimates.
- Hungary’s government is considering whether to lower personal income taxes to 10 percent from the current 15 percent. This will be a major boost to disposal income of Hungarians which is already rising at a breathtaking pace (wage growth in April: 14.6 percent).
Threats
- As political parties in Prague prepare for parliamentary elections in October, some EU capitals feel that the Czech Republic, despite having “returned to Europe”, now has one foot outside the door again. One concern is Czech opposition to EU-prescribed national quotas for asylum-seekers. Another concern is public indifference to the EU. A third concern relates to the pro-Russian sympathies of Milos Zeman, who also betrays a soft spot for Donald Trump. Lastly, Western Europe is waking up to the possibility that Andrej Babis will win October’s elections and become prime minister.
- Brent crude prices have fallen more than 13 percent so far this quarter, hurting sentiment toward Russian assets. The Russian ruble slumped to the lowest level in four-and-a-half months against the dollar, heading for the worst three-day loss since February 2016, as global oil prices fell. The return of geopolitical tensions and strengthening of U.S. sanctions added to the weakness driven by falling oil. Russia’s revenues are at risk as the ruble’s drop lags oil’s slide.
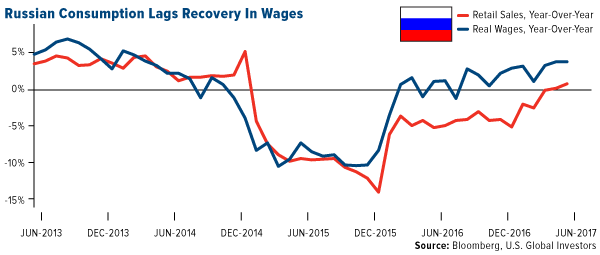
- While Russia’s real wages grew at the same pace of 3.7 percent in April and May, the most in over three years, retail sales only crawled just above zero after a record 27 months of contraction. The Bank of Russia expects consumers to stay similarly cautious for another two to three years. This explains why the central bank believes risks to inflation have declined in the short term. Even as Governor Elvira Nabiullina said a rebound in consumption is becoming “more pronounced,” policy makers last week delivered this year’s third straight decrease in interest rates. Under the central bank’s baseline scenario, final consumption by households won’t grow faster than real wages until 2019-2020
© US Global Investors
Membership required
Membership is now required to use this feature. To learn more:
View Membership Benefits