Storm Advisory—What You Need to Know Now
Membership required
Membership is now required to use this feature. To learn more:
View Membership Benefits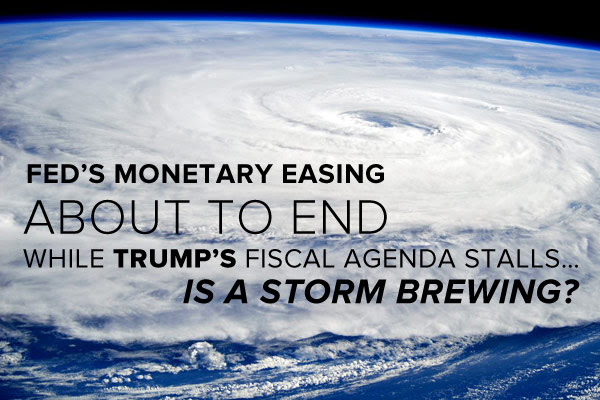
In July, the Institute for Supply Management’s (ISM) Non-Manufacturing Index fell to an 11-month low of 53.9, 3.5 points below its June reading of 57.4. The index measures the non-manufacturing, services industries such as food services, education, real estate, health care and more.
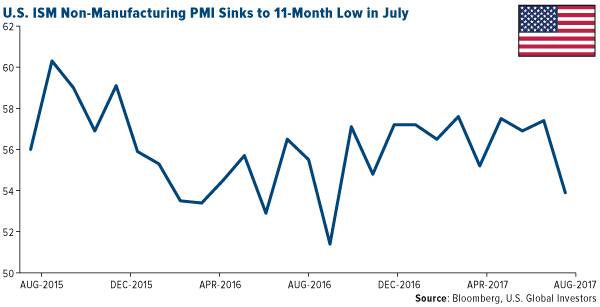
Economists had expected a reading closer to 56.9, so it’s safe to call this a disappointment. Although the index is still above the key 50 threshold, where it’s held for 91 straight months now, the slowdown suggests that “the economy may have lost some momentum going into the third quarter,” as Capital Economics’ Andrew Hunter said in a note this week.
Following this report, it’s possible we’ll see the U.S. dollar rally before pulling back even further. Having hit a 15-month low this week, the dollar looks oversold and ready for a “retracement,” as CLSA’s Christopher Wood put it.
“It remains remarkable how weak the dollar has been so far this year given the Fed’s surprisingly hawkish rhetoric and given that its latest statement last week still suggests that the American central bank intends to commence balance sheet contraction next quarter,” Wood wrote in the latest “GREED and fear.”

I’ll have more to add on the Fed’s balance sheet later.
July was the dollar’s fifth consecutive month of losses, the longest such stretch since December 2010 through April 2011. As I said in a Frank Talk this week, the major contributing factor to the greenback’s slide is political uncertainty surrounding President Donald Trump and Congress. Not only did the Obamacare repeal and replace bill fail (again), but Trump’s White House continues to look like a revolving-door workplace, with the foul-mouthed Anthony Scaramucci pushed out as communications director this week after only 10 days on the job. This reportedly came at the urging of brand new chief of staff John Kelly, who replaced Reince Priebus last week.
But it’s no secret that Trump favors a weaker currency. Since he declared that the dollar was “getting too strong” back in April, it’s lost close to 8 percent of its value against a basket of several other currencies. Add to this the disappointing ISM report, weakening automobile sales and slightly lower-than-hoped-for GDP growth in the second quarter, and it seems less and less likely we’ll see more than one additional rate hike in 2017.
Economic Growth Revised Down
Today the Labor Department announced the U.S. economy added a robust 209,000 jobs in July, beating the consensus, while the unemployment rate dropped even further to a 16-year low of 4.3 percent.
Wage growth, however, remained pretty flat, which is a concern. Consumption is the number one driver of economic growth in the U.S., and if American workers aren’t getting raises, they’re not spending more.
All of this is spurring some economists to rethink their U.S. growth estimates. In its World Economic Outlook for July, the International Monetary Fund (IMF) revised down its domestic economic growth forecast, from 2.3 percent to 2.1 percent in 2017, and from 2.5 percent to 2.1 percent in 2018. The Washington-based fund attributes this revision to “the assumption that fiscal policy will be less expansionary than previously assumed, given the uncertainty about the timing and nature of U.S. fiscal policy changes.”
IMF economists, in other words, have doubts that tax reform, deregulation or an infrastructure package will be coming anytime soon.
We’ll see if they’re right. After the August recess, Congress plans to tackle tax reform, which the U.S. sorely needs. I hope lawmakers can come together and pass a comprehensive bill this fall that will deliver some relief to American workers, families and corporations.
Fed to Take Away the Punchbowl
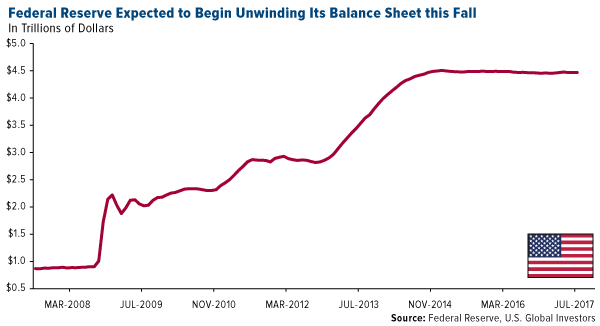
Big changes could be coming on the monetary side this fall as well. In an address to the Economic Club of Las Vegas this week, President and CEO of the Federal Reserve Bank of San Francisco John Williams said the Fed will likely begin the process of monetary normalization as soon as next quarter. This includes unwinding the Fed’s $4.5 trillion balance sheet, composed of long-term Treasuries and mortgage-backed securities (MBS). The process could take up to four years to complete.
Now that “we’ve finally recovered from the recession,” Williams said, it’s time for the private and public sectors to “step up and take the lead in making the investments and enacting policies needed to improve the longer-term prospects of our economy and society.”
I agree 100 percent. For nearly 10 years now we’ve seen an imbalance in monetary and fiscal policies, with the economy and stock market being propped up by cheap credit.
There’s a historical risk in the Fed reducing its balance sheet, though. The central bank has embarked on this reduction six times in the past—in 1921-1922, 1928-1930, 1937, 1941, 1948-1950 and 2000—and all but one episode ended in recession.
That’s according to research firm MKM Partners, whose chief economist, Mike Darda, urged attendees of a Fidelity event in May to hope for the best but prepare for the worst.
|
|
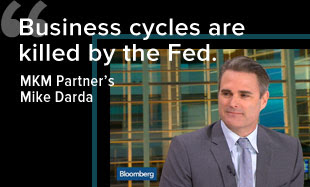
“My opinion is that business cycles don’t just end accidentally,” Darda said. “They are killed by the Fed. If the Fed tightens enough to induce a recession, that’s the end of the business cycle.”
So how can investors prepare?
“Obviously, diversification is important,” Darda said, highlighting municipal bonds and emerging markets. “But my focus there would be on the commodity-importing emerging markets.”
Fidelity’s Julian Potenza seconded Darda’s emphasis of muni bonds, saying “investors should consider keeping the portion of their fixed-income portfolio that is currently earmarked for liquidity relatively short, in terms of duration.”
Indeed, shorter-duration, tax-free munis have a history of delivering positive returns even during economic downturns and in environments of rising and lowering interest rates.
As for emerging markets, CLSA reported this week that international ETF inflows so far this year are outpacing domestic U.S. ETF inflows, $103 billion to $86 billion. The brokerage and investment firm recommended an overweight position in emerging markets, specifically Europe ex-U.K.
Tech Stocks a Third of Market Gains in 2017
For the second quarter, close to a record 75 percent of S&P 500 Index companies are beating not just sales estimates but also earnings per share (EPS) estimates, according to FactSet data. What’s more, they’re beating these estimates by wider margins than historical second-quarter averages.
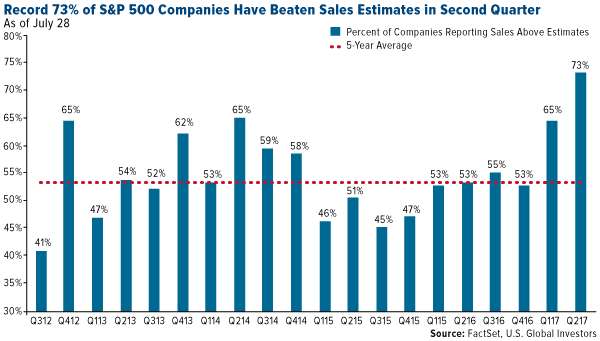
Granted, only around 60 percent of companies have reported as of this writing, but the news is impressive nonetheless.
How much of this is due to euphoria over Trump’s pro-growth fiscal agenda, and how much to a weakening U.S. dollar? That’s difficult to say, but no one can argue the fact that American multinationals are benefiting from a weaker dollar, which makes their exports more competitive globally. Apple, which generated 61 percent of its revenue from foreign markets in the second quarter, just reported an all-time quarterly services revenue record. “Services,” which includes Apple Music, iTunes, iCloud and Apple Pay, brought in an astounding $7.3 billion, up from $6 billion during the same quarter last year.
Speaking of Apple, it’s one of only five U.S. stocks that, together, are responsible for a third of the market’s gains in 2017, the other four being Amazon, Facebook, Microsoft and Alphabet (Google). As you can see below, information technology is up close to 22 percent year-to-date, followed by health care at 15.5 percent.
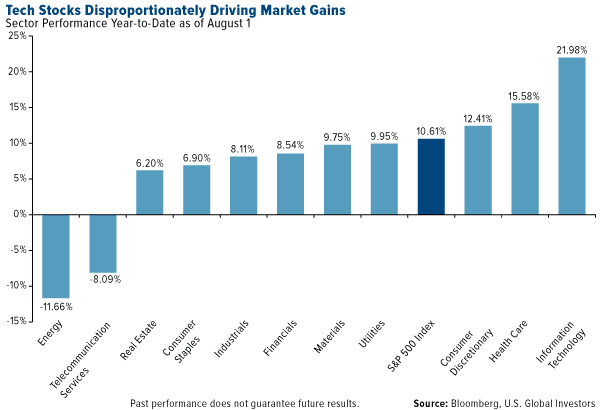
The reason I share this with you is because, while the market appears to be seeing solid growth right now, it’s being propelled disproportionately by only a handful of tech stocks. The S&P 500 is up 10.6 percent, but if we remove information technology, it’s up only around 7.5 percent. This makes the market vulnerable, should those stocks see a correction.
And that’s why I believe it’s particularly important to stay diversified, as Mike Darda said—diversified in emerging markets, which offer attractive valuations; muni bonds; and, as always, gold and gold stocks.
Index Summary
- The major market indices finished mixed this week. The Dow Jones Industrial Average gained 1.20 percent. The S&P 500 Stock Index rose 0.19 percent, while the Nasdaq Composite fell 0.36 percent. The Russell 2000 small capitalization index fell 1.19 percent this week.
- The Hang Seng Composite rose 1.70 percent this week; while Taiwan was up 0.80 percent and the KOSPI fell 0.23 percent.
- The 10-year Treasury bond yield fell 2 basis points to 2.26 percent.
Domestic Equity Market

Strengths
- Financials was the best performing sector of the week, increasing by 1.76 percent versus an overall increase of 0.13 percent for the S&P 500.
- Illumina was the best performing stock for the week, increasing 11.18 percent.
- Yelp's stock skyrocketed almost 20 percent on the news that it's selling Eat24 for $287.5 million to Grubhub.
Weaknesses
- Energy was the worst performing sector for the week, falling 1.02 percent versus an overall increase of 0.13 percent for the S&P 500.
- Range Resources was the worst performing stock for the week, falling 18.24 percent.
- AmerisourceBergen got crushed after it announced disappointing fiscal third-quarter earnings and reduced its expectations for revenue for the entire fiscal 2017.
Opportunities
- According to Brian Reynolds of Canaccord/Genuity in a piece of research entitled "The Credit-Led Equity Bull Market Is More Likely To Intensify Than Collapse,'' the stock market boom has another three to five years to run due to stimulus from states and municipalities. Reynolds suggests that the credit boom will persist because most major U.S. states, and a number of cities, have either raised or are thinking of raising taxes in order to shrink their pension underfunding. These states and municipalities need to earn 7.5 percent annual returns just to keep up, "and they do not want the perceived risks of stocks. Thus, they invest in aggressive credit and credit-related funds, which provides fuel for companies to buy back their stocks and increase shareholder value.'' These investors aren't focused on the macro environment or temporary sell-offs, writes Reynolds, but on "meeting their bogies.'' He then proceeds to list 25 different state or local pension funds and their announced $3.5 billion in commitments gathered over the past few weeks. It's an impressive list: Texas Teachers, Colorado Public Employees, New Jersey, Connecticut, Pennsylvania, Rhode Island, Tennessee and so on. He continues, "if history is a guide, assuming this money is put to work at 5x leverage (compared to the 10x-50x leverage of the last two credit cycles), this nearly $3.5 billion in commitments will return to the stock market in the form of more than $17 billion in buybacks.''
- Amazon is seen as a threat to every retailer in the U.S. The juggernaut is armed with a war chest of cash and has been disrupting every industry in sight. However, according to RBC Capital Markets, there are still a few bright spots. These are companies whose existing business models have created a natural insulation from Amazon as well as those that have been quick to adapt. The companies they highlight are CarMax, Walmart, Best Buy and Dollar General.
- GoPro's stock surged after cost-cutting efforts helped the company post second-quarter results that beat analyst estimates. The company also raised guidance for the third quarter.
Threats
- Investors in technology companies are heavily exposed to political risk as their surging popularity – tech stocks are up more than double the S&P 500 this year – have made them a proxy for market risk, according to Wells Fargo. So far this year traders have chased returns in the industry, which is growing earnings at a breakneck pace. What's been underappreciated is how much of a boost the sector has gotten from the macro picture, especially the slow implementation of President Donald Trump's economic agenda and a series of dovish comments from Fed Chair Janet Yellen. Wells Fargo warns that as soon as these dynamics shift, tech bulls could be in for a rude awakening. They recommend cutting exposure to the industry.
- According to Business Insider, a controversial ex-Goldman Sachs banker named Anthony Noto is the person who really runs Twitter and he's gambling the company's future on one risky bet. The bet is to turn Twitter, famous for celebrity feuds, trolls and Donald Trump, into a destination for live video — from sports to financial news to political debates.
- When the U.S. government released its annual revisions to economic growth last week, it made sharp downward revisions to the personal saving rate. Savings as a share of disposable income was 4.9 percent last year, not 5.7 percent as earlier calculated, the Bureau of Economic Analysis said. The update showed that incomes were less than previously reported, while consumption was higher. Albert Edwards, a Societe Generale strategist, published an alarming interpretation of this data in a note on Thursday. For Edwards, it's a replay of what caused the financial crisis all over again. "Every day more evidence mounts that almost exactly the same debt excesses that caused The Global Financial Crisis (GFC) in 2008, are present today," he said.
The Economy and Bond Market
Strengths
- The U.S. economy added 209,000 jobs in July, more than expected, while the unemployment rate returned to a 16-year low of 4.3 percent, the Labor Department said in a report Friday.
- U.S. durable goods orders posted the biggest gain in nearly three years last month, helped by a surge in demand for civilian aircraft. The Commerce Department said that orders climbed 6.5 percent in June, reversing two straight monthly drops. The June increase was the biggest since July 2014.
- The U.S. Markit Services PMI for July came in at 54.7, above the 54.2 forecast.
Weaknesses
- U.S. consumer spending barely rose in June as personal income failed to increase for the first time in seven months. The unchanged personal income figure was the weakest reading since a 0.1 percent dip in November 2016 and followed a 0.3 percent increase in May.
- U.S. construction spending unexpectedly fell in June as investment in public projects recorded its biggest drop since March 2002, suggesting a downward revision to the second-quarter economic growth estimate. The Commerce Department said that construction spending tumbled 1.3 percent, the lowest level since September 2016.
- Public pension fund investments returned only 0.6 percent on average in fiscal 2016, according to a report by the Center for Retirement Research at Boston College. This was far lower than its 7.6 percent average target and adds more pressure to an already overburdened public pension system.
Opportunities
- Municipal debt could become more attractive for banks to hold to meet liquidity coverage ratio requirements under two bills undergoing congressional debate. A new bill would require that regulators treat certain types of muni debt as a high-quality liquid asset (HQLA). The House bill was passed by a committee, 68-0, on July 25. Senate companion legislation hasn't seen action but has bipartisan cosponsors.
- Chicago will contribute $1.18 billion to pensions in 2018 as the junk-rated city ramps up payments to put its retirement funds on a path to solvency, even as the unfunded liabilities keep growing. The city will have a structural deficit of $114.2 million in 2018, the smallest since 2007, according to an annual financial analysis released this week.
- Connecticut’s legislature approved an agreement with state government worker unions that will save $1.6 billion over the next two fiscal years and more than $20 billion over the next two decades, Governor Dannel P. Malloy said. The $1.6 billion in savings in the current biennium is a “key piece" toward adopting a budget for the state, Malloy said. Connecticut began the July 1 fiscal year without a budget.
Threats
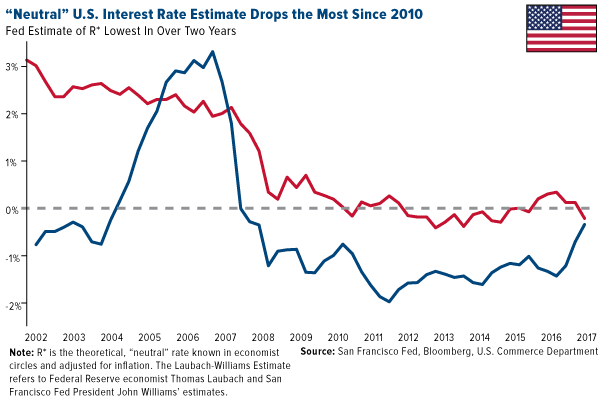
- The “neutral” U.S. interest rate fell in the second quarter by the most since 2010, according to a widely-cited estimate produced by Federal Reserve economist Thomas Laubach and San Francisco Fed President John Williams. The theoretical rate known by economists as “r-star,” which is adjusted for inflation and would neither stimulate nor restrict an economy growing at its trend pace, declined to -0.22 percent from 0.12 percent in the first quarter. In comparison, the Fed’s benchmark rate, adjusted for core inflation, is currently -0.35 percent, which suggests the central bank is nearly at a “neutral” monetary policy setting, according to the model. According to this, the Fed risks tightening financial conditions to a dangerous point if they raise rates too many more times.
- Next Friday's consumer price index (CPI) will be the most important U.S. data release of the week. Following four months of weakness, core CPI needs to show a rebound for the Fed to remain comfortable with the view that inflation will head to its 2 percent target.
- U.S. corporate debt may be so high that it's a threat to global stability, and Europe's banks are hanging by a thread, according to the International Monetary Fund (IMF). On a net level, Italy, Portugal and Spain have actually added non-performing loans to their books rather than worked them off over the last year.
Gold Market
This week spot gold closed at $1,259.30, down $10.35 per ounce, or 0.82 percent. Gold stocks, as measured by the NYSE Arca Gold Miners Index, ended the week lower by 2.35 percent. Junior-tiered stocks outperformed seniors for the week, as the S&P/TSX Venture Index fell only 0.89 percent. The U.S. Trade-Weighted Dollar Index bounced higher on Friday, due to the higher-than-expected change in Nonfarm Payrolls, finishing the week up 0.23 percent.
| Date | Event | Survey | Actual | Prior |
|---|---|---|---|---|
| Jul-31 | Eurozone CPI Core YoY | 1.1% | 1.2% | 1.1% |
| Jul-31 | Caixin China PMI Mfg | 50.4 | 51.1 | 50.4 |
| Aug-1 | ISM Manufacturing | 56.5 | 56.3 | 57.8 |
| Aug-2 | ADP Employment Change | 190k | 178k | 191k |
| Aug-3 | Initial Jobless Claims | 243k | 240k | 245k |
| Aug-3 | Durable Goods Orders | 6.0% | 6.4% | 6.5% |
| Aug-4 | Change in Nonfarm Payrolls | 180k | 209k | 231k |
| Aug-10 | Initial Jobless Claims | 240k | -- | 240k |
| Aug-10 | PPI Final Deman YoY | 2.2% | -- | 2.0% |
| Aug-11 | Germany CPI YoY | 1.7% | -- | 1.7% |
| Aug-11 | CPI YoY | 1.8% | -- | 1.6% |
Strengths
- The best performing precious metal for the week was platinum, up 3.10 percent on money managers cutting their bearish views on the metal in light of the new Russian sanctions signed into law earlier in the week. Russia is the world’s second largest producer of platinum. Gold traders and analysts surveyed by Bloomberg are bullish on gold for a seventh week, reports Bloomberg, making it the longest run since early March. In addition, BullionVault’s Gold Investor Index, which measures client buyers against sellers, rose in July when gold prices reached an almost four-month low. The Perth Mint released gold coin and minted bar sales figures for July, coming in at 23,675 ounces and up from June’s figure of 19,259 ounces, reports Bloomberg.
- In an attempt to push for more transparency, London Bullion Market Association released data showing its $298 billion gold stash, reports Bloomberg. The data will “soon be augmented by trade reporting, which will further enhance the ability of market participants as well as regulators to track and asses market activity,” said Joni Teves, a strategist with UBS in London.
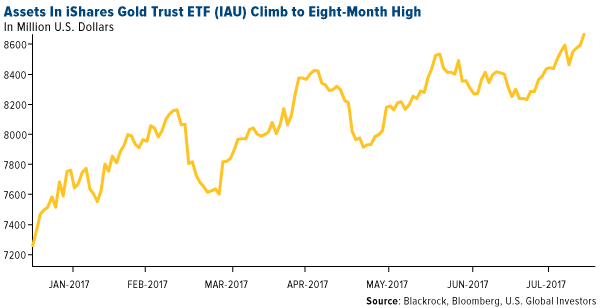
- In July, $2.4 billion was pulled from SPDR Gold Shares, the biggest withdrawal since May 2013, reports Bloomberg. However, investors weren’t necessarily abandoning bullion-backed ETFs; they may have been moving their money into less expensive options. As the chart below shows, assets in the iShares Gold Trust reached an eight-month high. Perhaps this is because SPDR Gold charges a fee of 40 basis points, while iShares Gold Trust has an expense ratio of 25 basis points.
Weaknesses
- The worst performing precious metal for the week was silver, off 2.95 percent on the pull-back in gold prices. As reduced investment in gold ETFs outweighed higher jewelry and bar purchases, global gold demand dropped to a two-year low in the second quarter, reports Bloomberg. “It was always going to be hard to match last year’s demand, simply because ETF buying was so strong,” said Alistair Hewitt of the World Gold Council. The slowdown in ETFs contrasts with improved demand for other gold products, which has helped push prices up by 11 percent.
- This is the second year in a row that policy changes in India may have strained gold sales, reports Bloomberg. Consumption is seen between 650 and 750 metric tons this year, compared to the annual average of around 850 tons in the previous half decade. The Indian government’s push to boost financial transparency cut consumption this year as they enacted a new consumer tax system, the article continues.
- Declines in U.S. car sales, combined with still-elevated inventory levels, provide signals that “profit and leverage metrics may weaken throughout the auto food chain,” writes Bloomberg. This could prove worrisome for platinum and palladium, used in the manufacturing of vehicle emission systems.
Opportunities
- Australian gold miners including Evolution Mining and Northern Star Resources may be required to look overseas for acquisitions to add operations of sufficient scale and quality, reports Global Mining Research Ltd. North America is likely to be their targeted destination. Last year Goldcorp Inc. pointed out that waning global gold output is likely to spur more deals and industry consolidation. “Mine supply may fall about a third in the 10 years to 2025,” according to Bloomberg calculations (based on forecasts from BMO Capital Markets and Randgold Resources).
- Commodities have plenty of catch-up room to the dollar, reports Bloomberg. On a spot basis, ending July unchanged, the Bloomberg Commodity Index is set to gain, while the Bloomberg Dollar Spot Index declines 9 percent. Now that reflation fears have been mostly alleviated, Bloomberg continues, renewed commodity vigor appears to be in early days.
- TriStar Gold announced assay results from reverse circulation drill holes at the Castelo de Sonhos gold project in Brazil, showing significant new gold reefs. According to the company, several individual intervals in the new holes exceed 10 grams per ton, cutting 1m at 27.8 grams per ton. Some of the individual reefs in the new holes are considerably thicker than the deposit average, the report continues. Another company announcement comes from Pure Gold Mining Inc., noting a new mineral resource estimate at its 100 percent owned Madsen Gold Project. The company reports 1,648,000 indicated ounces of gold at Madsen and 178,000 inferred ounces of gold. This represents a 48 percent increase to indicated resource ounces.
Threats
- Brown Brothers Harriman discusses the U.S. Treasury’s third quarter refunding plans in a note to investors this week. The group notes that on Monday, the Treasury said it projected borrowing at $96 billion in the third quarter ($2 billion less than June’s projection). “However, it signaled a surge in its borrowing needs for the fourth quarter; a whopping $501 billion,” writes BBH. This is perhaps the largest amount the federal government has tried to borrow since the fourth quarter crisis in 2008. “This is a huge amount of supply and appears to reflect the pay back for the extraordinary measures to circumvent the debt ceiling,” coming up for negotiation in the third quarter the article continues.
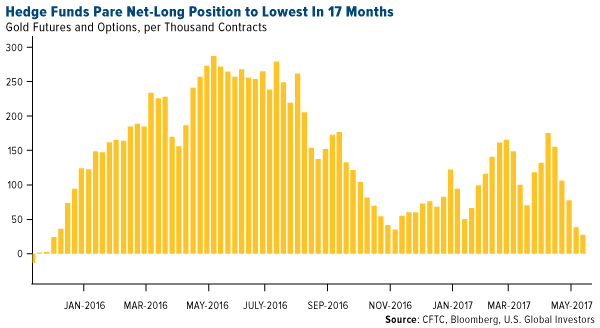
- Bloomberg notes three signals showing hedge funds are losing precious metals faith: 1) In the week ended July 11, the net-long position in gold fell to the lowest in 17 months, prior to the metal posting its first weekly gain in six weeks. 2) Silver is also losing its luster as the position by hedge funds in the white metal swung to a net-short from a net-long, making it the most bearish since August 2015. 3) Money managers pushed their net-short position in platinum to a record before data showed European car sales slowed in June.
- As Sibanye Gold joins AngloGold Ashanti in looking to close unprofitable shafts in order to stem losses, more than one in 10 gold mining jobs in South Africa could disappear, reports Bloomberg. South Africa produced more gold than any other country for a century until 2007 the article continues, but depleted reserves and rising costs have meant production and jobs have tumbled since the industry’s heydays of the 1970s and 1980s.
Energy and Natural Resources Market
Strengths
- Iron ore was the best performing commodity this week, rising 7.8 percent. The commodity benefited from news suggesting Chinese steel mills have been reporting major improvements on profitability, boosted by strong end user demand. Higher profitability among mills in the largest steel producing market suggests appetite for iron ore, a key raw material for steelmaking, is on the rise.
- The best performing sector this week was the Bloomberg Global Coal Producers Index. The index rose 2.5 percent driven by China-exposed producers which expect pricing for their product to strengthen on the back of positive sentiment at steel mills, which are the largest buyer of their metallurgical coal.
- SolarEdge Technologies Inc., a major provider of solar power solutions, was the best performing stock this week finishing up 24 percent. The company rallied after quarterly revenue and outlook topped analyst estimates. The company posted strong sales in its stronghold markets, with the addition of strong growth that beat expectations in its European markets.
Weaknesses
- Natural gas was the worst performing commodity this week, dropping 5.4 percent. The commodity slid on forecasts for a prolonged bout of unusually cool weather. According to Bloomberg, the blistering summer that gas bulls had been counting on to propel prices higher still hasn’t materialized, stoking concern that the market will be oversupplied heading into the low-demand fall season.
- The worst performing sector this week was the S&P 1500 Oil & Gas Exploration and Production Index. The index fell 5.1 percent driven by a sell-off in Permian exposed names. Numerous quarterly reports by operators on the basin suggest recent wells in the basin have been problematic, with pressure issues and higher gas to oil ratios, resulting in lower than anticipated well economics.
- The worst performing stock for the week was Pioneer Natural Resources Co. The Texan E&P dropped 16.2 percent after reporting a sizeable quarterly miss and a guidance downgrade as it struggled to develop wells that proved problematic at its Permian basin locations.
Opportunities
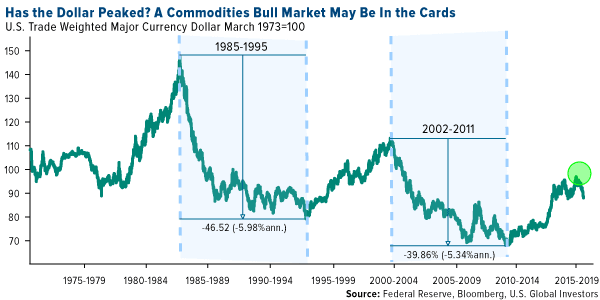
- A second-half rally in commodities may be in the cards, courtesy of the weak US dollar. Year-to-date, the U.S. dollar is off to its worst start since 1985, down about 9 percent. More importantly, the chart below suggests this type of technical break has twice spurred a decade-long bear market for the U.S. dollar, leading to declines of at least 40 percent. Those two previous U.S. dollar bear markets have coincided with rallying commodity prices and bull markets in emerging markets.
- A Dallas Fed survey suggests crude oil prices could move close to $60 per barrel by the end of the year. Respondents reporting to the Dallas Fed said $59 is in line with the WTI price needed to profitably drill new wells. In addition, respondents suggested that the growth in rig counts could stall as drilling activity may taper off until prices recover further.
- China’s steelmakers are booming and driving coal and iron ore prices higher. A rapid surge in steel prices since end of June has been backed by demand optimism and signs the government is determined to curb marginal steel mill capacity. The biggest mills have reported soaring profit margins as rebar, a product used in construction, is selling at the highest prices since 2013, notes Bloomberg.
Threats
- Crude prices dropped after a surprise inventory-build this week. Peak summer driving season boosts gasoline demand and generally coincides with major crude and gasoline inventory draws. So far summer crude draws have been healthy, however, it remains critical for price stability that the remainder of the summer shows similar crude demand and draws.
- OPEC is facing a growing concern of how to keep the market calm when the organization decides to remove the production cap, according to the WSJ. A Macro Strategy Partners report this week highlights comments by the Saudi energy minister who anticipated the Kingdom is looking for ways to avoid a “shock [to] the markets” when it unwinds the November 2016 agreement. In addition, compliance with cuts is expected to fall as discussion about a removal of caps take place.
- Steelmakers in the U.S. have underperformed as economists warn U.S. GDP may be set up for disappointment based on results by the auto industry. To substantiate this claim, economists have cited that General Motors is cutting back passenger car production to address high inventory levels, which will ripple across its suppliers and generally lower demand for domestic steel and other industrial metals.
China Region
Strengths
- Hong Kong’s Hang Seng Composite Index (HSCI) soared another 1.70 percent for the week—and even higher intraweek—to put in more 52-week highs and edge a little closer to 2015 highs.
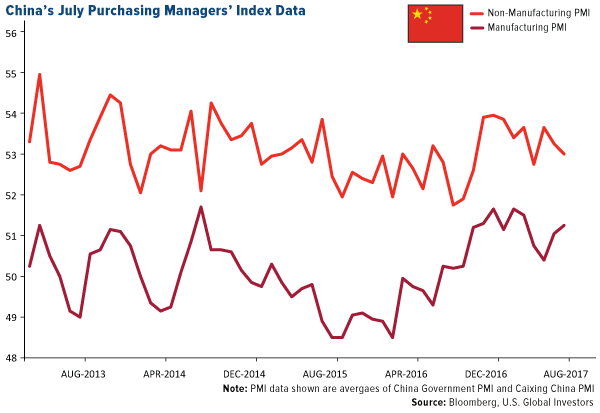
- Although China’s official PMI survey showed that growth in the nation’s manufacturing sector cooled ever so slightly in July to 51.4 from 51.7 in June, the private Caixin China Manufacturing PMI jumped to 51.1 in July, up from 50.4 in June and—importantly—came in well ahead of expectations for a 50.4 result.
- The Indian rupee and the Philippine peso climbed for the week, rising about 90 basis points and 78 basis points respectively. The Reserve Bank of India cut rates this week and the rupee rose.
Weaknesses
- The Philippines Stock Exchange Index fell 1.72 percent for the week.
- The Nexteer Automotive Group (1316 HK) was the weakest-performing stock in the HSCI for the week, falling 13.33 percent for the week, presumably on lower U.S. auto sales. The company derives some 65 percent of its sales from North America.
- Although U.S. tech giant Apple sales increased globally during its quarter ended June 30, revenue in the region that includes China fell for a sixth straight period, reports Bloomberg. According to Bloomberg Gadfly columnist Shira Ovide, iPhones in China aren’t the must-have they were when the blockbuster iPhone 6 models went on sale in late 2014. Apple, however, remains optimistic about overall demand.
Opportunities
- Indonesia is said to be seeking proposals for Chevron and ConocoPhillips to renew oil and gas operating licenses in the country, which has suffered a decline in energy investment. An amicable and quick decision on the oil and gas issue could help to rehabilitate Indonesia’s reputation, which has also suffered amid contention with Freeport McMoran over the massive Grasberg copper and gold mine. Joko Widodo’s administration hopes to bring in as much as $200 billion in energy investment over the course of the next decade.
- VIPs may be creeping back to Macau, according to Bloomberg News, which notes that revenue in the Chinese gambling hub has continued to rise. Revenue from high-rollers—which suffered most during the initial Xi Jinping crackdown—has shown a faster pace of recovery this year, growing 35 percent in the second quarter, much better than 8.1 percent for recreational gamblers.
- The press reports that U.S. Secretary of State Rex Tillerson is visiting Asia this week, participating in the ASEAN meetings in Manila before heading for Thailand to pay respects to the late King Bhumibol Adulyadej, who died in October. Tillerson then heads to Kuala Lumpur to meet with Malaysian officials concerning future bilateral cooperation. All the while, China and the U.S. are reported to be edging closer to a mutually-agreeable agreement on a U.N. proposal for boosting North Korean sanctions.
Threats
- On the flipside, however, the Trump administration has pushed back its announcement on specifics over China trade policies and possible tariffs. Press reports suggest the administration may employ Section 301 of the 1974 Trade Act to position the United States as the victim of unfair trade policies from a foreign country, i.e. China in this case, and thereby grant the administration the ability to raise “protective” tariffs, or “level the playing field,” if you will. Intellectual property, in particular, has been named explicitly by the Trump administration as a top priority in the forthcoming announcement.
- North Korea’s missile launch late last week is reported to have demonstrated a vertical capacity to reach as far as Los Angeles, Chicago, or Denver in the continental United States. The relatively vertical trajectory of the missile—as opposed to an intercontinental trajectory—was the reason for its splashdown in Japanese waters, but the range, analysts suggest, was sufficiently demonstrated to be of increasing concern. Clearly, with work toward a jointly-acceptable U.N. proposal coming amid Tillerson’s Asia trip, North Korea still remains high on the international radar.
- On Thursday, China’s Foreign Ministry said that India has been building up troops and repairing roads along its side of the border “amid an increasingly tense stand-off in a remote frontier region beside the Himalayan kingdom of Bhutan,” reports Reuters. The neighbors share a 3,500-km frontier, large parts of which are disputed. China was warned by India that construction of the road near the common border would have serious security implications, the article notes.
Emerging Europe
Strengths
- Hungary was the best performing country this week, gaining 2.6 percent. MOL Group, an integrated oil and gas company, was the best performing stock on the Budapest exchange. The company appreciated more than 5 percent after publishing strong quarterly results.
- The Polish zloty was the best performing currency this week, gaining 50 basis points against the U.S. dollar. Despite political noise, the Warsaw stock exchange trends higher and the zloty continues its appreciation against the dollar, supported by a strong economy. Poland’s economy grew by 2.6 percent in 2016, and local economists anticipate Poland’s GDP to grow at 3 percent this year.
- The energy sector was the best performing sector among eastern European markets this week.
Weaknesses
- Poland was the worst relative performing country this week, gaining 20 basis points. Asseco, Poland’s biggest information technology company, was the worst performing stock on the Warsaw stock exchange. According to Bloomberg, Asseco is in takeover talks with several companies outside of Poland. This week the company sold 16 percent stake in Formula Systems and announced that it wants to continue paying high dividends.
- The Russian ruble was the worst performing currency this week, losing 70 basis points against the U.S. dollar. The U.S. investigation into Russia’s interference in the 2016 presidential election is growing, putting pressure on the ruble.
- The real estate sector was the worst performing sector among eastern European markets this week.
Opportunities
- Turkish inflation fell sharper than expected to 9.8 percent year-over-year, from 10.9 percent year-over-year in June. The decline in inflation was driven almost entirely by a decline in food, beverage and tobacco inflation. As inflation continues to descent, the central bank may become more confident that it can reverse the monetary tightening undertaken at the start of the year.
- The European debt crisis and economic recession were the reason for the European Central Bank’s (ECB’s) asset purchase program and negative interest rate policy. Neither of these conditions are in place now, says BCA research. The euro area’s unemployment continues to descent, while core inflation is showing signs of turning higher. The ECB could be announcing an exit from its emergency policies in autumn.
- Inflows into emerging market funds continue. Emerging market equity funds received 0.2 percent of NAV in the week ending Wednesday August 2, while emerging market bond funds received an impressive 0.5 percent of NAV in inflows. Developed market funds received much less (equities zero and bonds 0.1 percent of NAV). The strong inflows into emerging market bond funds is another positive for countries with high yields such as Turkey or Greece, says Berenberg’s research team.
Threats
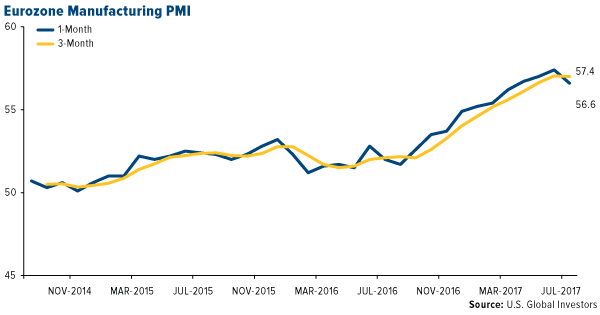
- Eurozone PMI for July was reported at 56.6 versus the prior 57.4, mostly led by a down revision in Germany and France, the two biggest eurozone economies. As the chart below illustrates, the one-month PMI reading for the eurozone crossed below the three-month average, possibly indicating a trend reversal. Central emerging Europe’s PMIs rose on average, but were driven entirely by improvement in Russia. Russian PMI increased to 52.7 from 50.3, while the Polish, Hungarian, Turkish and Czech PMIs all declined. Greek PMI was unchanged at 50.5, still above the 50 level that separates growth from contraction.
- The National Bank of the Czech Republic hiked its two-week repo rate from 0.5 percent to 0.25 basis points as expected. This was Czech’s first rate hike since 2008, and the first in Europe this year. Capital Economics’ research team thinks that the country’s inflation is likely to be higher than most expected, resulting in more rate hikes than are currently priced in.
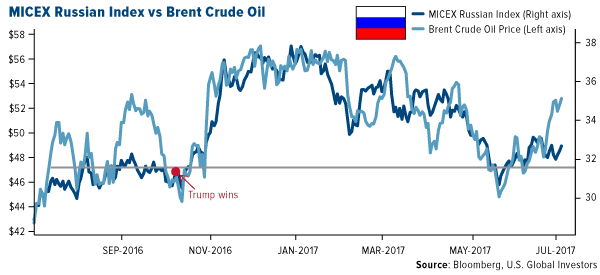
- President Donald Trump signed into law Wednesday morning legislation that will impose new sanctions on Russia and restrict his ability to ease sanctions against Moscow. Russian Prime Minister Dmitry Medvedev commented that the hope for an improved relationship between Russia and the new American administration is finished and marked it as a “full-scale trade war.” Russian securities have not appreciated recently with the rebound in the price of Brent crude oil.
Leaders and Laggards
| Index | Close | Weekly Change($) |
Weekly Change(%) |
|---|---|---|---|
| Russell 2000 | 1,412.32 | -16.94 | -1.19% |
| S&P Basic Materials | 342.01 | -2.72 | -0.79% |
| Nasdaq | 6,351.56 | -23.11 | -0.36% |
| Hang Seng Composite Index | 3,758.55 | +62.67 | +1.70% |
| S&P 500 | 2,476.83 | +4.73 | +0.19% |
| Gold Futures | 1,264.80 | -10.50 | -0.82% |
| Korean KOSPI Index | 2,395.45 | -5.54 | -0.23% |
| DJIA | 22,092.81 | +262.50 | +1.20% |
| S&P/TSX Global Gold Index | 192.53 | -1.99 | -1.02% |
| SS&P/TSX Venture Index | 765.68 | -6.89 | -0.89% |
| XAU | 82.04 | -3.52 | -4.11% |
| S&P Energy | 483.44 | -5.00 | -1.02% |
| Oil Futures | 49.52 | -0.19 | -0.38% |
| 10-Yr Treasury Bond | 2.26 | -0.03 | -1.18% |
| Natural Gas Futures | 2.78 | -0.16 | -5.41% |
| Index | Close | Monthly Change($) |
Monthly Change(%) |
|---|---|---|---|
| Korean KOSPI Index | 2,395.45 | +7.10 | +0.30% |
| Hang Seng Composite Index | 3,758.55 | +248.73 | +7.09% |
| Nasdaq | 6,351.56 | +200.71 | +3.26% |
| XAU | 82.04 | +2.17 | +2.72% |
| S&P/TSX Global Gold Index | 192.53 | -0.62 | -0.32% |
| Gold Futures | 1,264.80 | +35.90 | +2.92% |
| S&P 500 | 2,476.83 | +44.29 | +1.82% |
| S&P Basic Materials | 342.01 | +2.93 | +0.86% |
| DJIA | 22,092.81 | +614.64 | +2.86% |
| Russell 2000 | 1,412.32 | -7.83 | -0.55% |
| SS&P/TSX Venture Index | 765.68 | +2.88 | +0.38% |
| Oil Futures | 49.52 | +4.39 | +9.73% |
| S&P Energy | 483.44 | +5.77 | +1.21% |
| Natural Gas Futures | 2.78 | -0.06 | -2.04% |
| 10-Yr Treasury Bond | 2.26 | -0.06 | -2.62% |
| Index | Close | Quarterly Change($) |
Quarterly Change(%) |
|---|---|---|---|
| Korean KOSPI Index | 2,395.45 | +154.21 | 6.88% |
| Hang Seng Composite Index | 3,758.55 | +422.87 | +12.68% |
| Nasdaq | 6,351.56 | +250.81 | +4.11% |
| Natural Gas Futures | 2.78 | -0.48 | -14.82% |
| Gold Futures | 1,264.80 | +27.80 | +2.25% |
| S&P 500 | 2,476.83 | +77.54 | +3.23% |
| S&P Basic Materials | 342.01 | +6.53 | +1.95% |
| S&P/TSX Global Gold Index | 192.53 | -9.29 | -4.60% |
| XAU | 82.04 | +1.76 | +2.19% |
| DJIA | 22,092.81 | +1,085.87 | +5.17% |
| Russell 2000 | 1,412.32 | +15.33 | +1.10% |
| SS&P/TSX Venture Index | 765.68 | -16.04 | -2.05% |
| S&P Energy | 483.44 | -12.01 | -2.42% |
| Oil Futures | 49.52 | +3.30 | +7.14% |
| 10-Yr Treasury Bond | 2.26 | -0.09 | -3.70% |
U.S. Global Investors, Inc. is an investment adviser registered with the Securities and Exchange Commission ("SEC"). This does not mean that we are sponsored, recommended, or approved by the SEC, or that our abilities or qualifications in any respect have been passed upon by the SEC or any officer of the SEC.
This commentary should not be considered a solicitation or offering of any investment product.
Certain materials in this commentary may contain dated information. The information provided was current at the time of publication.
Some links above may be directed to third-party websites. U.S. Global Investors does not endorse all information supplied by these websites and is not responsible for their content.
All opinions expressed and data provided are subject to change without notice. Some of these opinions may not be appropriate to every investHoldings may change daily.
Holdings may change daily. Holdings are reported as of the most recent quarter-end. The following securities mentioned in the article were held by one or more accounts managed by U.S. Global Investors as of 06/30/2017:
MOL Hungarian Oil & Gas PLC
Asseco Poland SA
Chevron
Freeport McMoRan
Nexteer Automotive
SolarEdge Technologies Inc.
Evolution Mining Ltd.
Northern Star Resources Ltd.
TriStar Gold Inc.
Pure Gold Mining Inc.
Sibanye Gold Ltd.
AngloGold Ashanti Ltd.
SPDR Gold Shares
The Dow Jones Industrial Average is a price-weighted average of 30 blue chip stocks that are generally leaders in their industry.
The S&P 500 Stock Index is a widely recognized capitalization-weighted index of 500 common stock prices in U.S. companies.
The Nasdaq Composite Index is a capitalization-weighted index of all Nasdaq National Market and SmallCap stocks.
The Russell 2000 Index® is a U.S. equity index measuring the performance of the 2,000 smallest companies in the Russell 3000®, a widely recognized small-cap index.
The Hang Seng Composite Index is a market capitalization-weighted index that comprises the top 200 companies listed on Stock Exchange of Hong Kong, based on average market cap for the 12 months.
The Taiwan Stock Exchange Index is a capitalization-weighted index of all listed common shares traded on the Taiwan Stock Exchange.
The Korea Stock Price Index is a capitalization-weighted index of all common shares and preferred shares on the Korean Stock Exchanges.
The Philadelphia Stock Exchange Gold and Silver Index (XAU) is a capitalization-weighted index that includes the leading companies involved in the mining of gold and silver.
The U.S. Trade Weighted Dollar Index provides a general indication of the international value of the U.S. dollar.
The S&P/TSX Canadian Gold Capped Sector Index is a modified capitalization-weighted index, whose equity weights are capped 25 percent and index constituents are derived from a subset stock pool of S&P/TSX Composite Index stocks.
The S&P 500 Energy Index is a capitalization-weighted index that tracks the companies in the energy sector as a subset of the S&P 500.
The S&P 500 Materials Index is a capitalization-weighted index that tracks the companies in the material sector as a subset of the S&P 500.
The S&P 500 Financials Index is a capitalization-weighted index. The index was developed with a base level of 10 for the 1941-43 base period.
The S&P 500 Industrials Index is a Materials Index is a capitalization-weighted index that tracks the companies in the industrial sector as a subset of the S&P 500.
The S&P 500 Consumer Discretionary Index is a capitalization-weighted index that tracks the companies in the consumer discretionary sector as a subset of the S&P 500.
The S&P 500 Information Technology Index is a capitalization-weighted index that tracks the companies in the information technology sector as a subset of the S&P 500.
The S&P 500 Consumer Staples Index is a Materials Index is a capitalization-weighted index that tracks the companies in the consumer staples sector as a subset of the S&P 500.
The S&P 500 Utilities Index is a capitalization-weighted index that tracks the companies in the utilities sector as a subset of the S&P 500.
The S&P 500 Healthcare Index is a capitalization-weighted index that tracks the companies in the healthcare sector as a subset of the S&P 500.
The S&P 500 Telecom Index is a Materials Index is a capitalization-weighted index that tracks the companies in the telecom sector as a subset of the S&P 500.
The NYSE Arca Gold Miners Index is a modified market capitalization weighted index comprised of publicly traded companies involved primarily in the mining for gold and silver.
The Consumer Price Index (CPI) is one of the most widely recognized price measures for tracking the price of a market basket of goods and services purchased by individuals. The weights of components are based on consumer spending patterns.
The Purchasing Manager’s Index is an indicator of the economic health of the manufacturing sector. The PMI index is based on five major indicators: new orders, inventory levels, production, supplier deliveries and the employment environment.
The S&P/TSX Venture Composite Index is a broad market indicator for the Canadian venture capital market. The index is market capitalization weighted and, at its inception, included 531 companies. A quarterly revision process is used to remove companies that comprise less than 0.05% of the weight of the index, and add companies whose weight, when included, will be greater than 0.05% of the index.
The Caixin China General Services PMI (Purchasing Managers' Index) is based on data compiled from monthly replies to questionnaires sent to purchasing executives in over 400 private service sector companies. The index tracks variables such as sales, employment, inventories and prices. The Caixin China Manufacturing PMI (Purchasing Managers' Index) is based on data compiled from monthly replies to questionnaires sent to purchasing executives in over 400 private manufacturing sector companies. The U.S. Trade Weighted Dollar Index provides a general indication of the international value of the U.S. dollar. The ISM Nonmanufacturing index based on surveys of more than 400 non-manufacturing firms' purchasing and supply executives, within 60 sectors across the nation, by the Institute of Supply Management (ISM). The ISM Non-Manufacturing Index tracks economic data, like the ISM Non-Manufacturing Business Activity Index. A composite diffusion index is created based on the data from these surveys that monitors economic conditions of the nation The MICEX Index is cap-weighted composite index calculated based on prices of the 50 most liquid Russian stocks of the largest and dynamically developing Russian issuers presented on the Moscow Exchange. MICEX Index was launched on September 22, 1997 at base value 100. The MICEX Index is calculated in real time and denominated by Moscow Exchange in Russian rubles. The Bloomberg Intelligence (BI) Global Coal Producers Top Competitive Peer Group is an equal-weighted basket of peers. The S&P 1500 Supercomposite Oil & Gas Exploration & Production Index is a capitalization-weighted index comprised of stocks whose primary function is exploring for natural gas and oil resources on land or at sea. The Philippine Stock Exchange PSEi Index is composed of stocks representative of the industrial, properties, services, holding firms, financial and mining & oil sectors of the Philippines Stock Exchange. The Bloomberg Commodity Index is made up of 22 exchange-traded futures on physical commodities. The index represents 20 commodities, which are weighted to account for economic significance and market liquidity. The Bloomberg Dollar Spot Index (BBDXY) tracks the performance of a basket of 10 leading global currencies versus the U.S. Dollar. Earnings per Share (EPS) is the portion of a company's profit allocated to each outstanding share of common stock. Earnings per share serves as an indicator of a company's profitability. Diversification does not protect an investor from market risks and does not assure a profit. The Consumer Price Index (CPI) is one of the most widely recognized price measures for tracking the price of a market basket of goods and services purchased by individuals. The weights of components are based on consumer spending patterns.
Membership required
Membership is now required to use this feature. To learn more:
View Membership Benefits