So far in 2017, we’ve seen economically sensitive cyclicals (Consumer Discretionary, Energy, Financials, Industrials, Information Technology, and Materials) continue to underperform their defensive counterparts (Consumer Staples, Health Care, Real Estate, Telecommunication Services, and Utilities).
Health Care has driven this year’s returns for defensive sectors (as was the case in 2015), while within the sector biotechnology stocks have led, as was also the case in 2015.
Earlier in the year, the lead for growth stocks suggested a consolidating market to us, one in which last year’s winners (that is, cyclicals) reversed roles with 2016’s disappointments (healthcare stocks having corrected in 2016).
Nearly three-quarters of the way through the year with growth’s leadership still firmly in place, we are beginning to see the current U.S. stock market as disconnected from what’s happening in the economy.
Both stock and bond investors appear to be pessimistic. The yield on the 10-year Treasury has been falling through most of the year, which typically (though not always) signals concerns about economic growth, just as investors’ preferences for more duration and defensive investments often does.
We are more optimistic. So while we see ample uncertainty, we also see more than enough reasons to be cheerful about economic prospects—especially on the global level.
To begin with, 2017 looks nothing like 2015 to us. We have an expanding global economy, the possibility of improved GDP growth in the U.S., and no one is talking seriously about looming recessions.
So while almost no one seems excited by the slow rate of U.S. economic growth, we think it’s important to note that our economy is growing—and even at “this petty pace,” slow growth beats contraction or flatlining.
Equally important is the improving global picture.
Japan recently reported its best quarterly GDP numbers in more than two years, lifted by consumer and CAPEX spending; the eurozone, unresolved Brexit issues notwithstanding, continues to do well, and China’s strengthening currency is another in a series of signs that its economy is roaring back.
Of course, valuations are high for many stocks across the market cap spectrum. Yet we looked at the 15-year average of EV/EBIT for the Russell 2000 Index, separating the metric into cyclical and defensive.
Russell 2000 Median LTM EV/EBIT 1 ex Negative EBIT as of 6/30/17
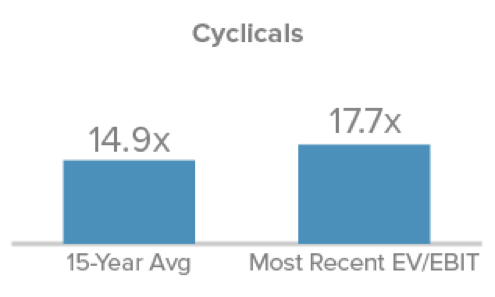
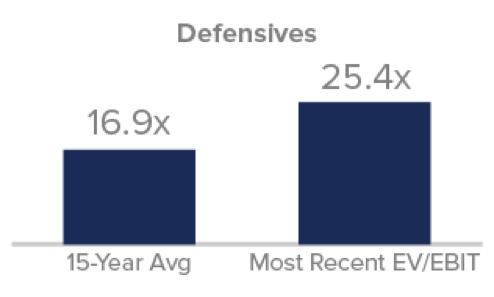
1 Last twelve months enterprise value/earnings before interest and taxes
Cyclical and Defensive are defined as follows:
Cyclical: Consumer Discretionary, Energy, Financials, Industrials, Information Technology, Materials. Defensive: Consumer Staples, Health Care, Real Estate, Telecommunication Services, Utilities
Source: Factset
The average for cyclicals is running a little higher than its long-term average, but still looks much better than the average for defensives—which are running substantially higher.
We think solid-to-strong prospects for the global economy, along with relatively more attractive valuations, should mean good things for a certain kind of small-cap company.
From our perspective, small-caps in cyclical industries with global exposure look poised to lead —and we are happy to be holding many.
Stay tuned…
Important Disclosure Information
Mr. Gannon's thoughts and opinions concerning the stock market are solely his own and, of course, there can be no assurance with regard to future market movements. No assurance can be given that the past performance trends as outlined above will continue in the future.
Frank Russell Company (“Russell”) is the source and owner of the trademarks, service marks and copyrights related to the Russell Indexes. Russell® is a trademark of Frank Russell Company. Neither Russell nor its licensors accept any liability for any errors or omissions in the Russell Indexes and / or Russell ratings or underlying data and no party may rely on any Russell Indexes and / or Russell ratings and / or underlying data contained in this communication. No further distribution of Russell Data is permitted without Russell’s express written consent. Russell does not promote, sponsor or endorse the content of this communication. The Russell 2000 Index is an unmanaged, capitalization-weighted index of domestic small-cap stocks. It measures the performance of the 2,000 smallest publicly traded U.S. companies in the Russell 3000 Index. The performance of an index does not represent exactly any particular investment, as you cannot invest directly in an index.
Sector weightings are determined using the Global Industry Classification Standard ("GICS"). GICS was developed by, and is the exclusive property of, Standard & Poor's Financial Services LLC ("S&P") and MSCI Inc. ("MSCI"). GICS is the trademark of S&P and MSCI. "Global Industry Classification Standard (GICS)" and "GICS Direct" are service marks of S&P and MSCI.
This material is not authorized for distribution unless preceded or accompanied by a current prospectus. Please read the prospectus carefully before investing or sending money. Investments in securities of micro-cap, small-cap, and/or mid-cap companies may involve considerably more risk than investments in securities of larger-cap companies. (Please see "Primary Risks for Fund Investors" in the prospectus.) Investments in foreign companies may be subject to different risks than investments in securities of U.S. companies, including adverse political, social, economic, or other developments that are unique to a particular country or region. (Please see "Investing in International Securities" in the prospectus.)


