I am a traditionalist when it comes to outdoor cooking: wood and charcoal are the only suitable fuels. I know that gas grills are convenient, but food just tastes better when it’s been exposed to some real fire.
There is an art to barbecue. You need to apply flame to kindling to get the process started, and then manage the heat carefully through venting. If the elements get out of balance, the temperature can spike; getting it back under control is not easy.
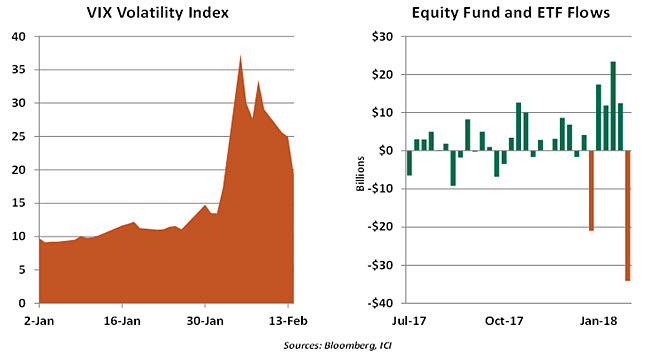
I was thinking of this process during last week’s market disruption. Concerns about overvaluation provided the kindling, and worrisome inflation news supplied the spark. But from there, the coals overheated, thanks to a series of forces that were difficult to stop. This essay will focus on the natural accelerants that can exacerbate negative market cycles. This month, we saw them in action for first time in quite a while.
Misconduct
In recent decades, behavioral science has challenged the traditional economic assumption of rational behavior. We now understand that actual conduct is not strictly rational, but it still follows some predictable patterns. Our piece on this kind of “misbehavior” can be found here.
One example is “confirmation bias.” This is the tendency to place more weight on news that substantiates what we already believe, to the exclusion of information that challenges us. When markets are gaining, the rose-colored filter investors use to digest incoming news can lead them to grow more confident that the risk in their portfolio is modest and well managed. When volatility is low, this confidence is heightened.

A second behavioral flaw is known as “rational inattention.” Busy people will have to make tradeoffs in how they allocate their time. Attention is often focused on things which are not going well, limiting examination of more positive trends. Rising markets may not generate sufficient introspection, either among individual investors or those who guide institutional portfolios.
Finally, it is well-established that losses have a disproportionate impact on people relative to gains of the same size. The resulting “loss aversion” is especially powerful when disappointments are large and sudden.
When a market correction occurs, these behavioral factors can lead to a quick shift from an appetite for risk to an aversion to risk. People seize on news that confirms their worst fears, and may take actions to limit their losses in the short term even if they see themselves as long-term investors. With their comfort violated, rationally inattentive investors opt to “just say no” until they have the opportunity to dig more deeply into what’s going on.
All of these elements pushed this month’s correction further than the change in fundamentals might have suggested.
Machine Learning
These tendencies are no longer confined to human actors. Some have been encoded into the algorithms that direct trading over a widening swath of the financial landscape.
Quantitative strategies use patterns in securities prices to anticipate upcoming movements. If something seems out of alignment, the algorithm will take positions (sometimes very large) that profit if conditions return to normal. These “bets” often occur with very high frequency in very short spaces of time.
The Wall Street Journal asserted last summer that “The Quants Run Wall Street Now.” Judging by data on trading volumes, it is hard to argue with this assertion.
The strength and weakness of quantitative strategies is that they are naïve. They do not stop to ask why a trend is occurring; this removes the chance of misinterpretation (which humans are certainly prone to), but it can go astray if something more fundamental is making past patterns less valuable as guides to the future.
When markets begin to correct, algorithms often anticipate that they will settle back to some recent equilibrium. But once movements go beyond a certain threshold, the computers will capitulate. Signals shift from long to short and they can oscillate at inflection points, adding to market volatility.
Like the people who build it, trading software can exhibit behavioral patterns that are quite cyclical.
Leverage of a Different Kind
Many of us take comfort in the knowledge that the degree of leverage in the banking system today is a small fraction of what it was in 2007. Efforts to bolster capital levels have made it much less likely that a market correction will bring down a significant institution and initiate systemic problems. But an alternative form of levering is still alive and well.
The value of traditional investment funds moves in synch with asset prices in the underlying market. The values of a handful of products, however, move more than one-for-one with market changes. (In this manner, these engineered vehicles provide “leveraged” returns to their owners.) Other offerings are structured to move in the opposite direction from the markets.
These creations have been especially popular in the markets related to volatility, which had been unusually low and stable for some time. Bets on the CBOE Volatility Index (VIX) have expanded dramatically over the past five years.
When volatility surged at the beginning of the month, products whose values move in the opposite direction were severely damaged. That, in turn, caused reactive transactions that added to volatility and reduced stock values. It appears that the majority of those who owned “inverse VIX” vehicles had lots of capital and lots of experience. But some ordinary investors had pursued “yield enhancement strategies” that used VIX contracts as part of a broader portfolio.
Warren Buffet once observed that “you don’t know who’s been skinny dipping until the tide goes out.” A corollary to that general theorem is that we might not appreciate the scale of financial exotica until markets fluctuate.
Flawed Defenses
The computers taking positions aren’t the only ones that can react sharply in correcting markets. Those that are used to measure and control the risk of those positions have the same tendency.
Risk management began a sea change in the late 1980s, as technical methods advanced. The “artists,” who relied more on intuition to understand complicated risk landscapes, increasingly gave way to the “scientists,” who felt most at home with statistical models.
While the two camps are often seen to be in opposition, art and science each have an important role to play in a healthy risk management process. The scientists’ models can aggregate more data than individuals can. But the limitations of technical approaches place a premium on those who can see “tail risks” that models cannot.
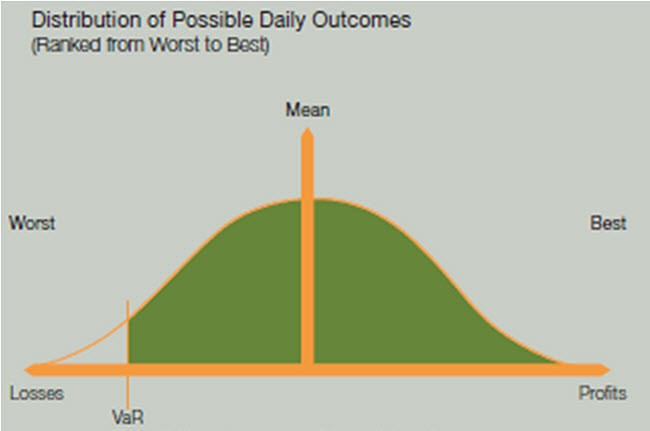
Among the quantitative tools commonly used by modern risk managers is value at risk (VaR). On the surface, VaR is deceptively straightforward. Taking the example of a common stock, past daily price changes in that stock for some length of time are assembled into a distribution of outcomes. VaR gauges how much money the investor would lose on one of the worst days during that interval.
VaR has a lot of attractions. It can condense the risk of a position or portfolio into a single number. It puts a wide range of holdings on a similar analytical footing. It passes the smell test, showing higher levels of risk when markets became more volatile, and less when they are calm.
Unfortunately, VaR is sometimes measured over past periods that are too short, and include too few adverse observations. When positions go on a losing streak after a long period of gains, bad days swell the left-hand side of the distribution, raising the VaR. In some cases, market movements cause VaR to exceed its limits, leading portfolio managers to liquidate some of their holdings. The selling mania adds to the losing streak and reinforces the negativity.
In the aftermath of the 2008 crisis, VaR systems were augmented to factor in the possibility of extreme events (so-called black swans). New metrics were developed to compensate for VaR’s shortcomings. Value at risk will likely remain an important tool for risk managers, but only as part of a larger tool kit.
Risk management does not pay enough attention to worst-case scenarios. Tail events occur much more frequently than normal distributions would suggest. Evaluating positions under extreme conditions can provide additional perspective and a potentially more stable basis for investing.
The importance of looking at things in this context is illustrated by the following example. Consider a portfolio with loans to two entities: a golf course operator and an umbrella manufacturer. Individually, each company faces some weather-related risk: sunny climes favor the golf, while rain promotes umbrella sales. But taken together, their results should be unaffected by the forecast, unless an extreme event like a hurricane arrives to damage both.
Models will never be perfect, but they could be better. Going forward, models should attempt to reflect the behavioral and technological elements that contribute to market cycles. And too many market participants look at risk the same way; some genetic diversity in the modeling code might be broadly beneficial.
In sum, the steady increase in asset prices over the past few years led many people and models to become optimistic at the same time. Both may have dropped their guard a bit as values moved ever upward. Reflecting on recent events provides a renewal of perspective that may be valuable the next time around. That process should not stop prematurely, just because the equity markets seem to have righted themselves.
It is not clear that remedies for this condition exist; steps to save investors from themselves or their algorithms could inhibit the healthy risk taking that is essential to market and economic performance. Nonetheless, we should be aware of market accelerants and the intense heat they can create.
I’ve overcooked my fair share of burgers and ribs over the years, and I probably haven’t experienced my last grilling disappointment. But I try to learn from each experience, so that the next time I step in front of the fire, the results will be better. I’d like to think that this pattern will be repeated in the investment community, bringing markets back to a safe and sustainable temperature.
© Northern Trust
www.northerntrust.com
© Northern Trust
Read more commentaries by Northern Trust
 Quantitative strategies use patterns in securities prices to anticipate upcoming movements. If something seems out of alignment, the algorithm will take positions (sometimes very large) that profit if conditions return to normal. These “bets” often occur with very high frequency in very short spaces of time.
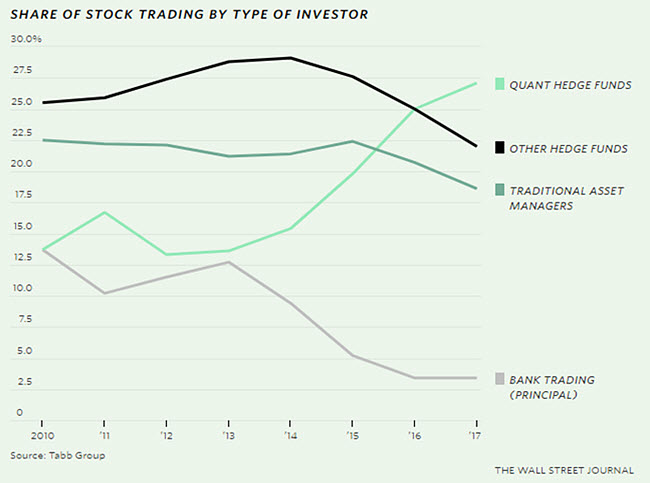
 The value of traditional investment funds moves in synch with asset prices in the underlying market. The values of a handful of products, however, move more than one-for-one with market changes. (In this manner, these engineered vehicles provide “leveraged” returns to their owners.) Other offerings are structured to move in the opposite direction from the markets.
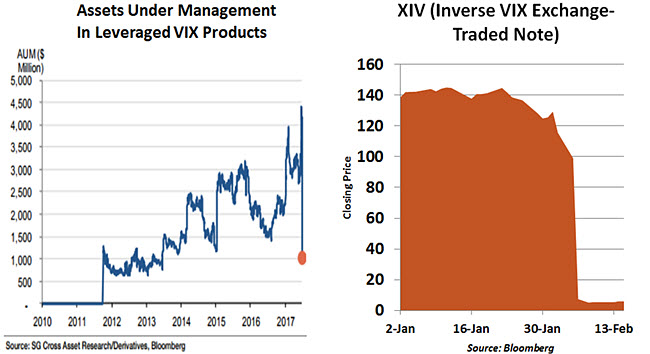
 VaR has a lot of attractions. It can condense the risk of a position or portfolio into a single number. It puts a wide range of holdings on a similar analytical footing. It passes the smell test, showing higher levels of risk when markets became more volatile, and less when they are calm.
  Unfortunately, VaR is sometimes measured over past periods that are too short, and include too few adverse observations. When positions go on a losing streak after a long period of gains, bad days swell the left-hand side of the distribution, raising the VaR. In some cases, market movements cause VaR to exceed its limits, leading portfolio managers to liquidate some of their holdings. The selling mania adds to the losing streak and reinforces the negativity.
  In sum, the steady increase in asset prices over the past few years led many people and models to become optimistic at the same time. Both may have dropped their guard a bit as values moved ever upward. Reflecting on recent events provides a renewal of perspective that may be valuable the next time around. That process should not stop prematurely, just because the equity markets seem to have righted themselves.


