Quick Read
- Equity option market pricing offers a unique way to quantify investor attention across growth, inflation, and policy events.
- In the second half of 2024 the risk premia associated with inflation releases declined relative to labor market data as the Fed shifted focus toward labor market and away from inflation risk. With elevated S&P 500 Index concentration and the market leadership of the artificial intelligence (AI) theme, some single company earnings (NVIDIA) have been rising risk events for the entire index.
- In our tactical multi-asset portfolios like the BlackRock Tactical Opportunities Fund, we entered 2025 underweight the S&P 500 versus a diversified set of non-US equity markets. This positioning was informed by pricing and flows insights. We have also added to directional short duration positions in US Treasuries as the market’s relatively benign perception of inflation risk has diverged from our inflation outlook.
Pay attention to macro news
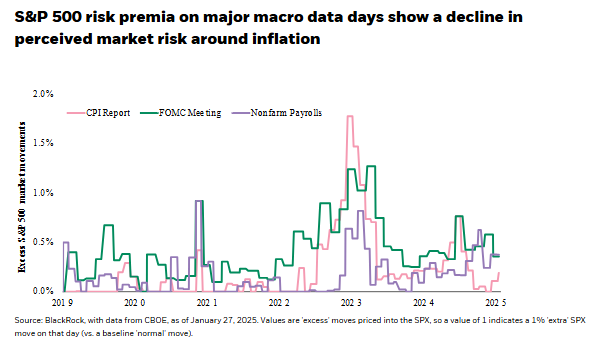
The types of macro events driving markets and dominating financial news and broker reports shift over time. Some periods are dominated by Federal Reserve meeting days, others by Consumer Price Index (CPI) or Non-Farm Payrolls (NFP), or even election days. We can quantify such shifts in attention by using index options data and looking at implied equity index moves.
Trading volumes in single-day S&P 500 options have been growing and, by linking them to macro news release dates, we can better understand shifts in how important the market believes these releases are for the broad equity market. The visual below plots the time series of event risk scores in recent years. As has been the case since the beginning of the monetary hiking cycle in 2022, Fed meeting days were typically the most important macro risk events for equities throughout 2024. This data also reveals an upward shift in relative importance of labor market data starting in the summer of 2024. That’s consistent with market concerns about a rising unemployment rate shifting focus away from the inflation side of the Fed’s dual mandate.

Elections and AI earnings
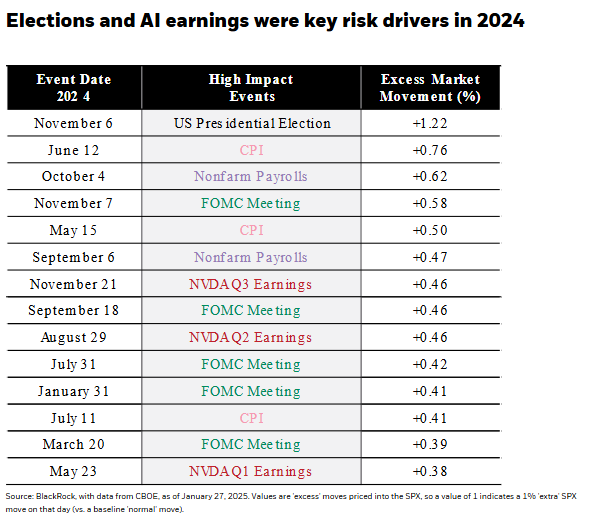
Another way that we can use daily options data to understand shifts in the relevant equity risk drivers is to simply look at the days with the highest risk scores and then match them to a calendar of macro events. The table below shows the highest implied equity volatility days for 2024 and the associated event. Unsurprisingly, the November election topped the charts and was followed by some of the growth, inflation, and policy days that were plotted in the chart above. This table also highlights an important micro driver of market-level risk in 2024 – three of the top 15 riskiest days for the S&P 500 in 2024 were NVIDIA earnings release days.
Single company corporate earnings do not typically influence the overall riskiness of a broadly diversified index, particularly one that contains 500 distinct companies. The ability of NVIDIA earnings days to impact overall S&P 500 excess volatility in 2024 provides some insight into two important and related phenomena that we believe will be important for risk assets in 2025:
-
Index concentration: The S&P is currently highly concentrated with the 10 largest companies comprising 38% of the index
-
AI themes: A constellation of outperformers across equity markets have been linked to AI-related themes, like US power demand
What do these views mean for portfolio positioning?
In our tactical liquid alternative portfolios like the BlackRock Tactical Opportunities Fund, we seek to deliver returns that are lowly correlated with stock and bond markets. We use macro data related to growth, inflation, policy and market pricing to seek out long and short investment opportunities across countries and asset classes.
Portfolio positioning shifted underweight US equities relative to non-US equities in the aftermath of the US election, driven primarily by pricing and flows insights. In our view, the elevated concentration of the US equity index in conjunction with unbalanced positioning makes the S&P 500 less attractive than non-US markets on a tactical horizon at the outset of 2025. We have also added to directional short duration positioning in US Treasuries informed by the market’s relatively benign perception of inflation risk despite rising upside risks to the inflation outlook.
Carefully consider the investment objectives, risks, charges and expenses of the funds carefully before investing. The prospectuses and summary prospectuses contain this and other information about the funds and are available, along with information on other BlackRock funds, by calling 800-882-0052 or at blackrock.com. The prospectus and, if available, the summary prospectus should be read carefully before investing.
Important Risks: The fund is actively managed and its characteristics will vary. Holdings shown should not be deemed as a recommendation to buy or sell securities. Stock and bond values fluctuate in price so the value of your investment can go down depending on market conditions. Investing in small-cap companies may entail greater risk than large-cap companies, due to shorter operating histories, less seasoned management or lower trading volumes. Investing in mid-cap companies may entail greater risk than large-cap companies, due to shorter operating histories, less seasoned management or lower trading volumes. Fixed income risks include interest-rate and credit risk. Typically, when interest rates rise, there is a corresponding decline in bond values. Credit risk refers to the possibility that the bond issuer will not be able to make principal and interest payments. International investing involves special risks including, but not limited to political risks, currency fluctuations, illiquidity and volatility. These risks may be heightened for investments in emerging markets. Asset allocation strategies do not assure profit and do not protect against loss. The fund may use derivatives to hedge its investments or to seek to enhance returns. Derivatives entail risks relating to liquidity, leverage and credit that may reduce returns and increase volatility.
The opinions expressed are as of February 2025 and are subject to change without notice.
Investing involves risk, including possible loss of principal.
This information should not be relied upon as research, investment advice, or a recommendation regarding any products, strategies, or any security in particular. This material is strictly for illustrative, educational, or informational purposes and is subject to change.
Prepared by BlackRock Investments, LLC, member FINRA.
©2025 BlackRock, Inc. or its affiliates. All rights reserved. BLACKROCK is a trademark of BlackRock, Inc. or its affiliates. All other trademarks are those of their respective owners.
USRRMH0225U/S-4250890
A message from Advisor Perspectives and VettaFi: To learn more about this and other topics, check out some of our webcasts.
© BlackRock
Read more commentaries by BlackRock