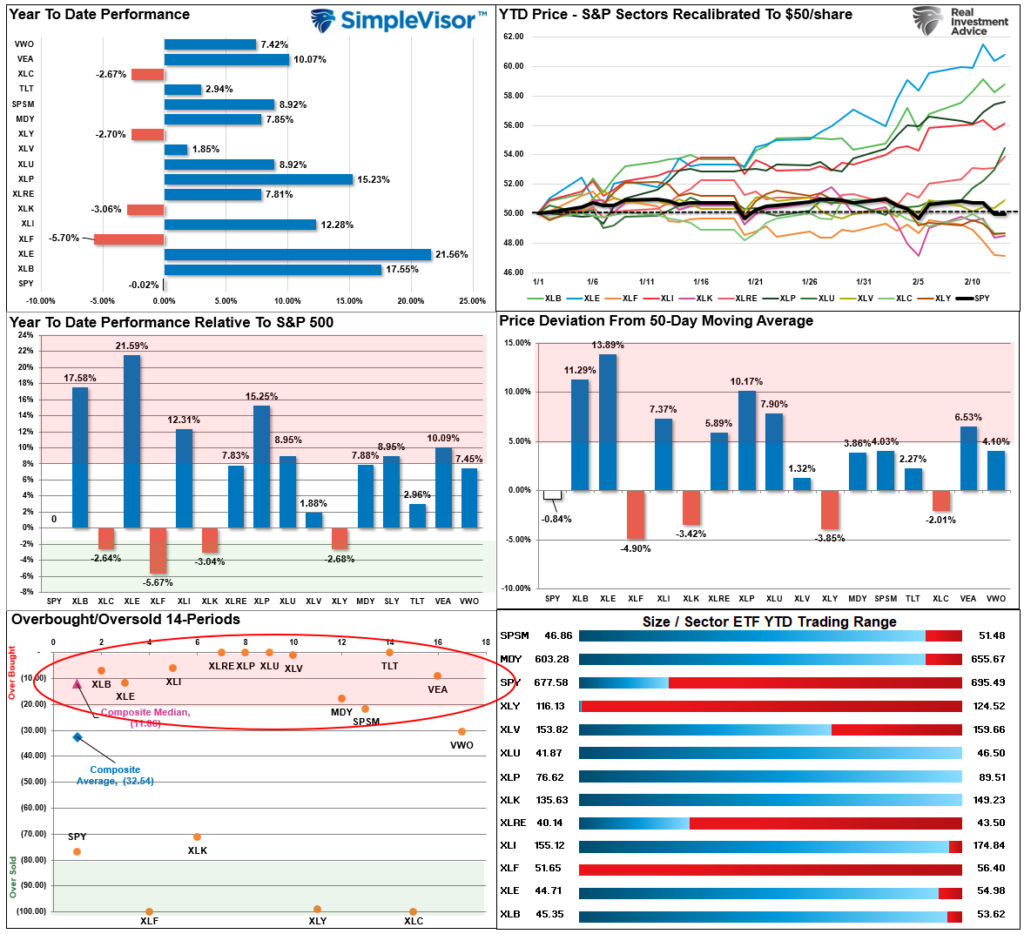
Since the beginning of the year, we have discussed the “reflation trade” and its impact on specific market sectors. This past weekend’s newsletter also showed some of these more extreme returns in various market sectors since the beginning of the year. To wit:
“Despite what seemed like a rough week in the market, it really wasn’t as most sectors and markets, outside of technology, moved into very overbought territory on a short-term basis. Energy, Materials, Industrials, and Staples, or rather “value,” have strongly outperformed every other market and sector this year. These areas are the most overbought, and a rotation back to growth seems increasingly obvious.”
There are several key takeaways from the analysis below.
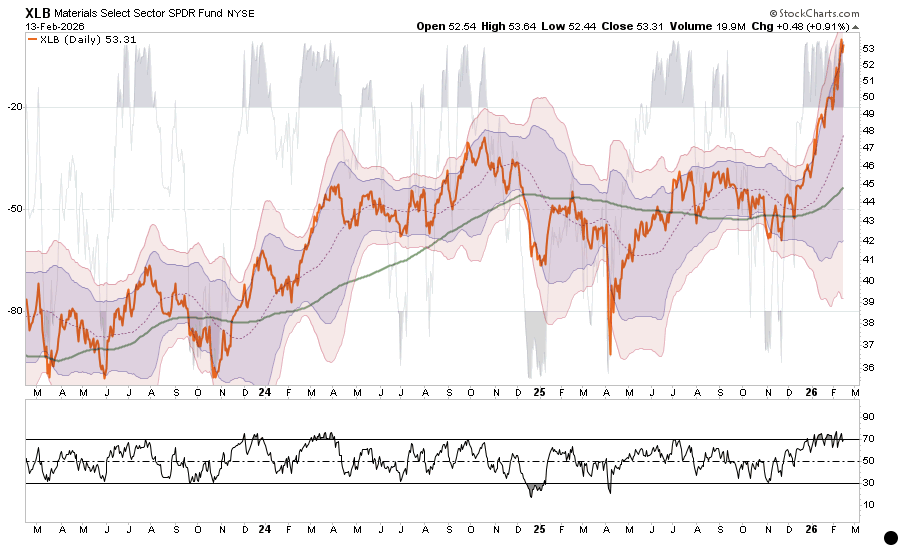
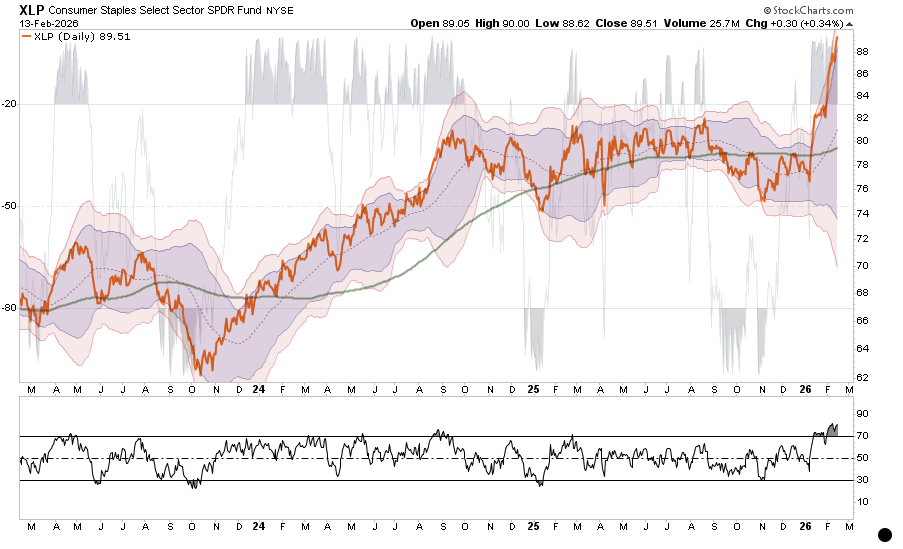
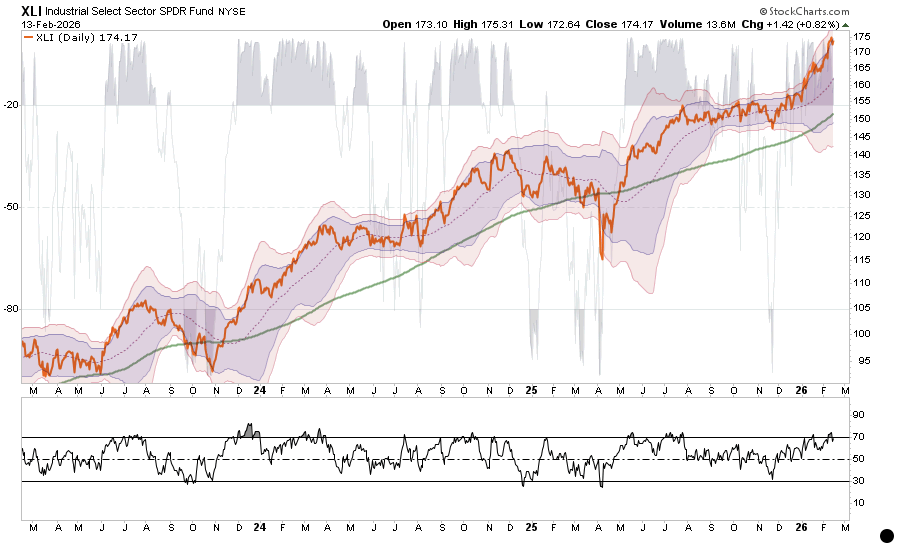
- Since the beginning of 2026, Staples (up 15%), Industrials (up 12%), Energy (up 21%), and Materials (up 17%) have vastly outperformed the market as a whole, which is effectively flat YTD.
- The performance differential of those sectors versus the markets, and the deviations from their 50-day moving averages, are at extremes.
-
While the overall market has been trading weakly since January, that is only a function of the largest market sectors, by capitalization, underperforming and are now oversold.

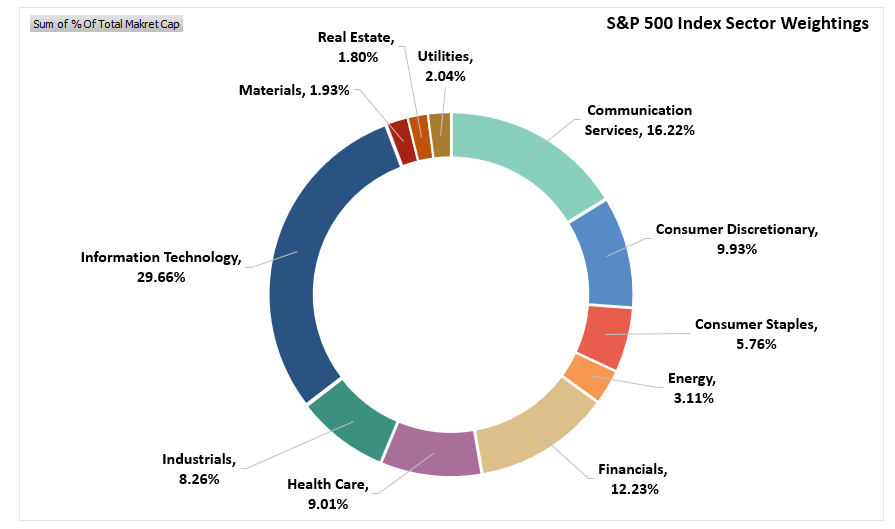
As shown below, those market sectors make up a relatively small portion of the overall index: Basic Materials (1.93%), Industrials (8.26%), Energy (3.11%), and Staples (5.76%). In other words, those 4 sectors combined (~19%) are smaller than the Technology sector alone (~29%). This also suggests that the relative outperformance of those sectors in recent weeks has more than offset the weakness in the Technology sector.
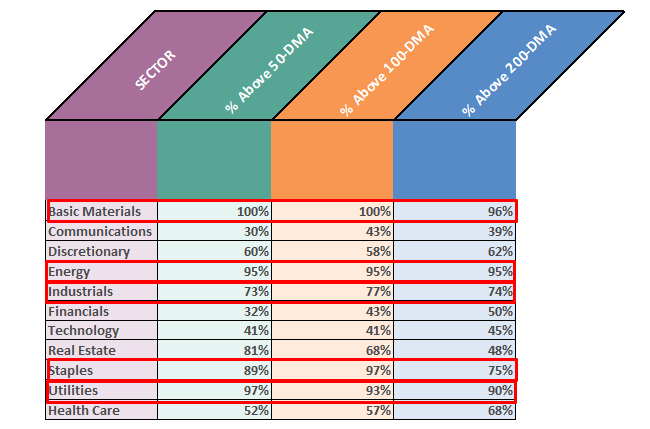
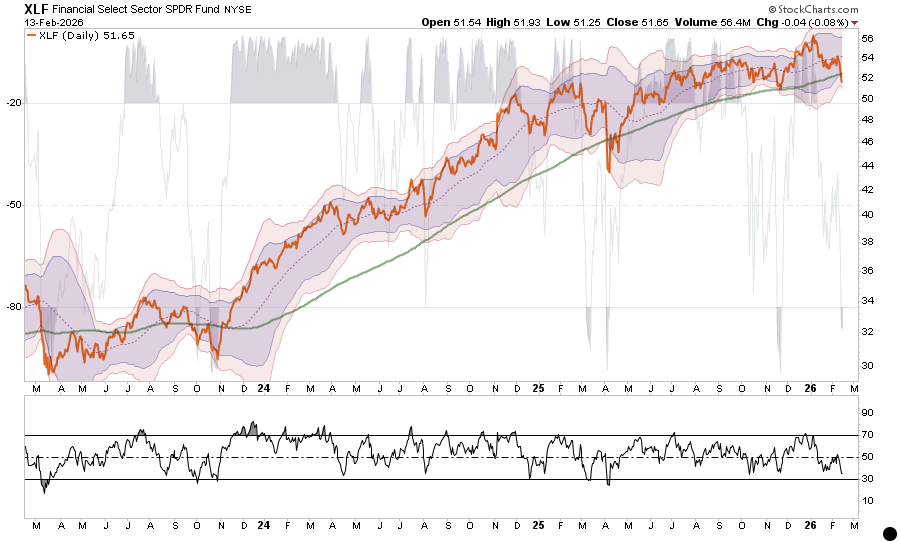
The breadth of those market sectors has also been extremely strong, with very high percentages of stocks in those sectors trading above their respective 50-, 100-, and 200-day moving averages, versus very low percentages in Communications, Technology, and Financials.
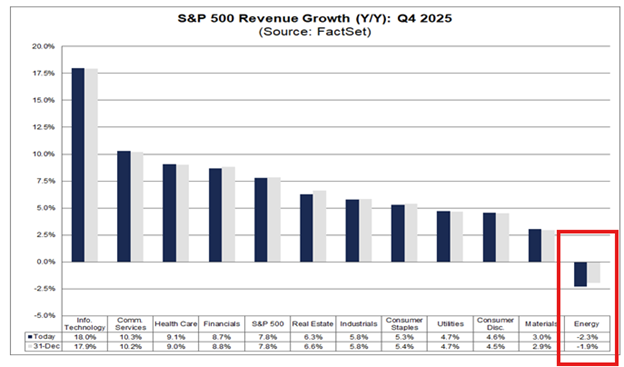
While the current outperformance of those select market sectors has been very enticing this year, the risk to investors comes if the “Reflation Narrative” falters for any reason. Those risks could come from a stronger dollar, falling inflation, or the realization that the overvaluation of these sectors has reached levels more historically extreme, given that these sectors have historically had some of the weakest revenue growth, particularly Energy.
With that said, since today is “Presidents’ Day” and the markets are closed, we will go through a technical review of each S&P 500 market sector, with a brief trading setup heading into next week.
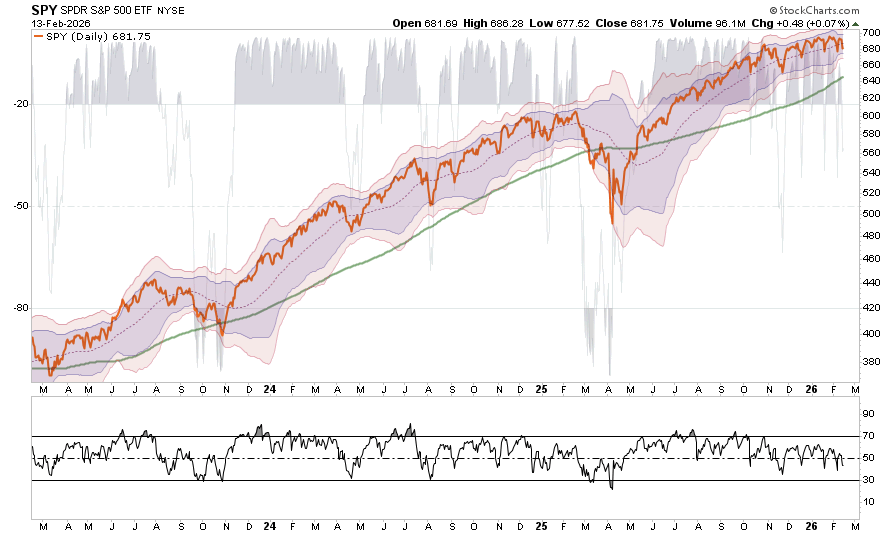
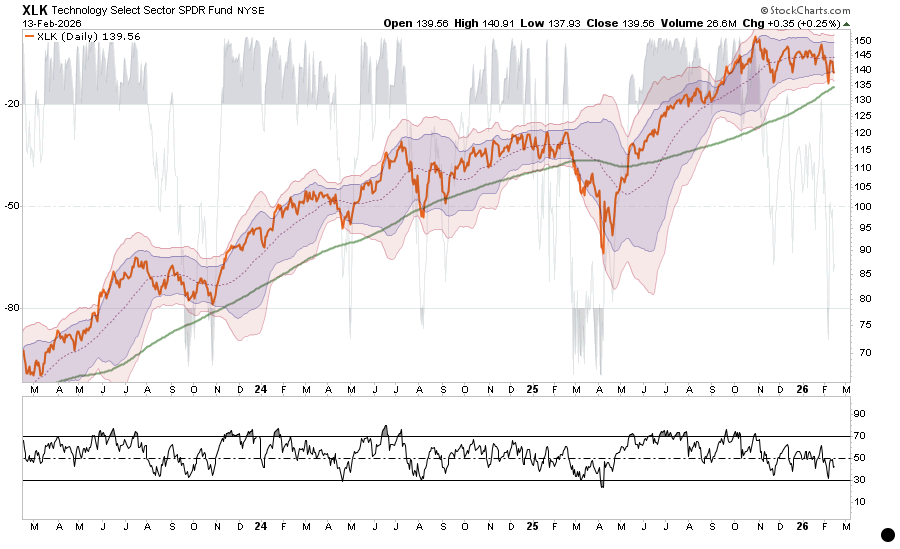
How To Read The Charts
Using the S&P 500 Index as an example, this brief tutorial explains how to read the charts.
- The red line is the daily price for the past 3 years.
- The shaded areas are Bollinger Bands, which track the price’s standard deviation relative to the underlying moving average. In our examples, we are measuring price at 2 and 3 standard deviations from the 50-day moving average.
- The green line is the 200-day moving average.
- The shaded grey area in the background is a Williams %R reading, which measures short-term overbought and oversold conditions.
- The bottom graph is a Relative Strength Index, which also measures overbought and oversold conditions.
Okay, let’s get to it.
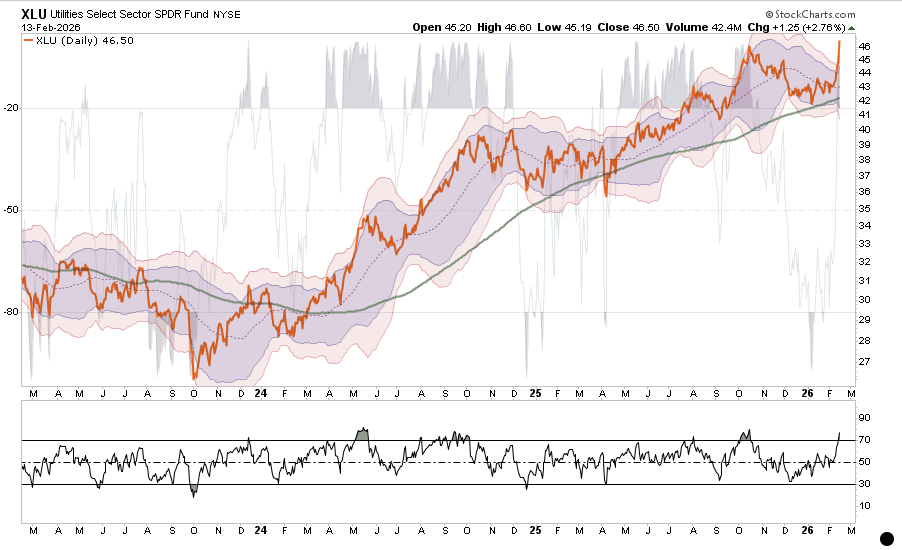
Utilities
- As we discussed last year, the Utilities sector was hated, and no one wanted to own the “boring” stuff. That tone has changed this year, with XLU surging through resistance and pushing well above the 3-standard-deviation level.
- However, the recent breakout to new highs for XLU is encouraging and could foster further buying. However, the extension does pose trading risk.
- With both longer-term readings overbought, higher prices are likely to become more problematic.
- Keep stops on trading positions at the 200-day moving average, which is key support.
- Action plan: Utilities are caught up in the reflation narrative, but the fundamentals don’t support the speculation. Hold positions but keep stops at the 200-day moving average.
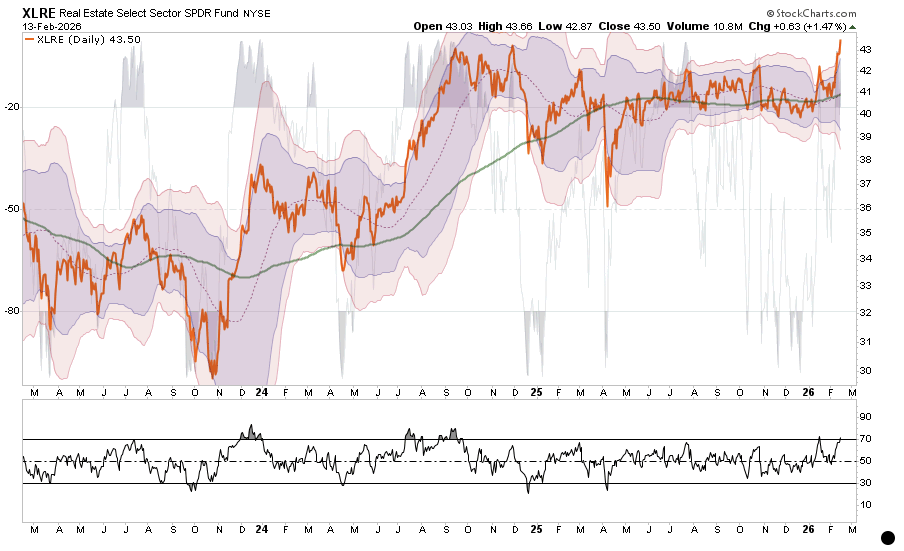
Real Estate
- Like XLU, Real Estate has also seen a sudden surge in buying interest, and money rotates from growth to value. However, a lot of the stocks in these sectors are trading more like growth than value. The extreme deviation above the mean in XLRE, like XLU, is a warning, but it can persist for some time. So hold positions but manage your risk.
- However, the 200-day moving average is nearby and provides a useful benchmark for both traders and investors to manage their risk exposures.
- With both longer-term readings nearing overbought levels, the risk of a correction is rising.
- Keep stops on trading positions at 41, which is the 200-day moving average for now.
- Action plan: Keep a watch on real estate for buyer exhaustion as the run is getting extended. Hold positions for now, but taking profits and rebalancing to target weights never hurts. The 200-day moving average remains key support.
Conclusion
The current bifurcation inside the S&P 500 raises investor risk as price leadership has shifted toward sectors with weaker fundamental momentum, as noted above. Energy, Utilities, Industrials, and Materials work best when inflation rises, rates rise, and growth stays steady enough to support pricing power. That is the “reflation trade” narrative, but recent economic reports are undermining it as growth slows, inflation and wages fall, and rates decline.
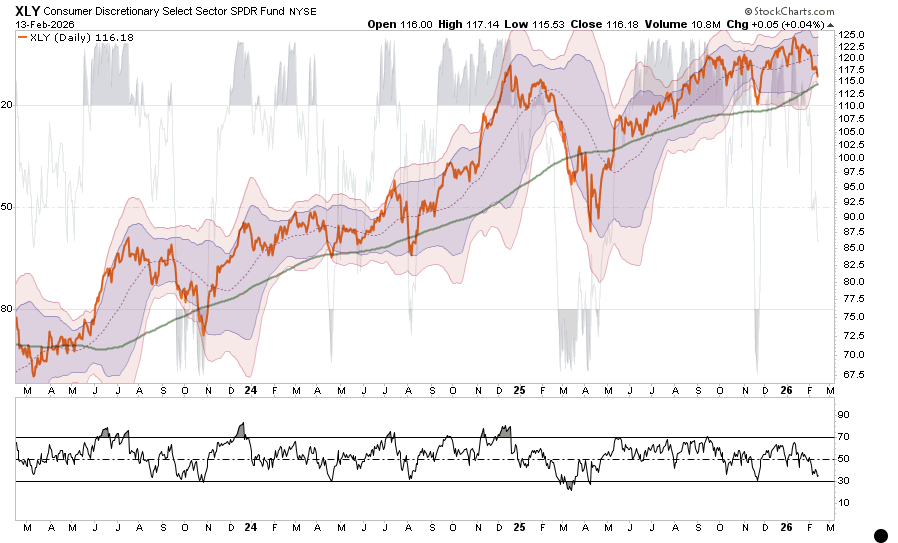
Furthermore, given that markets eventually trade on revenue and earnings growth rates, which foster valuation premiums, the Technology, Communications, and parts of Discretionary are seeing significant discounts to expected growth rates. As such, when capital crowds into slow-growth defensives and cyclical inflation hedges while selling the higher-growth complex, the index loses internal quality. As we have seen, breadth narrows, volatility rises, broad market rallies shorten, and drawdowns get faster once the rotation exhausts.
This setup also increases policy risk. If inflation data continues to cool or the market reprices the path of rates lower, the reflation trade tends to unwind quickly. Energy and Materials face demand risk; Industrials face order risk; and Utilities are exposed to rate sensitivity, especially if yields fall quickly after a risk event. At the same time, the growth sectors being sold often have the strongest balance sheets and the highest margins, so when selling pressure hits those areas, it often reflects de-risking rather than a negative impact on future growth.
If you are overexposed to the reflation narrative, consider taking some gains and reducing concentration. Tightening risk controls, rebalancing toward target weights, and starting to focus on quality growth and cash flow durability is a good start. If you are overexposed to growth, focus on trimming the weakest balance sheets first, then add back only after price stabilizes and leadership improves. The goal is balance, not a single macro bet.
Trade accordingly.
Lance Roberts is a Chief Portfolio Strategist/Economist for RIA Advisors. He is also the host of “The Lance Roberts Podcast” and Chief Editor of the “Real Investment Advice” website and author of “Real Investment Daily” blog and “Real Investment Report“. Follow Lance on Facebook, Twitter, Linked-In and YouTube Customer Relationship Summary (Form CRS)
Join RIA Advisors and elevate your career within a deeply experienced team focused on innovation. Our collaborative environment is built on a foundation of advanced technology and effective investment models, designed to enhance your ability to serve clients and grow your practice. Benefit from a supportive culture that encourages professional development and fosters a forward-thinking approach. By joining our team, you’ll be part of a group dedicated to excellence and continuous improvement, empowering you to focus on building meaningful client relationships and pursuing your business ambitions. Discover the advantages of working with our accomplished advisory team by starting your conversation today.
A message from Advisor Perspectives and VettaFi: Discover something new! Click here to register for our upcoming webcasts.
© Real Investment Advice
Read more commentaries by Real Investment Advice