The Epidemiology of Volatility Transmission: Part 2
Membership required
Membership is now required to use this feature. To learn more:
View Membership Benefits Advisor Perspectives welcomes guest contributions. The views presented here do not necessarily represent those of Advisor Perspectives.
This is part 2 of a two-part series on how volatility transmission mimics the spread of infectious disease and how investors can use VIX-linked securities as either a left-tail risk hedge or a distinct, tradable asset class. Part 1 can be read here.

Model behavior and term structures
“Essentially, all models are wrong, but some are useful.” – George E. P. Box (1919 – 2013)
What is volatility? The word has a noble origin. The Latin volatilis has several meanings, included winged, flying, swift, and fleeting and is derived from the verb volare, to fly. In modern English, the word volatility is also concerned with movement, variation and risk. In science, an everyday word can be expropriated and given a very precise meaning. Finance is no different. The Black, Scholes and Merton options pricing model assigned a mathematical definition to stock market volatility. Since then, in the valuation world, volatility was often been defined as the standard deviation (the square root of variance) of the log of the changes in value (or price) over a specified time period.1
Volatility can be modeled. There are stylized facts about volatility that need be incorporated into a volatility model. Several of those facts are that volatility is persistent in the short-run, means-reverting over the long-run (it has a half-life) and it is asymmetrical.2 A practical, useful volatility model should be able to forecast volatility. The 1927 Kermack-McKendrick Epidemiology Model – detailed in part 1 of this series – is a helpful proxy giving insight into how market volatility is transmitted.
Although volatility transmission parallels infectious disease spread like the 2020-2021 coronavirus pandemic, volatility is endemic – an ever-present threat. Volatility bouts are episodic, lying beneath the surface like a volcano and can erupt from an exogenous (external event) or an endogenous (internal cause). Because volatility is endemic, investors need to learn to live with periodic volatility spasms.
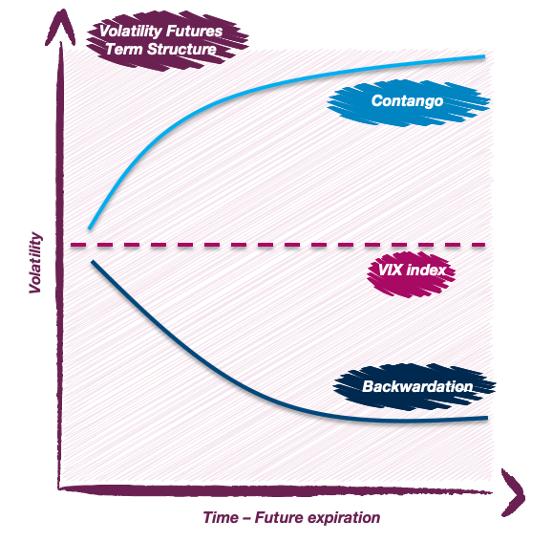
A key strand of volatility literature examines the evolution of implied and realized volatility across time. The market has a term structure that places a different level of uncertainty about asset prices over different time horizons. This results in upward or downward sloping term structures, versus a flat or inverted curve.3 The term structure of volatility is the curve depicting the implied volatilities of options with the same strike price but different maturities.
It forecasts the standard deviation of returns of various maturities. The term structure of volatility summarizes the forecasting properties of the second moment of distributions (the second moment is variance).4 Volatility can be forecast over different time periods. Typically, it is divided into one-day, 10-day, monthly and annual volatility of the particular asset or security traded.
Similar to the term structure of interest rates, the term structure of volatility has three components –level, slope and curvature. Because the VIX is an index and not an investable asset (replication is not feasible), the core method to attain exposure is via futures contracts. As you read on, you’ll understand the importance of the term structure of volatility and its proxy, the term structure of VIX futures as tools to mitigate portfolio risk.
Volatility forecasts are essential in risk management, derivatives pricing and hedging, market making, and portfolio construction. In spite of laboring in the halls of academia and the wanton desire of asset managers, there was no shortcut or heuristic for making calculated predictions of future stock market volatility. A volatility indicator or signal should forecast volatility. There was none until 1993, when an imperfect – but nonetheless informative – predictor of future volatility was born.
The Great Snake of Risk

(Image credit: Chris Cole of Artemis Capital Management)
Volatility – A tradable asset in portfolio construction
Why consider volatility as a separate asset class? Because it is endemic. Since the onset of the COVID crisis, central banks, including the Federal Reserve Bank, have sought to stabilize fundamentals, incentivize consumption and spur global growth to combat the effects of the pandemic. By suppressing volatility, central bankers can stimulate risk appetite. But often, central banks’ puts and “helicopter money” lead to complacency, inflation in commodities and economic instability. An exogenous risk event can disturb this fragile balance and trigger a reversal in investor sentiment.
For generations, investors have sought a way to hedge equity investments with assets that would reduce portfolio downside risk without giving up upside potential. There are several asset classes with returns that are, on average, negatively correlated with equities. However, many of those investments don’t deliver when called upon (e.g., 4Q 2007-1Q 2009 during the global financial crisis) or are cost prohibitive. There is plenty of evidence of increased correlation of asset classes in crisis periods (post 2004-2006) that implies the need for diversification has grown.5 Additionally, while left-tail-oriented products like long puts do very well in crash periods, they impose a significant drag on performance during bull markets.
A 2013 State Street Global Advisors’ study evaluated 10 specific tail-risk protection strategies. The performance drag (cost) of those strategies ranged from a low of 21 basis points (bps) for a generic trend-following strategy to a high of 355 basis points for a long-only strategy that bought one-month VIX futures contracts, which was due to the historical contango relationship in VIX futures (short-term VIX usually trades at a premium to spot VIX).
The commonly used tail-risk insurance method of buying put options exerts a large annual drag of 268 bps.6 Over time, the cumulative cost of the put buying protection outweighs the periodic benefit during crisis periods. Numerous academic and practitioners have found that the historical cost of puts, particularly out-of-the-money (OTM) and at-the-money (ATM) are too expensive to be justified.7 This reality check leaves portfolio managers with a catch-22 whether to buy expensive insurance or expose the portfolio to significant risk.
Most investors are net long equities and implicitly short volatility. Where do investors and their financial advisers turn to manage downside risk without having perfect market foresight? If a portfolio holds volatility as a tradable asset or with “portfolio completion” in mind, it makes traditional negative-correlated or counter-cyclical investments moot for hedging purposes. Over the last half century, volatility has evolved from being an input to calculate the price of an option to a central pivot point required to navigate global markets.
When considering volatility in a portfolio-completion context, volatility as a tradable asset can accomplish four varied investment objectives8:
- Capital preservation. Volatility-influenced investing strategies can protect portfolios by constructing tailored tail hedges.
- Risk premiums and enhanced beta. Volatility can be viewed as an alternative beta with diversifying returns that are either non- or low-correlated to equities. The variable risk premium (VRP) – the difference between implied and realized volatility – has become a popular source of alternative beta. Numerous investors attempt to harvest volatility premia.
- Portfolio efficiency. A 60% portfolio allocation to equities typically implies that the equity factor drives about 90% of the portfolio’s risk budget. Volatility scaling and “risk parity” investing use volatility targets to improve allocations to asset selection and to design a more robust portfolio when it comes to risk budgeting.
- Risk insights. Volatility awareness and management are essential in portfolio construction, monitoring and risk mitigation. Volatility levels, correlations and moments of probability distributions including skew (the third moment) and kurtosis (the fourth moment) can reveal discounted fear or complacency in the equity markets here and abroad.
A sound approach is to use volatility as a factor in portfolio completion. There is a wide opportunity set that includes VIX futures, options, exchange traded products (ETPs) and variance swaps (forward contracts) to harvest variance risk premia or hedge portfolio positions protecting against market downturns. An added benefit is to use volatility insights to create better betas and defensive equity strategies with significant upside participation while reducing tail-event losses.

The VIX fix – An antidote to viral volatility
In 1992, the Chicago Board Options Exchange (Cboe) turned to a Duke University finance professor on sabbatical. It had previously hired Robert Whaley for litigation support to defend it against a class action suit because of “…inordinately high levels of volatility” in options marketed by the Cboe. In ongoing conversations, Cboe executives and Whaley thought “…it would be really interesting to have an index on volatility.”9
Over the last four months of 1992, the Cboe gave Whaley a set of hard drives that contained the entire series of index-option price histories. With two powerful personal computers, he worked out a formula for the Cboe volatility index. The Cboe VIX® Index was unveiled on January 19, 1993.
The VIX is a measure of anticipated movements in the S&P 500, derived from the current traded prices of options (hereafter S&P 500 is shortened to SPX). The VIX, frequently called Wall Street’s “fear gauge,” is tracked by thousands of market participants. VIX® Index levels and trends are part of the everyday language of market commentary.
The VIX® Index was recalculated in 2003. The new VIX® Index is based on the S&P 500® Index (SPXSM) and estimates expected volatility by aggregating the weighted prices of SPX puts and calls over a wide range of strike prices. By supplying a script for replicating volatility exposure with a portfolio of SPX options, this new methodology transformed the VIX® Index from an abstract concept into a practical standard for trading and hedging volatility. The more embedded the use of volatility has become in markets, the more volatility has become a force.
The VIX® Index measures 30-day expected volatility of the SPX. The components of the VIX® Index are near- and next-term put and call options with more than 23 days and less than 37 days to expiration. These include SPX options with “standard” 3rd Friday expiration dates and “weekly” SPX options that expire every Friday, except the 3rd Friday of each month. Once each week, the SPX options used to calculate the VIX® Index “roll” to new contract maturities.
In May 2020, Crain’s Chicago Business asked Whaley what the original idea was behind the VIX. Whaley said, “In theory, what the index should be doing is giving you an expectation of the future realized volatility over the next 30-days. So, it’s not telling me the expected range of stock prices tomorrow… it’s telling me how anxious people are about the next 30-days.”10
Whaley has pointed out misconceptions of the VIX. The meaning of a given VIX level is frequently misunderstood. Whaley stated, “The VIX is nothing more than a put option on the SPX. You buy it like an insurance policy when you think the market is going to collapse. It’s as if you had a house on the coast and hear about an impending storm.” Adds Whaley, “what the VIX represents - expected future volatility - is loosely true and is a biased view due to asymmetry. You don’t buy insurance that the market will go up! It lacks that symmetry.”11
The VIX is a crowd-sourced estimate of the next 30-day volatility of the SPX using option prices. The VIX cannot be traded, like a stock or an ETF. It’s just a number – a mathematical calculation in the form of a weighted sum of mid quotes of OTM put and call options on the SPX. It is virtually impossible to replicate the VIX® Index. The number of put and call SPX options used to calculate the VIX can vary between 350-500. And throughout the trading day, the options could change every 15 seconds.12
Exchanges, investment banks and market makers have created derivatives that allow investors to hedge or speculate on the direction and level that the VIX® Index will take. VIX futures were introduced in March 2004 and VIX options were launched in February 2006. These derivative products allow investors to generate a payoff specifically tied to volatility. In 2009, VIX-linked ETPs came to market. They allow institutional investors whose investment policy statements prohibit short-selling or using derivatives to gain access to exposures that track the VIX.
The VIX® Index allows investors to potentially harvest variance risk premiums significantly different from zero.13 Over complete market cycles, the VIX Index® has been a consistently negatively-correlated, coincident indicator of near-term implied volatility.
Slow moving expectations about volatility lead investors to initially underreact to volatility news followed by a delayed overreaction. In normal times, the VIX usually over-estimates volatility. But in times of market crashes and crisis (including the onset of COVID-19 pandemic), the VIX® Index systematically under-estimates volatility.14
More sophisticated and skilled traders react quicker to changes in volatility. If VIX options or futures are mispriced, those traders can sell volatility, reaping the potential rewards of a variable risk premium offered periodically. There is evidence that the variable risk premium predicts returns much more strongly than either implied or realized (historical) volatility.15 Selling volatility allows traders to make money on both a decrease in market volatility and time decay associated with options and futures contracts.
The extreme demand for portfolio hedges suggests all is not well for the U.S. stock bull run, coupled with extended lockdowns in select countries and inflationary fears. The average daily closing level for the VIX® Index over 30 years (1990-2019) was 19.1 (median value was 17.2). But despite the VIX® Index trending under its historical average and median value since the pandemic began, a deluge of technical indicators show investors are still bidding up downside protection.
The VIX term structure is the thing to watch
Financial advisors and investors – including so-called smart investors – are to be forgiven for thinking that the absolute level of the VIX® Index is the thing to watch. Here’s the real deal. It’s the term structure of volatility and the slope of the VIX futures curve that matters most – not whether the VIX® Index is at 10, 20, 30 or 40.16
By design, the VIX futures term structure possesses information content that the VIX® Index term structure does not. The former reflects the market’s opinion about the evolution of the VIX® Index (future investor risk appetite), while the latter is a projection of ex-post realized volatility in the SPX.17 The difference between the VIX spot and VIX futures price is referred to as the futures basis. The futures basis reflects the difference between expectations for short- and long-term volatility.
Like all futures contracts, VIX futures have a term structure. The VIX futures term structure is typically upward sloping (contango), meaning shorter-dated VIX futures trade at a discount to longer-term ones. The longer dated a futures contract is, the greater risk of an unforeseeable event moving the SPX considerably, and as a result, the greater the premium required and upward slope of the VIX futures curve. This means that VIX-linked ETPs are in a quasi-permanent state of decay by constantly buying pricier longer-date VIX futures and selling cheaper VIX futures about to expire.
As the VIX is composed of conditional volatility expectations and a risk premium, the shape of the VIX term structure reflects both the expected path of future volatility and different risk premia associated with variance risk at different maturities (VIX futures contracts’ expiration). Because the VIX® Index tends to rise far more rapidly than it falls, the market sells futures above the average historical settlement. Like an insurance premium, sellers take on the risk of an increasingly volatile market and the future settling at higher levels for an upfront price premium.
The curve rarely inverts to downward sloping (backwardation) unless volatility is exceptionally high and deemed unsustainable. There are two complementary explanations for a downward sloping VIX term structure: the markets expect return variance to decline, and exposure to short-term variance risk commands a larger premium than exposure to long-term variance risk.18 Whenever the VIX futures term structure is in backwardation, investors have the potential to earn a positive roll yield from VIX futures.
Rope-a-dope the VIX term structure slope
Muhammad Ali famously used the rope-a-dope in his 1974 “Rumble in the Jungle” match against George Foreman. Ali was a 4-1 underdog against the undefeated, knockout artist George Foreman. Several sports writers have called this fight, “arguably the greatest sporting event of the 20th century.”19 In this technique, the boxer keeps his guard up, prepared for incoming blows while looking for openings to counter-punch. Being in a defensive position, the boxer decreases the chances of being caught off guard. A similar technique can be used by vigilant investors to protect against severe market drawdowns by reacting to changes in the Slope of the term structure of volatility.
Some academic research indicates that the second principal component of the term structure – the slope –more reliably predicts variance asset returns than the other term structure components when it comes to solving the variance risk premia puzzle.20 The failure of the level factor is particularly surprising because most volatility models predict that variance risk premia should be larger when the VIX® Index level is higher.21 The evidence that this researcher presents is that the “slope summarizes all economically-meaningful information about variance risk premia in the VIX term structure”.22
Investors, baited by the potential for outsized rewards from spikes in the VIX, have continued to pour money into long VIX-linked securities despite mounting losses. Whaley, the father of the VIX® Index, has written, “The most popular VIX ETPs are not suitable for buy-and-hold investments and are virtually guaranteed to lose money.”23
In fact, a long position in the SPX VIX® short-term futures index would have lost almost all of its value if opened in January 2009 and held through 1H 2021. You just can’t “set-it and forget it” with VIX-linked derivatives. Volatility is meant to be traded by skilled investment professionals, not by amateur VIX day traders.
One particularly attractive completion strategy is constructing a portfolio that holds most of its wealth in an S&P 500 Index® complemented by a VIX-linked securities allocation. Astute investors can use an inexpensive SPX beta source (e.g., SPY-ETF) and add in VIX derivatives when needed as a buffer against future volatility spikes.
The allocation to VIX-linked securities might range from a 10 to 30% weight – depending on the market regime. The balance of the portfolio is invested in SPX. Since the VIX-SPX portfolio captures the asymmetrical relationship between volatility and returns, it can arrest most of the downside risk that investors wish to avoid. The fact that the portfolio does not capture the extreme skewness in the S&P 500 is a tradeoff to hedging most, but not all, of the downside risk.
Volatility as an asset class or in the context of portfolio completion is compelling. Volatility and equity market returns are anti-correlated – an effect known as asymmetrical volatility. And its negative correlation increases when market declines accelerate. As a result, long exposure to volatility can provide increasing levels of portfolio protection when turbulence strikes – exactly when it is needed most. The asymmetric profile of volatility manifest in VIX-linked securities means that a relatively small allocation of capital can provide meaningful downside protection.
Financial advisor action steps
1. Attend an “epidemiology of volatility” continuing education webinar. Financial advisors interested in learning more about The Epidemiology of Volatility are encouraged to attend a Little Harbor Advisors’ sponsored webinar on the topic. This program is accredited for one-hour of continuing education credit for CFPs, CIMAs, CPWAs & RMAs. If you’d like to learn more, please go to www.lharesearch.com and register for an upcoming webinar.
2. Read Narrative Economics by Dr. Robert Shiller or Rules Of Contagion by Dr. Adam Kucharski.
Rick Roche is a 40-year industry veteran, Chartered Alternative Investment Analyst (CAIA) and Managing Director at Little Harbor Advisors, LLC. Little Harbor Advisors is a sponsor of volatility-influenced and risk-responsive investing strategies. Rick is a frequent speaker at CFA Societies and Financial Planning Association (FPA-CFP) Chapter events.
1“FX Volatility – An Evolutionary Story”, Commerzbank. Jun 29, 2015.
2Engle, R., and Patton, A., “What Good is a Volatility Model?”, Quantitative Finance, Oct 15, 2000. (NB: Robert F. Engle won the 2003 Nobel Prize in Economic Sciences for his path-breaking discovery of a method to analyze unpredictable movements in financial market prices and interest rates.)
3Asensio, I., “VIX Futures Term Structure and Expectations Hypothesis”, SSRN, Apr 2019.
4Ibid., Engle & Patton.
5Szado, E., “VIX Futures and Options: A Case Study of Portfolio Diversification During the 2008 Financial Crisis”, Journal of Alternative Investments, 2009.
6Benson, R., Shapiro, R., et al., “A Comparison of Tail Risk Protection Strategies in the U.S. Market”, (2013), Alternative Investment Analyst Review 1Q 2013.
7Doran, PhD, J., “Volatility as an Asset Class: Holding VIX in a Portfolio”, Jan 2, 2020.
8“The Role of Volatility in Portfolio Completion”, Capstone Investment Advisors, 2020.
9Asmundsson, J. 2020. “The Father of the Fear Gauge Feels Reassured by the VIX”, Crain’s Chicago Business, May 15, 2020.
10Ibid, Asmundsson, J. 2020.
11Ibid, Asmundsson, J. 2020.
12Osterrieder, J., Roschli, K., & Vetter, L., “The VIX Volatility Index – A Very Thorough Look At it”, Jan 7, 2019.
13Bollerslev, T., Todorov, V., & Xu, L., “Tail Risk Premia and Return Predictability”, Mar 15, 2015, page 1.
14Ibid, Osterrieder, J., Roschli, K., & Vetter, L., 2019.
15Lochstoer, L., & Muir, T., “Volatility Expectations and Returns”, Sep 25, 2019.
16Johnson, T., “Risk Premia and the VIX Term Structure”, Jan 2016
17Ibid., Asensio, I., Apr 2019.
18Ibid., Johnson, T., Jan 2016, page 1.
19Wikipedia, “The Rumble in the Jungle”, accessed on 06-15-21.
20Ibid., Johnson, T., Jan 2016, pages 5, 16.
21Ibid., Johnson, T., Jan 2016, page 18.
22Ibid., Johnson, T., Jan 2016, page 19.
23Whaley, R., “Trading Volatility: At What Cost?”, SSRN, May 6, 2013.
Membership required
Membership is now required to use this feature. To learn more:
View Membership BenefitsSponsored Content
Upcoming Virtual Events View All