Can SpaceX Fire on All Cylinders?
Membership required
Membership is now required to use this feature. To learn more:
View Membership Benefits Advisor Perspectives welcomes guest contributions. The views presented here do not necessarily represent those of Advisor Perspectives.
SpaceX's June IPO raised $75 billion, resulting in an initial valuation of $1.77 trillion, making it the largest IPO in history. SpaceX, encompassing its launch business, Starlink, and the recently merged xAI, peaked at a $2.64 trillion market cap in its first week of trading, briefly tying with Amazon as the fifth-largest publicly traded company. After only a month, the enthusiasm is rapidly fading.
Perhaps most amazing is that the fanfare is occurring despite SpaceX producing a net loss of nearly $5 billion in 2025. Based on its $1.84 trillion market cap as of the time of writing this, investors are clearly not worried about the present. They are excitedly pricing in astronomical growth for SpaceX.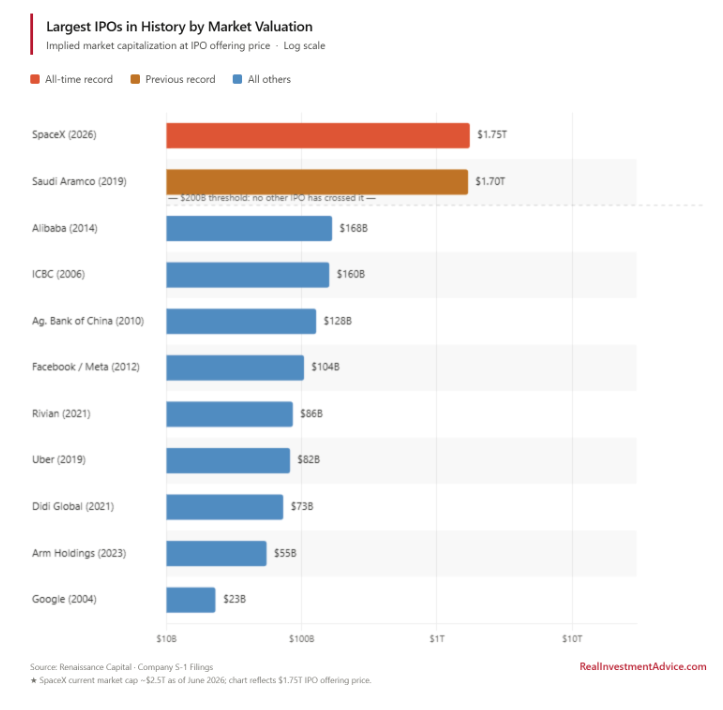
To evaluate SpaceX from a fundamental perspective, investors need to quantify the implied growth in its valuation and compare it with both their own and market forecasts. In this article, we attempt to help by providing context for growth expectations, using Amazon’s history as a proxy.
Amazon, like SpaceX, was priced at expensive valuations and ultimately delivered on those expectations. Initial Amazon investors who held through the dot-com crash and years of zero earnings have been rewarded roughly 3,300-fold, averaging about 32% annualized over nearly three decades.
So, the question we pose is: What does the Amazon playbook require of SpaceX?
Amazon’s Growth Trajectory
Amazon went public in May 1997 at $18 per share, valuing the online bookseller at $438 million. Revenue that year was $148 million. The market was pricing its shares at a price-to-sales (P/S) multiple of roughly 3x.
At the time, the ratio was generous for a money-losing start-up, but defensible given that Amazon was doubling revenue every year. Importantly, those who envisioned that Amazon was much more than an online bookstore and appreciated its growth potential must have thought its price-to-sales ratio was dirt cheap. followed was one of the greatest periods of sustained revenue expansion in corporate history. Amazon crossed $19 billion in annual revenue in 2008, only 11 years after going public with $148 million in revenue.
In 2025, the company generated $716 billion in revenue, putting it on par with Walmart as the highest-revenue company in the U.S. Since its IPO, revenue has grown nearly 5,000-fold.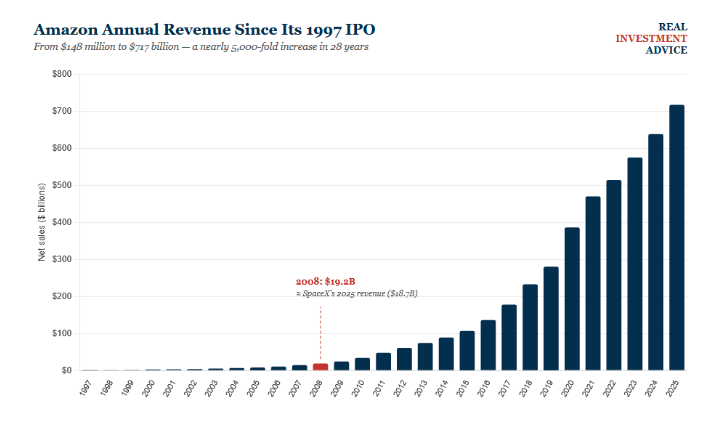
That trajectory is nearly unprecedented. Can SpaceX also fire on all cylinders?
SpaceX Today vs. Amazon Then
In 2008, Amazon generated approximately $19.2 billion in revenue, nearly identical to SpaceX's $18.7 billion in 2025. Amazon's market cap in 2008 was just under $40 billion, implying a P/S multiple slightly above 2x. SpaceX, with a $1.84 trillion market cap and $18.7 billion in sales, trades at a P/S multiple nearing 100x. The market is pricing SpaceX at approximately 50 times the multiple it gave Amazon at the same revenue level.
While the ratio difference sounds extreme, there are reasons to argue SpaceX deserves a premium:
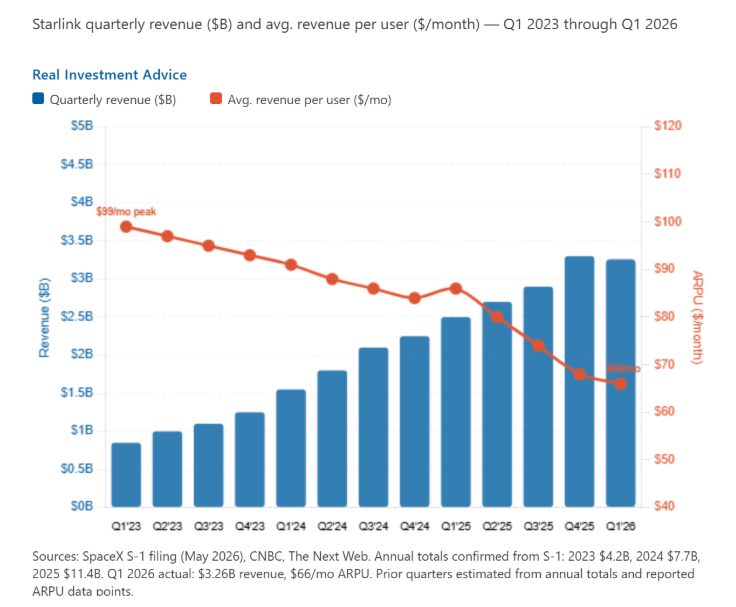
- Its rapidly growing Starlink business generates $4.4 billion in operating income, with revenue compounding at a 50% growth rate. However, its revenue growth is slowing, and average revenue per customer is declining.
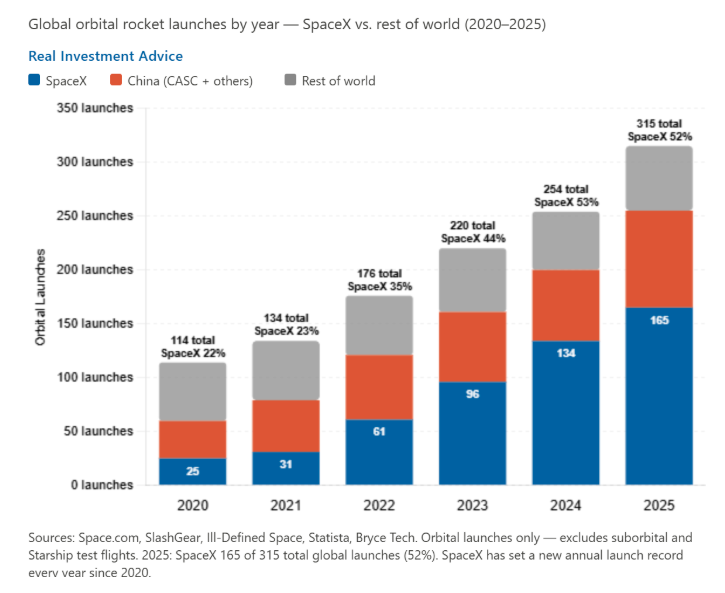
- The reusable launch business accounts for over 50% of orbital rocket launches. But competition is increasing rapidly, especially from the well-funded Blue Origin, Jeff Bezos' rocket venture.
- There is promise in its AI infrastructure business through the xAI merger, but Anthropic’s Claude, OpenAI’s ChatGPT, Alphabet’s Gemini, and new open-source models like Moonshot AI’s Kimi-K3 appear to hold a meaningful advantage.
The way to rationalize a near triple-digit P/S multiple is through extraordinary, historically unprecedented growth. So, let's quantify "extraordinary."
SpaceX's Implied Growth Rate
Let's work backward from SpaceX's $1.84 trillion market cap to gauge the growth needed to satisfy the market's implied forecast. To do so, we assume that investors demand a 20% annual return. While lofty, this is roughly one-third below the 32% Amazon has delivered since its IPO.
If SpaceX shares compound at 20% per year for the next 10 years, its market cap will reach $11.4 trillion by mid-2036, implying a share price near $860, assuming no new equity issuance.
With that proxy $11.4 trillion market cap in hand, the only remaining variable is the P/S multiple investors will pay for a mature SpaceX. That multiple determines the revenue it must produce. Consider two scenarios.
Scenario One
SpaceX matures like Amazon. Today, Amazon — after 29 years of dominance across e-commerce and cloud computing — trades at roughly 3.7 times trailing sales. If SpaceX has the same multiple in 2036, it will generate about $3.1 trillion in annual revenue. For context, that approximates the entire GDP of France and roughly one-tenth of U.S. GDP. The implied revenue growth rate that clears this hurdle is 67% per year, compounded over 10 consecutive years.
Scenario Two
SpaceX retains a higher premium multiple. A more generous P/S assumption eases the required revenue growth, but the implications are still daunting. At a P/S ratio of 20x in 10 years, the required 2036 revenue falls to about $570 billion, roughly three-quarters of what Amazon generates today, and a level Amazon needed 27 years to attain. The implied growth rate is substantial at 41% per year for a decade.
To fully appreciate what a P/S of 20 means, we share the ratio of the 20 largest U.S. stocks below. Broadcom at 29.2 and Nvidia at 24.9 are the only two above 20, and both are growing rapidly with enormous profits.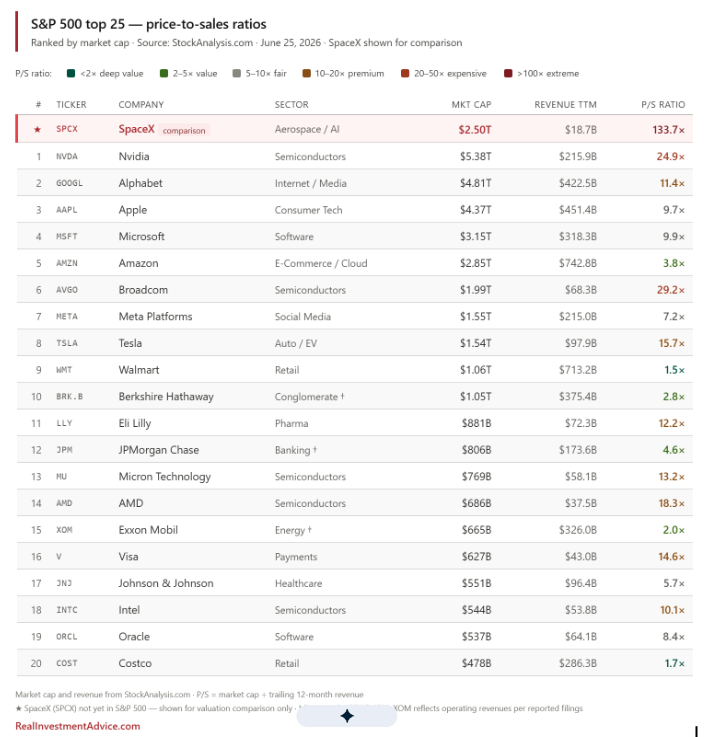
Amazon's single best 10-year revenue stretch, from 1997 to 2007, produced a 59% compound annual growth rate. But it started with $148 million in sales and was just beginning to expand beyond books. SpaceX began at $18.7 billion, 126 times Amazon's starting point. Achieving growth rates from a small base is significantly easier than from a large one, which is precisely why only a handful of companies have ever sustained growth above 40% for a full decade.
Time Out: What a P/S of 20 Implies
It's worth pausing to stress what a P/S ratio of 20 implies. The best way to do so is to share the advice Scott McNealy from Sun Microsystems gave his shareholders in 2002:
At 10 times revenues, to give you a 10-year payback, I have to pay you 100% of revenues for 10 straight years in dividends. That assumes I can get that by my shareholders. That assumes I have zero cost of goods sold, which is very hard for a computer company. That assumes zero expenses, which is really hard with 39,000 employees. That assumes I pay no taxes, which is very hard. And that assumes you pay no taxes on your dividends, which is kind of illegal. And that assumes with zero R&D for the next 10 years, I can maintain the current revenue run rate. Now, having done that, would any of you like to buy my stock at $64? Do you realize how ridiculous those basic assumptions are? You don’t need any transparency. You don’t need any footnotes. What were you thinking?
Elon Musk's Growth Forecast
Elon Musk's forward guidance warrants caution, as it is very aggressive. Days after the IPO, Musk posted the comment below on X: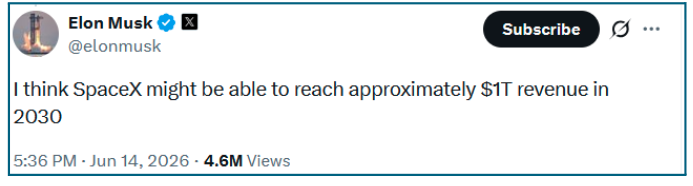
Growing from $18.7 billion in 2025 to $1 trillion in 2030 is a 53-fold increase in five years — a compound growth rate of roughly 122% per year. This is more than double Amazon's best-ever pace and from a base thousands of times larger.
Suppose Musk delivers. The shareholder outcome still hinges entirely on the multiple. If the market awards a $1 trillion revenue base Amazon's current 3.7x P/S valuation, SpaceX's 2030 market cap would be roughly $3.7 trillion, about a 17% annualized return from today's price. At 20x, the same revenue produces a $20 trillion valuation and returns near 70% annually.
A 17% to 70% range on identical fundamentals illustrates the difficulty in our analysis: both variables — sales and the multiple — are unknowable, and the multiple alone can swing the outcome from ordinary to absurd.
Wall Street's Wide View
To be clear, SpaceX is unique. Starlink's subscriber economics provide a sustainable revenue base; the launch business has pricing power that thus far has not been challenged, and an xAI integration could, in the most optimistic scenario, open multiple trillion-dollar markets quickly. That said, analysts must carefully discount even the most tremendous forecasts.
Models from the SpaceX IPO underwriters sit far below those of Elon Musk. Morgan Stanley projects roughly $330 billion in revenue in 2030, and Goldman Sachs sees about $470 billion — both fractions of Musk's $1 trillion.
New Street Research, which initiated coverage with a $165 target, acknowledged the bullish thesis could work but noted investors need a "20 to 25-year time frame" for the math to resolve favorably.
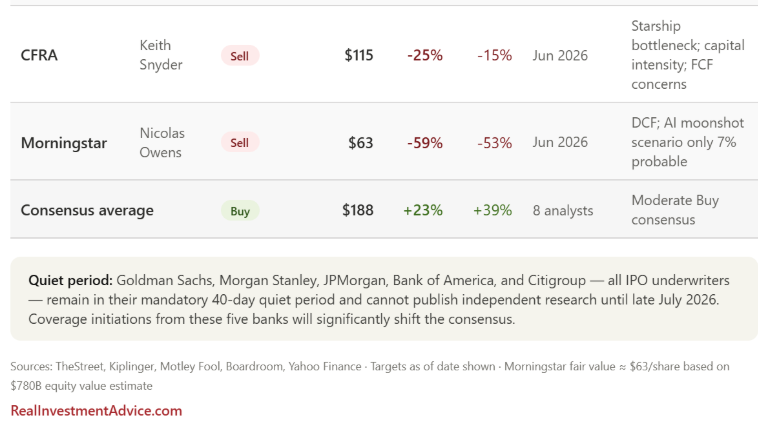
Morningstar, by contrast, set the fair value for SpaceX at $63. As we share below, the $63 to $401 range of analyst price targets reflects the uncertainty surrounding the company’s potential.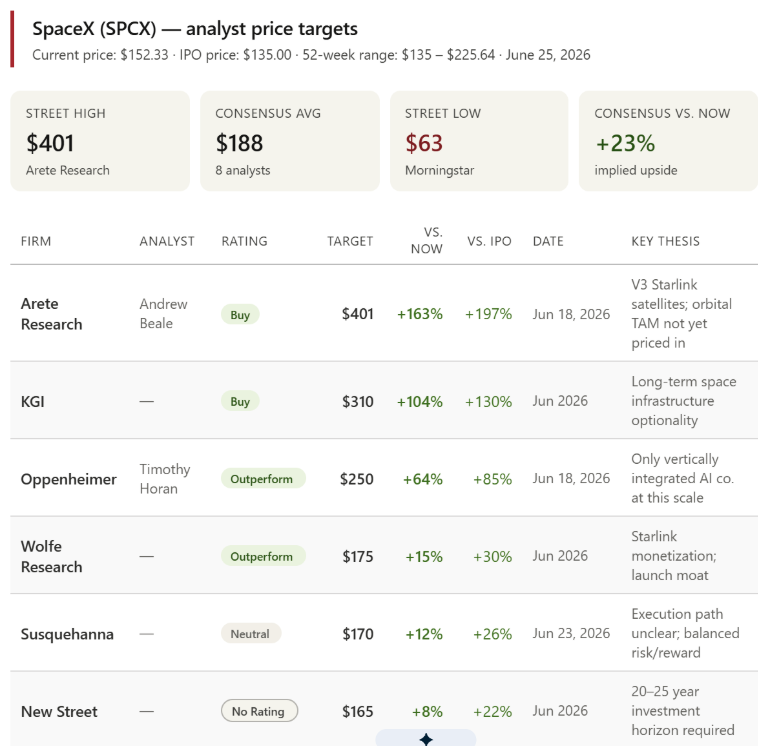
Summary
Amazon rewarded patient investors immensely, but it did so from a mere $438 million IPO valuation. Compounding from $1.84 trillion, as SpaceX tries, is harder by orders of magnitude. SpaceX can be a great company and still prove disappointing to its shareholders. To justify today's price, its growth must be historically unprecedented, at a scale at which no company has ever operated, and must continue for longer than any growth cycle has ever lasted.
While that may sound bearish, this analysis doesn’t make SpaceX uninvestable. The stock will cycle through bullish and bearish periods as momentum ebbs and flows along a likely volatile path. Accordingly, traders will find plenty of opportunities on both sides. For those looking to buy and hold, however, the odds seem lofty. But Musk has a proven track record of success, so it's too early to count SpaceX out.
Can SpaceX do what only a very small handful of companies have ever done, or is the market once again pricing in a future that gravity will eventually catch up with?
Read more by Michael Lebowitz:
- Headwinds & Tailwinds: Minding The Market Weather
- Yield Curves & Style Rotations: Omen or Deception?
- More Market Wisdom From Jesse Livermore
Michael Lebowitz is a portfolio manager with RIA Advisors and author for Real Investment Advice. For more information, contact him at [email protected] or 301.466.1204.
Join RIA Advisors and elevate your career within a deeply experienced team focused on innovation. Our collaborative environment is built on a foundation of advanced technology and effective investment models, designed to enhance your ability to serve clients and grow your practice. Benefit from a supportive culture that encourages professional development and fosters a forward-thinking approach. By joining our team, you’ll be part of a group dedicated to excellence and continuous improvement, empowering you to focus on building meaningful client relationships and pursuing your business
A message from Advisor Perspectives and VettaFi: Discover something new! Click here to register for our upcoming webcasts
Membership required
Membership is now required to use this feature. To learn more:
View Membership BenefitsSponsored Content
Upcoming Virtual Events View All