I love meeting with clients. Sharing insights and engaging in lively dialogue about their fears, concerns, wants and needs, our ideas and strategies, and the ever-evolving capital markets… what’s not to love? Well, maybe one thing. Downtime in reception areas, which inevitably leads to perusing the client’s selection of industry publications and coffee table books. Over the years and lobbies, I have only found one truly worthwhile lobby book: Poor Charlie’s Almanack: The Wit and Wisdom of Charles T. Munger. Charlie, of course, is Warren Buffet’s longtime right-hand man, business partner, and friend since 1959, and the book offers worldly insights on Charlie’s thoughts about decision-making, investing, and life.
When describing some of the “idiocy of investment management,” Charlie tells a story of an encounter with a fishing tackle salesman who was selling lures that bore little resemblance to fish. “I asked him, ‘My God, they’re purple and green. Do fish really take these lures?’ And he said, ‘Mister, I don’t sell to fish.’” (Munger, 2008). The analogy is a good one. Investors often buy what they think is exciting, sophisticated, and complex with the embedded assumption that all of these attributes will lead to greater returns. We see this today where we witness the continued explosive growth of hedge funds. But, a careful examination of the data reveals that these fancy lures fail to hook as much in excess, after-fee returns as more time tested strategies.
The Expectations Gap
Research Affiliates is on record stating that future capital market returns will be lower, indeed much lower, than the experience of past decades. Lower yields essentially assure this outcome (even as falling yields create outsized gains, raising client expectations!).
In mainstream stocks and bonds, we witness paltry yields and still high valuations by historical standards—hardly the sorts of levels indicative of a new secular bull. As of the end of March 2013, the price/earnings ratio (as measured by trailing 10-year earnings) is 23 for the S&P 500 Index, approximately 37% above the long-term average.1 The yield on core bonds, as measured by the BarCap Aggregate Index, stands at 1.86% as of March 31, 2013.
By combining stock and bond return estimates in a typical balanced construct of 60% stocks and 40% bonds, we arrive at a sobering long-term return estimate of approximately 4%. A 4% return isn’t terrible, especially when banks pay us about zero. It only seems dreadful when we are planning, based upon an historical accident of outsized returns experienced in our lifetime, for much more.
This leaves virtually all balanced portfolios between a rock and a hard place. Accept lower prospective returns or go for broke in a quixotic quest to make 8%. Today, we see too many investors trying to go for the latter. But, singed by two nasty bear markets in a decade and rolling bursts of volatility, they are leery of risk, which makes them prey to anyone willing to tell them what they want to hear. Who among us doesn’t want less risk and more reward?
Enter the hedge fund and its implicit promise of absolute returns, largely independent of market direction. Some investors, notably mega endowments, have reaped both outsized returns and substantial diversification from these investments. Alas, while there are terrific hedge funds out there, most observers would agree that not everyone can hire them. As our own Chris Brightman (formerly of the endowment world) likes to say, “The hedge funds that produce these kinds of results will never manage your money.”
Nevertheless, hedge funds’ popularity and increasing adoption can’t be disputed. But on average, do they hedge (reduce risk) and do they fund (i.e., deliver returns to serve our retirements and other liabilities)? To test this notion, we add various levels of the HFRI Hedge Fund of Funds Composite to a simple 60/40 blend of the S&P 500 and BarCap Aggregate Bond Index over the past five years as seen in Figure 1. Why the last five years? Because it represents what many newer investors, those rushing to follow the endowment model in the middle part of the last decade, have actually achieved. Between 2002 and mid-2007, total hedge fund assets went from $626 billion to $1.7 trillion, a nearly three-fold increase. Today the hedge fund industry manages $2.25 trillion of capital according to HFRI.2 Plus, the last five years have seen a variety of environments to qualify as a market cycle.3
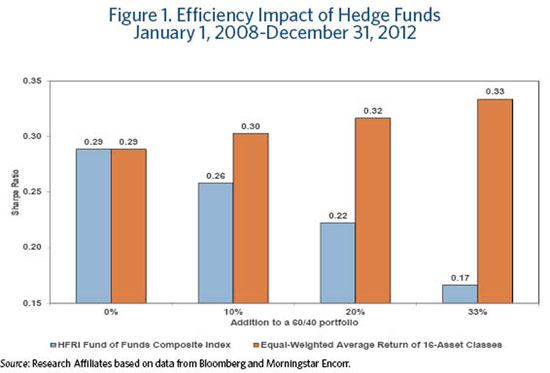
As shown in Figure 1, a pure 60/40 portfolio exhibited a Sharpe ratio of 0.29 over the five years ended December 31, 2012. Adding hedge fund of funds to a 60/40 portfolio reduces the overall return, resulting in a lower Sharpe ratio—a measure of portfolio efficiency.4 Upon adding a 33% exposure of hedge funds to this portfolio, the return falls from 3.8% annualized with plain 60/40 to 2.0%. This substantial decline more than offsets the favorable risk impact (standard deviation falls from 11.7% to 9.4%, a 19% decline) and the resultant Sharpe ratio falls to 0.17. Over the past five years, this category of investments, on average, has resulted in substantially lower portfolio efficiency!5
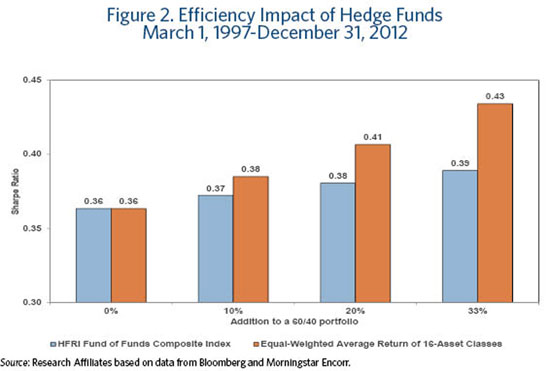
To ascertain whether this result is a fluke, we can dig a little deeper, extending the analysis back to March of 1997.6 The results in Figure 2 show a marginal positive impact on Sharpe ratios by adding hedge fund returns to the 60/40 portfolio. The improvement comes from risk reduction, as returns are still lower. Over the longer time period, adding a 33% allocation to alternative strategies would result in the same 19% reduction in risk that we found in the five-year period. We also found a similar, but smaller degradation in returns, from 6.3% to 5.8%. Because the return slippage is smaller while the risk reduction is comparable, portfolio efficiency (as measured by Sharpe ratio) improves modestly from 0.36 to 0.39. This hardly seems to measure up to the implied promise. They hedge but they fail to fund!
Sadly, most diversified portfolios of hedge funds have largely failed to live up to their promises, delivering less diversification than investors were encouraged to expect, paired with inadequate returns, especially with their current swollen asset base. Yet they are garnering substantial assets! Investors are so reluctant to confront the “expectations gap” that they will throw money at a proven return reducer, in order to maintain the façade that 8% is achievable if we just get some alpha, despite a historical track record amply proving otherwise.
A Simpler Path to Improved Returns?
Winston Churchill once declared, “Out of intense complexities intense simplicities emerge.”7 Since our founding in 2002, when we observed (to much consternation and opposition, even derision) that low yields will mean lower returns, we have advised investors to diversify more broadly into markets outside mainstream stocks and bonds. We’ve since termed this a “third pillar” approach, complementing the mainstream stocks and bonds, the two pillars that dominate most investors’ portfolios. Why should the equity risk premium be the only dominant driver of our long-term success or lack thereof? Commodity futures, emerging market local currency bonds, bank loans, TIPS, high yield bonds, and REITs all have unique return drivers and will respond differently to various market environments. Shouldn’t we employ these in our asset allocation on a scale large enough to matter ?
Our oft-cited 16-asset class portfolio, equally weighted, is a good example of this. It has many of the same betas embedded in hedging strategies—credit, commodity, and currencies (through non-U.S. and emerging markets).8 But when we return to Figures 1 and 2, we see such a simple expanded toolkit offers better risk-adjusted results than hedge funds.9 With each shift from 60/40 to this diversified roster, the Sharpe ratios steadily improve with larger allocations rather than decline! The takeaway is clear—most investors should, following Churchill’s advice, get simple in their diversification efforts before they get complex.
Take a look at our opportunity set. It includes commodities, high yield, local currency emerging market debt, bank loans, TIPS, and REITs. Are we using the full toolkit? History shows such a diversified roster, annually rebalanced—or better yet tactically managed in a contrarian value-oriented process—as a far better way to improve portfolio efficiency than most of the hedge funds.
Does this mean that we should abandon the notion of alternative strategies that are more reliant on alpha than beta for returns? Absolutely not! They can be an excellent tactical tool when returns from beta are skinny (as they increasingly are today). Of course, we need to be confident that they are the result of skill and are reasonably priced so that the bulk of the return from skill benefits the investor and not the manager. Assuming these are in place, we view lower risk alternative strategies as an excellent mechanism to de-risk a portfolio without the requisite exposure to duration in traditional countercyclical exposures like government bonds.
Conclusion
As a fishing enthusiast growing up in San Diego, I can tell you I caught more tuna on as plain a lure as you will ever find—the cedar plug. Vaguely resembling an oblong torpedo with a single hook, the cedar plug has a lead head and a tail of unpainted cedar wood. There’s no fisheye, no silver and blue (let alone purple and green!), and no paint anywhere. Just dull lead and the rusty hew of cedar wood. If there was ever a lure that wouldn’t sell in the tackle store, this is it. And yet it produces. To be sure, there are some days when the fancy lures with psychedelic colors will catch a few more fish and fishermen would be well advised to carry a little bit of everything in the tackle box. But, the first jig in the water oftentimes should be the simplest.
Like the tuna of San Diego, meaningful real rates of return are far less plentiful than they were in the past. Investors would be well advised to address this scarcity by practicing time tested methods for improving returns. We’re confident that a more diversified roster of liquid asset classes carefully selected and, ideally, tactically managed will move investors towards materially better returns than hoped for hedge fund alpha.
Endnotes
1. See Robert Shiller, www.econ.yale.edu/~shiller/data/ie_data.xls.
2. See HFRI release “Relative Value Arbitrage Leads Hedge Fund Capital to New Record,”
3. Perhaps, the only exception would be the lack of a sustained run of value equity outperformance.
4. Richard Ennis and Michael Sebastian (2003) showed that much of the benefits attributed to hedge funds are traceable to commercial databases that display “after the fact” returns, which have several biases that artificially inflate returns (survivorship, selection, backfilling biases and other issues). They focused their analysis on fund of funds (FOF) returns (following Fung and Hsieh 2002) and found little in the way of excess returns versus U.S. stocks and bonds. Comparing Sharpe ratios at different levels of hedge fund of funds exposure, as we have done, is an extension of their analysis.
5. We have witnessed over the past few years explosive growth in mutual funds employing hedge fund strategies in what Morningstar groups as its “Multialternative” category. A similar Sharpe ratio analysis shows these have also failed to deliver improved portfolio efficiency.
6. This period is selected to coincide with the launch of TIPS for the forthcoming comparison to an equally weighted 16-asset class portfolio.
7. This might be considered an offshoot of “Ockham’s Razor.” In the 14th century, William of Ockham wrote that “plurality must never be posited without necessity.” While his own confusing wording might even seem to flunk his own dictum, Albert Einstein was kind enough to clarify matters: “Make everything as simple as possible, but not simpler.”
8. Short-term bonds (Merrill Lynch US Corporate & Government 1-3 Year); core bonds (Lehman Brothers US Aggregate Bond); long-term U.S. Treasury bonds (LB US Treasury Long); long-term corporate credit (LB US Long Credit); high-yield corporate bonds (LB US Corporate High Yield); floating-rate notes (Credit Suisse Leveraged Loan); emerging market bonds (JPM EMBI + Composite); emerging market local currency (JPM ELMI + Composite; convertible bonds (ML Convertible Bonds All Qualities); Treasury Inflation Protected Securities (LB Global Inflation Linked US TIPS); REITs (FTSE NAREIT All REITs); commodities (DJ AIG Commodity TR); U.S. large-capitalization equity (S&P 500); U.S. small-cap equity (Russell 2000); developed ex-U.S. country equity (MSCI EAFE TR); and emerging market equity (MSCI Emerging Markets).
9. The 16-asset class portfolio is limited in its history due to the inception of TIPS in 1997. Hence the reason why Figure 2 only extends back to 1997 rather than to the inception of hedge fund data in 1990.
References
Ennis, Richard M., and Michael D. Sebastian. 2003. “A Critical Look at the Case for Hedge Funds.” Journal of Portfolio Management, vol. 29, no. 4 (Summer):103–112.
Fung, William, and David Hseih. 2002. “Benchmarks of Hedge Fund Performance: Information Content and Measurement Biases.” Financial Analysts Journal, vol. 58, no. 1 (January/February):22–34.
Munger, Charles T. 2008. “Talk Two: A Lesson on Elementary, Worldly Wisdom as It Relates to Investment Management and Business.” Poor Charlie’s Almanack: The Wit and Wisdom of Charles T. Munger, Peter D. Kaufman, ed., expanded third edition, PCA Publications.
© Research Affiliates


