Leave it to Tom Hanks. Only the most acclaimed actor of our generation could have garnered an Oscar nomination for absolute silence, interrupted only by an occasional shouting match with his co-star, a bloodied volleyball named Wilson.Castaway, released in 2000, showed Hanks’s character, a pudgy executive from FedEx, marooned on a South Pacific island as the lone survivor of an airplane crash. His only companion was a volleyball that washed ashore in a FedEx package. The flick now regularly pops up on cable and remarkably always seems to draw me in, suspending my channel surfing for a few minutes. There’s just something about the drama of surviving on a deserted island that requires nothing more than watching what happens next.1
To most, a portfolio management process without frequent performance reviews and benchmark comparisons is about as foreign as a movie without dialogue or co-stars. But most asset management programs have very long horizons, where a month or quarter—let alone a day or a week—is but a statistically insignificant blip. Actuarially, even an octogenarian has a nearly 10-year time horizon. In recent talks with advisors, I asked how many had clients whose investment portfolios were designed to meet liabilities less than 10 years out. Anecdotally, I can tell you well under 5% of the advisors raised their hands.
Of course, some institutional investment programs also are designed to meet prospective payout streams that go on for decades. This is indeed a blessing because the capital markets are inherently noisy and unpredictable over the short term, but remarkably steady and predictable over the long term. But all of us succumb to the temptation to check the impact of recent market movements on manager performance. One large pension client specifically affirmed this tendency by telling our CIO that “we are long-term investors but short-term reviewers.”
What if we couldn’t evaluate performance for the next quarter or the next year or even the next three years? At Research Affiliates, we call this thought experiment the “Deserted Island portfolio.” Like Hanks’s character, we would be exiled to a remote, uninhabited island. But before we get banished to the beach, we could build a portfolio we would buy and hold, save for an annual rebalancing back to target allocations. In the interim, there’d be no cable news feed and no benchmark comparisons, nothing to reinforce the brilliance or stupidity of our portfolio selections.
Today this exercise reveals some unusually good opportunities for those willing to embrace maverick risk.
Deserted Island Logic
In the late 1980s, Paul B. Andreassen conducted a series of experiments demonstrating that investors who received no news about their stock market investments did better than those who saw the headlines. The theory is that investors often overreact to short-term news that has little effect on the long-term fair value of the company. Some 25 years later, the 24/7 news cycle and nearly continuous performance measurement cycle makes it all the easier for investors to overreact, generally to the detriment of portfolio returns.
We are unlikely to change this dynamic, and the reason is simple. Nearly all of us in the investment business are agents rather than the actual owners of capital. We oversee others’ nest eggs, pensions, and charitable trusts, most of which have timelines measured in decades. Acting as their clients’ agents, advisors and managers of capital with discretionary authority have a very different timeline, one that is often measured in a handful of years. If our results fall short in comparison with common benchmarks and peer groups, we risk being “de-selected.”
The stark difference in time horizons is exacerbated by the fact that all of us must report to someone, that all of us have a client. In the public arena, for example, the portfolio manager reports to the chief investment officer, who reports to the chairman of the asset management firm, who reports to the client’s chief investment officer, who reports to the investment committee, who reports to the state pension board, who reports to the governor and ultimately the taxpayers. Each rung in the ladder adds pressure to deliver relative results, condensing the timeframe for evaluating one’s success or lack thereof. Accordingly, investment professionals embrace maverick risk at their own peril.
This is hardly new stuff. Dean LeBaron, in his 1983 reflections on market inefficiency, noted that investment managers often are more motivated to please the various levels of clients (with their inevitably diminishing time horizons for evaluating success) than to engage in profitable transactions. He went on to say, “Many managers end up paying a good deal in terms of foregone [sic] opportunity for the privilege of resting comfortably in the lower part of the second quartile and avoiding ever being in the bottom quartile for even a short period.”
One way to break this way of thinking is to imagine not having to report to anyone for a full market cycle. What sort of portfolio would we construct if we weren’t subject to a continual barrage of benchmark returns and peer group comparisons?
Building Forecasts
To answer, we need to develop some forecasts. Longtime readers of this publication have probably seen us walk through our “Building Blocks” approach, a simple “yield plus growth” calculation that provides an intuitively direct and empirically robust starting point for forecasting long-term asset class returns. When we apply it to mainstream U.S. equities and bonds, we find future long-term returns (5 to 10 years) are likely to be paltry—about 2.5% annually for bonds and 5.5% annually for stocks, as shown inTable 1. A typical 60/40 stock/bond mix can therefore be expected to produce 4–5% returns, starkly below the 7–8% returns typically built into pension and defined contribution assumptions.2
But wait a second! Weren’t U.S. equities up 20% in the first three quarters of this year? That seems to blow a hole in your low return environment thesis, wouldn’t you say?
Actually, it’s not uncommon for stocks to surge ahead, even in secular low return environments. The aptly named “lost decade” of the 2000s witnessed a –1.0% annualized return from the S&P 500 Index. Yet from late 2002 through late 2007, stocks were up over 100% cumulatively. Results like these dupe investors into thinking the low return hubbub is nothing but doomsaying. Likewise, we see other sizeable equity advances in the low return decades of the 1930s and 1970s. It’s human nature to feel good when showered with recent performance windfalls, but they tend to be unsustainable when yields aren’t at levels supportive of long-term advances.
ConsiderFigure 1, where we show rolling three-year returns of the S&P 500… with a catch. For each three-year period, we eliminate the annualized 4.3% excess return of stocks over long bonds that was realized in the 1926–2013 period. In other words, we subtract 4.3% from every annualized three-year return, essentially giving stocks the same long-term return as bonds. But stocks displayed considerably more volatility, and that volatility gives the impression of sustained periods of large gains. Twenty-five percent of the time stocks were posting adjusted three-year annualized returns above 13% despite offering nothing in the way of excess return over long bonds. Ten percent of the time they were compounding at 21% per annum over three years.
With these kinds of returns, nobody would proclaim a low return environment. And yet that’s exactly what occurred… for 86 years! So we need to be vigilant and not let short-term bursts of stock market performance convince us of unrealistic long-term prospects.
Go to the Feared Areas
So if mainstream U.S. stocks aren’t priced to deliver attractive returns, where else can we look? As contrarians, one of our favorite disciplines is to look at the most feared and loathed areas of the markets.3What kind of long-term returns do they offer (on the backs of presumably much higher yields caused by recent price plunges)? Recently, the asset classes that would rank at the bottom of most investors’ lists would be emerging markets, both stocks and bonds.
We can apply this same Building Blocks methodology to diversifying Third Pillar assets like emerging market stocks, emerging market bonds, and credit (as represented by U.S. high yield). In previous pieces, we noted how some of these have gone on rather extreme sales, particularly relative to U.S. stocks.4This has pushed up their yields to levels where forward-looking returns are a full 1–2% higher than their mainstream counterparts, as evidenced by Table 2.
The BIG Wildcard
The Building Blocks intentionally ignore changes in equity valuation multiples. But, over longer stretches of time, cheap valuationstypically act as a tailwind while lofty P/E ratios act as a headwind. And when valuations are at particularly wide spreads, these winds can be gale force! Consider that the annualized contribution of changing valuations to equity returns has ranged from +10.9% to –6.8% over the last six decades.5During the naughties—the 2000s—a rise in dividend yields from 1.1% to 2.1% implied a 48% drop in the value the market was willing to pay for each dollar of dividends. That works out to a 6.5% annualized drop in valuation multiples.
Today, we witness a cyclically adjusted P/E ratio (using Robert Shiller’s methodology) of 23.8, roughly in the richest 90th percentile and at a 44% premium above its long-term average. But the picture changes dramatically when we shift our attention to the developing world, as seen inTable 3.6
What sorts of returns do we find from these types of valuations? When starting Shiller P/Es are between 20 and 25, we find that U.S. equities produce a median nominal return of 4.2% over the subsequent five years, a bit below our Building Blocks estimate of 5.8%. So, if history is any indication, we are likely to see a return drag from falling valuation ratios in U.S. stocks.
What about the relatively cheap (and, arguably, absolutely cheap) emerging markets? When emerging markets stocks sport valuation ratios between 10 and 15, subsequent five-year nominal returns clock in at a median of 13.6%. Admittedly, we have a far shorter historical record with far fewer observations supporting such sizeable forward returns. But, if a limited history is any indication, almost a full 1,000 bps compounded per annum for five years is a heckuva premium. Even if we extrapolate the U.S. experience at these valuations, there’s a 500 bp annualized premium (9.3% less 4.2%) for being an equity investor at valuations of 10–15X versus 20–25X earnings.
The forward return advantage of third pillar assets is only widened when we look at current valuations. In an era where market participants are starved for returns, it is remarkable that we haven’t seen more investors focus on such disparities and make the appropriate rebalancing transactions.
Packing for the Island
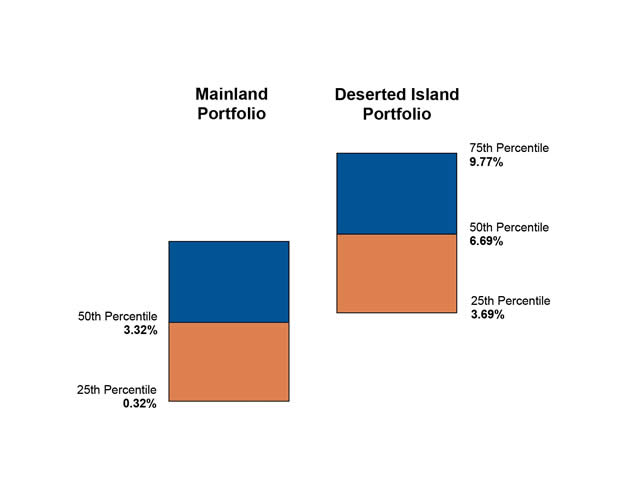
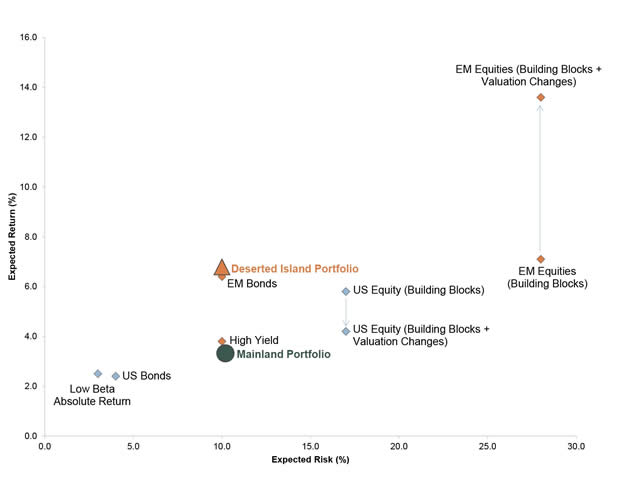
We can put these forecasts together and run a simple mean variance optimization. We will build two portfolios—a Mainland portfolio and a Deserted Island portfolio. Mainland will be a typical 60/40 blend of U.S. stocks and investment-grade bonds as represented by the S&P 500 and Barclays Aggregate Bond indexes, respectively. Deserted Island will comprise 20% emerging market equities, 30% emerging market bonds, 30% high yield bonds, and 20% low beta absolute return strategies. The latter serve to dampen the volatility of the portfolio to a level more consistent with 60/40. (Inevitably, emerging markets and high yield bonds lead to greater portfolio volatility, all else being equal.)7Figure 2 displays five-year risk and return projections for the two portfolios and their constituent asset classes. We use the Building Blocks return estimates for U.S. bonds, emerging market bonds, and high yield bonds. But we use the aforementioned median returns from today’s valuation levels for the equity categories as seen in Figure 3.
Figure 2

Figure 3
What do we find?
The odds are solidly in favor of the Deserted Island portfolio. It has an expected return that is almost 3.25% percentage points higher than Mainland’s over the next five years. But, of course, this comes with a range of results. As one client told me during my consulting career, “We know your projected return will be wrong, we just don’t know by how much!” When we examine the potentialrange of outcomes in Figure 3, we find that the Deserted Island mix’s bottom quartile result is, at 3.7% per annum, actually better than the median (expected) result of the Mainland portfolio. Likewise, the top quartile result of the Mainland portfolio falls short of the median expected return of the Deserted Island portfolio.
The odds, based on this analysis, of the Mainland portfolio beating the Deserted Island over the next five years are solidly in favor of going maverick. Furthermore, all the assets in the Deserted Island portfolio are what we call Third Pillar assets that historically have provided more inflation protection than mainstream markets. We believe this protection is critical given the likely super secular trend of inflation in the face of unsustainable debt burdens. If the inflation materializes, the Third Pillar assets may fare even better!
This approach is projected to move investors materially closer to targeted returns and, importantly given our outlook, provides more inflation protection. So why aren’t more investors embracing it?
Here’s where we return to Messrs. Andreassen and Hanks. If frequently reviewing news and portfolio results is detrimental to our financial health, then surely there will be many opportunities to abandon such an out-of-the-mainstream asset mix when it’s inevitably “wrong and alone” over a given year. With efficient implementation,8we’d venture a guess that the Deserted Island portfolio would have an 80:20 or 90:10 odds of winning over Mainland for the next five years. The next five quarters? Maybe 55:45. This portfolio would have exhibited a 7% tracking error against the 60/40 U.S. stock and bond blend over the past 15 years. With such a widely divergent path (even to an ultimately better end result), short-term performance would vary widely and inevitably produce a bad year of relative underperformance, perhaps on the order of over 1,000 bps.
How many of us would blink under the relentless pressure of such disparate results versus the peer group? Only the most dedicated of contrarians could stick with such short term underperformance and, just as critically, convince clients to do the same. Yet the forced solitude of the Deserted Island allows us to ignore the news and related pressure, and to likely achieve better long-term results.
Conclusion
Human beings have always been concerned with the “other guy”. Much of our happiness is centered on success relative, not to our own aspirations, but to our neighbor’s success. Take the study by economists Sara Solnick and David Hemenway (1998), who surveyed 257 students, staff, and faculty at the Harvard School of Public Health on their attitudes about absolute position and their position relative to society. Over half the respondents preferred to receive an annual salary of $50,000 when others are making $25,000 over earning $100,000 a year when others are making $200,000. In other words, these respondents would prefer to have half as much real income so long as they are making twice as much as others in their society.
Anecdotally, we at Research Affiliates have noted a similar response from investors who appear to be less displeased by low returns when excess returns are reasonable. Today, clients still maintain a healthy emphasis on mainstream assets, especially the recently surging S&P 500. Nonetheless, the past nine months have created some opportunities to earn reasonable long-term buy-and-hold returns. The buying and the holding aren’t easy, though. Being willing to buy recent laggards with their parade of bad news and outflows involves swallowing second and third helpings of maverick risk. And, just as importantly, an iron stomach is needed to “hold” these positions when clients get short-term indigestion.
Of course, we use the Deserted Island scenario with tongue in cheek. Advisors who vanish to faraway locales are more often associated with fraud than prudence! But it’s a fun thought experiment to help advisors and their clients concentrate on reliable predictors of return and align their investment horizons away from their emotions and towards their liabilities. There’s no “other guy” on the island. Well, okay, maybe Wilson will be there—which triggers an idea for the mainland. Maybe designate Wilson to have sole discretionary authority over your account. He may listen to your short-term peer group gripes but he’s obviously incapable of pushing the “sell” button!
Endnotes
1. According to Macmillan Dictionary, a “desert island” is “a small tropical island with no people living on it.” It may or may not have previously been inhabited, but, if so, it is now deserted—except, of course, for Wilson. Most people still refer to it in past tense so we go with the more commonly used but grammatically incorrect “deserted island.”
2. For a thorough review of the efficacy of the 60/40 model over long time periods, see Brightman (2012).
3. In 2012, Morningstar’s Paul Justice jointly interviewed Cliff Asness and Rob Arnott, our Chair. Rob defined the patience and courage of being contrarian. “I love to use a concrete example to help people viscerally understand this point. Suppose I go to a client and say, ‘We’ve scanned your portfolio, and we found an investment that you’ve got that’s very popular and beloved. It has its finger on the pulse of the consumer like nobody else. No serious competitors. Lofty growth potential. It’s gotten to be so popular that it doesn’t have a risk premium, so we just dumped it. Apple is gone from your portfolio. We’ve searched the world high and low to find assets that are truly feared and loathed; lo and behold, we found a basket of Spanish and Greek banks. Yes, I know, some of them are going to go to zero, but the ones that don’t go to zero, they’re really cheap. So, we used the proceeds from Apple to buy a basket of Spanish and Greek banks.’”
4.See West (2013).
5.Bonds have substantially smaller swings in valuations.
6.In this analysis, we compute the Schiller P/E as far back as we can historically for developed ex-U.S. and emerging market stocks. Then we blend these time series with the longer-term U.S. data.
7.For a return estimate, we simply assumed that these low risk, absolute return funds would achieve LIBOR +2%.
8.The Fundamental Index® concept has produced substantive excess returns in emerging market equity, emerging market debt, and high yield bonds. For more details of these results, see Arnott (2008), Hsu et al. (2007), and Arnott et al. (2010).
References
Andreassen, Paul B. 1987. “On the Social Psychology of the Stock Market: Aggregate Attributional Effects and the Regressiveness of Prediction.”Journal of Personality and Social Psychology, vol. 53, no. 3 (September):490–496.
Brightman, Chris. 2012. “Expected Return.” Investments & Wealth Monitor, IMCA (January-February):24–29.
Justice, Paul. 2012. “Fitting Factors Into the Formula.”Morningstar Advisor (October/November):50–57.
LeBaron, Dean. 1983. “Reflections on Market Inefficiency.”Financial Analysts Journal, vol. 39, no. 3 (May/June):16–17, 23.
Solnick, Sara J., and David Hemenway. 1998. “Is More Always Better? A Survey on Positional Concerns.”Journal of Economic Behavior & Organization, vol. 37, no. 3 (November):373–383.
© Research Affiliates
www.researchaffiliates.com
© Research Affiliates
Read more commentaries by Research Affiliates