Key Points
- Stocks have gone on a wild ride, with the long-awaited correction finally occurring, amid sharp snapbacks. We believe volatility is likely to continue and patience is suggested.
- With no sign of recession in the United States, a prolonged bear market seems unlikely. But the increase in market volatility, combined with the absence inflationary pressures has left the Fed uncertain as to the timing of its next step.
- The death of the global economy has likely been greatly exaggerated, leading to potential investment opportunities.
Don’t just do something, sit there!
“Everyone has a plan until they get punched in the mouth.”—Mike Tyson.
We don’t often quote Mike Tyson, but his words resonate lately. Investors are wondering what to do—buy the dips, sell the rallies, or sit tight? First, investment decisions should never be made on emotion, which tends to dominate at times like this. It can be difficult to stomach moves such as we’ve seen recently. But investors who have an investing plan in place should indeed just sit there, let things calm down, and continue with the plan already put in place. If additions to equity positions are required to keep portfolios in balance, the pullbacks we’re seeing can provide opportunities. But we do not think investors should be aggressive in their positioning. Volatility across asset classes is likely to persist, and further downside is possible; but we caution about trying to time the bottom tick. Corrections typically take time to go through their bottoming processes, but changing your long-term strategy in reaction to the market’s short-term moves is not wise.
What happened?
Many fingers have been pointing toward China in the “blame game” that is always popular during market corrections. Yes, China’s growth is slowing; but that is not new news. Yes, China made a change to its exchange rate setting mechanism—going from a de facto peg to more of a floating system. But the “devaluation” amounted to 3% versus the 30% appreciation in its currency over the past decade. Yes, China appears to have botched its efforts to support their crashing stock market. But when China’s market bubble was inflating, our market turned a blind eye. , We view these forces as straws more so than causes. As we had been writing—in this publication and others—the market had been suffering quite a bit of internal damage leading to the correction. And, of course there is the looming initiation of rate hikes by the Federal Reserve; which we have noted would likely bring along heightened volatility.
Likely exacerbating the wild day-to-day, and intraday, swings is the prevalence of high frequency trading (HFT) and other algorithmic trading strategies. Where a correction such as we’ve seen recently might have occurred over several weeks 20 years ago, computer algorithms can compress time frames now, resulting in a condensed wild ride like we’ve seen. The result was a pretty sharp and scary downturn. So why shouldn’t investors be more concerned this is just the beginning of something more serious?
No recession in sight
Sustained bear markets have typically not occurred outside of close proximity to an economic recession—and data isn’t showing a strong likelihood of that in the near future. US real gross domestic product (GDP) growth has been chugging along at a roughly 2.7% over the past two years; the latest revision to second quarter growth was substantially higher—to a 3.7% pace, with every category showing improvement, according to the Bureau of Economic Analysis. Caveat: a buildup in inventories and the rebound from a soft first quarter indicates that rate is not likely to repeated in the current quarter.
As it related to China and commodities, there has developed a divergence between the manufacturing and service sides of the US economy, with Chinese concerns impacting sentiment on the manufacturing side. The Institute of Supply Management’s (ISM) Manufacturing Index fell in the latest month, close to, but still above the 50 mark denoting the line between expansion and contraction; while new orders fell quite a bit. However, the ISM Non-Manufacturing Index remained near a 10-year high, with new orders remaining quite strong. It’s quite possible that the dip in manufacturing optimism is a kneejerk response to the China concerns and could rebound. But given that services represent 88% of the US economy—while manufacturing represents only 12%—suggests the future remains bright.
Divergence in the economy?
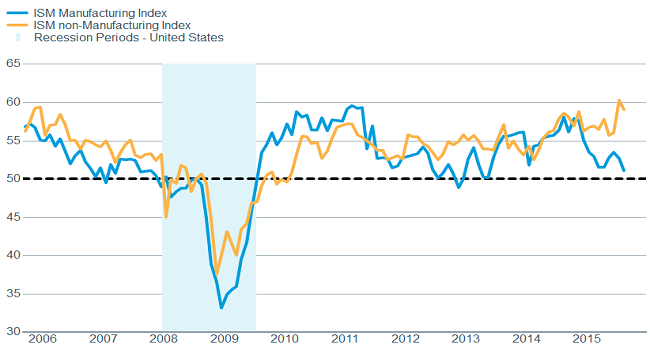
Source: FactSet, Institute for Supply Management. As of Sept. 3, 2015.
Additionally, industrial production rose 0.6% in July, marking the second monthly gain after five declines to start the year; indicating manufacturing isn’t falling off a cliff. Also, capacity utilization gained, but still remains below its long-term average.
Manufacturing still looking OK
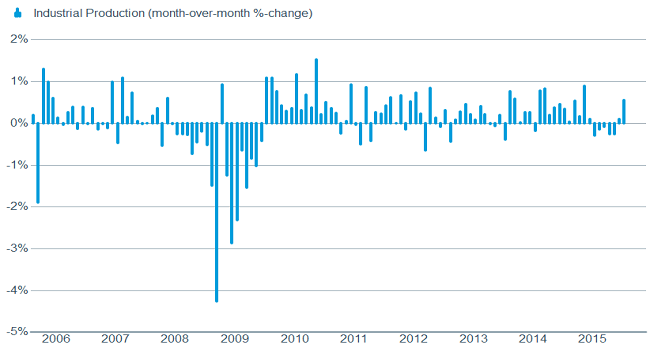
Source: FactSet, Federal Reserve. As of Sept. 3, 2015.
But capacity remains below average
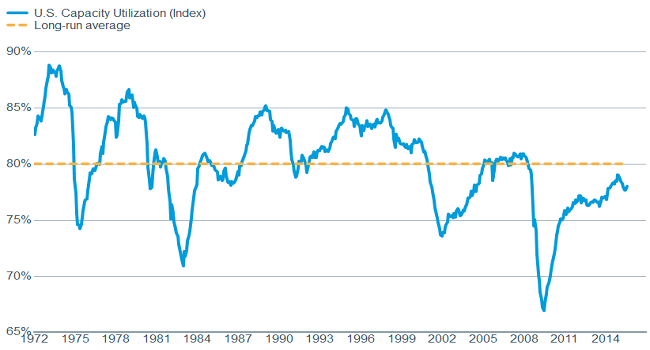
Source: FactSet, Federal Reserve. As of Sept. 3, 2015.
Another very bright spot for the US economy—and helping to boost second quarter GDP—has been housing. The National Association of Homebuilder Index rose to the highest level in a decade, while new home starts and existing home sales both rose to roughly eight-year highs. And construction spending is up over 70% year-over year!
Housing continuing to strengthen
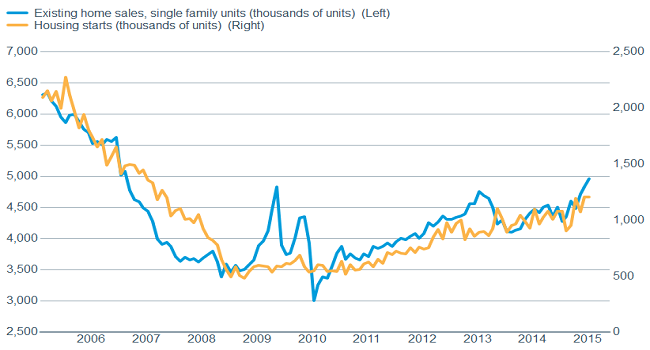
Source: FactSet, Nat'l Association of Realtors, U.S. Census Bureau. As of Sept. 3, 2015.
And looks to continue to strengthen
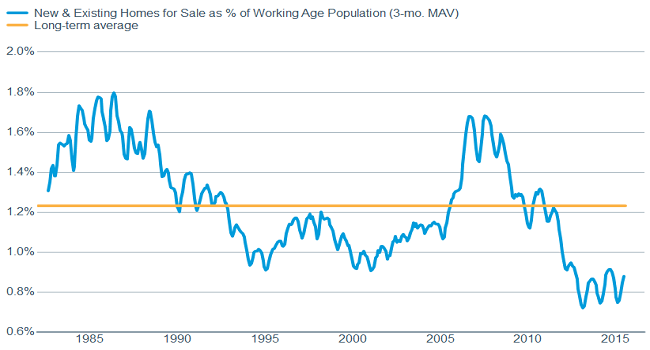
Source: FactSet, Nat'l Association of Realtors, U.S. Census Bureau. As of Sept. 3, 2015.
Future gains also appear to be lining up. Household formation is up dramatically over the past few months, while the homeownership level has fallen below long-term averages. Inventories remain low, with the number of existing and new home available for sale as a percentage of the working age population is near a thirty-year low (thanks to Evercore ISI Research).
The labor market also continues to improve. Initial jobless claims remain well below the key 300,000 level, which tends to be a leading economic indicator—providing support for even further improvement for a relatively healthy job market. The unemployment rate has fallen to a multi-year low of 5.1%, 173,000 jobs were added in August according to the US Labor Department, and the previous two months were revised higher by 44,000 jobs. The headline payroll number was light relative to expectations, but the average upward revision to the August initial reading has been 78,000 since 2009. This continued improvement should finally begin to push wages higher; while even in this report, there was hope—average hourly earnings rose a better than expected 0.3%. Accelerating wages—along with strong housing (and auto) data will likely further bolster consumer confidence.
Fed uncertainty rises
The increase in financial market instability, as well as a strengthening US dollar, continued easing by other major central banks, and global disinflation , has left the Fed uncertain as to the timing of an initial rate hike. This uncertainty has recently been exacerbated by pleas from both the International Monetary Fund (IMF) and the World Bank to the Fed about not yet raising interest rates…a somewhat unprecedented attempt to influence US Fed policy. With the next Federal Open Market Committee Meeting (FOMC) meeting finishing up on September 17, we will soon know how impactful global turmoil and financial market volatility is on its decision-making.
The case for the Fed ripping off the band aid and beginning the process of rate normalization rests to some degree on its need to re-arm itself for any future economic trouble and/or crises. For those in favor of more quantitative easing (QE) as a tool, a study released last month by Stephen Williamson of the Federal Reserve Bank of St. Louis should cause some pause. It’s worth a read in full, but the sentence that sums it up is: “There is no work, to my knowledge, that establishes a link from QE to the ultimate goals of the Fed- inflation and real economic activity.”
We also want to remind investors that we believe that pace and magnitude of rate hikes is much more important than the initiation’s timing—to both the economy and the stock market. Fed Chairwoman Janet Yellen, and other FOMC members, have been taking great pains—amid the uncertainty—that the pace of rate hikes will likely be slow. This should both reduce the risk of a financial accident, and serve the equity market better.
Serving up growth
Of course it hasn’t just been the US markets that have seen extreme volatility. Economic data around the globe appears to be increasingly driving swings in global markets. Some of the worst days for the world’s stock markets over the past few weeks took place on the days the preliminary and final readings for various global manufacturing Purchasing Managers Indexes (PMI) were released, reflecting a further slowdown in global manufacturing activity.
|
Country/ Region |
8/21 Preliminary PMI |
9/1 Final PMI |
|
China |
-1.5% |
-2.2% |
|
Japan |
-3.0% |
-3.8% |
|
Eurozone |
-3.3% |
-2.7% |
|
United States |
-3.2% |
-3.0% |
China = Hang Seng Index, Japan = Nikkei 225 index, Eurozone = STOXX Europe 600 Index, United States = S&P 500 Index Source: Charles Schwab, Bloomberg data as of 9/9/2015.
PMIs are timely and widely-watched measures of the outlook for manufacturing activity. A rising line signals an improvement in manufacturing, and 50 marks the breakeven between expansion and contraction. The trend in global manufacturing activity has been downward for about a year and a half, as seen in falling commodity prices, slowing global trade and freight traffic. Global markets reacted negatively to the global manufacturing PMI sliding to a two year low of 50.7 in August.
However, market participants may be missing the big picture. PMIs don’t only measure manufacturing activity; there are also lesser-known PMIs for services (like in the United States). Market participants may want to place greater emphasis on services than manufacturing data. After all, services industries make up around 70-80% of the US, Eurozone, and Japanese economies per World Bank data. Even in China, services this year will likely amount to a record 50% of total GDP, and exceed the contribution from manufacturing by a double-digit margin.
The latest reading for the August global services PMI was up 0.3 to 54.4, the best level in four months. And, unlike the global manufacturing PMI, the global services PMI has been stable- to- higher over the past year.
Services strength is offsetting manufacturing weakness for global economy
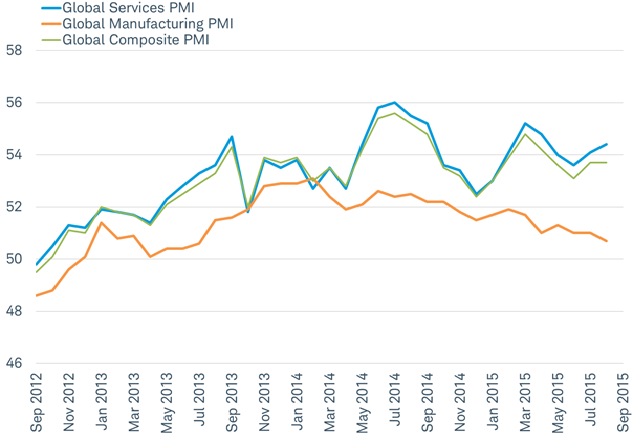
Source: Charles Schwab, Bloomberg data as of 9/9/2015.
The global composite PMI is a weighted combination of both services and manufacturing, to reflect the entire picture of economic activity captured by the PMI indexes. Because services are the dominant portion of the global economy, the composite PMI tracks the services PMI closely. The overall economic environment measured by the composite PMI is pointing to continued growth. As a result, market participants may be placing too great a focus on the weakening manufacturing data, giving rise to fears of a looming global recession, and not enough emphasis on the stable-to-improving services data, keeping the risk of recession fairly low.
So what?
Stay calm and carry on. Easy to say but hard to do. The US economy remains healthy, and recent stock market volatility has changed very little of that story, so we don’t believe your investment plan should change either. We still think the bull market is intact as global monetary policy is loose, economies aren’t falling off a cliff, and the US consumer is in good shape, supported further by falling commodity prices. Globally, the story is somewhat similar—major economies don’t appear to be falling off a cliff, and investors should turn their attention to the increasingly dominant services side of the global economic ledger.
Important Disclosures
International investments are subject to additional risks such as currency fluctuations, political instability and the potential for illiquid markets. Investing in emerging markets can accentuate these risks.
The information provided here is for general informational purposes only and should not be considered an individualized recommendation or personalized investment advice. The investment strategies mentioned here may not be suitable for everyone. Each investor needs to review an investment strategy for his or her own particular situation before making any investment decision.
All expressions of opinion are subject to change without notice in reaction to shifting market, economic or political conditions. Data contained herein from third party providers is obtained from what are considered reliable sources. However, its accuracy, completeness or reliability cannot be guaranteed.
Past performance is no guarantee of future results.
The Institute for Supply Management (ISM) Manufacturing Index is an index based on surveys of more than 300 manufacturing firms by the Institute of Supply Management. The ISM Manufacturing Index monitors employment, production inventories, new orders and supplier deliveries.
The Institute for Supply Management (ISM) Non-manufacturing Index is an index based on surveys of more than 400 non-manufacturing firms by the Institute of Supply Management. The ISM Non-manufacturing Index monitors employment, production inventories, new orders and supplier deliveries.
Capacity Utilization is a metric used to measure the rate at which potential output levels are being met or used. Displayed as a percentage, capacity utilization gives insight into the overall slack in the economy.
Markit Manufacturing Purchasing Managers Index (PMI) is an indicator of the economic health of the manufacturing sector. The PMI index includes the major indicators of: new orders, inventory levels, production, supplier deliveries and the employment environment.
Markit Composite Purchasing Managers Index (PMI) Output Index is a weighted average of the Manufacturing Output Index and the Services Business Activity Index.
The Services Purchasing Managers Index (PMI) released by Markit Economics captures business conditions in the services sector.
The Hong Kong Hang Seng Index is a market capitalization-weighted index of 40 of the largest companies that trade on the Hong Kong Exchange.
The Japan Nikkei 225 Index is a price-weighted index comprised of Japan's top 225 blue-chip companies on the Tokyo Stock Exchange.
The STOXX Europe 600 Index is an index that includes 600 components that represent large, mid and small capitalization companies across 8 countries of the European region, including Austria, Belgium, Denmark, Finland, France, Germany, Greece, Iceland, Ireland, Italy, Luxembourg, the Netherlands, Norway, Portugal, Spain, Sweden, Switzerland and the United Kingdom.
The National Association of Homebuilders (NAHB)—Wells Fargo Housing Market Index (HMI) is based on a monthly survey of NAHB members designed to measure homebuilder sentiment in the single-family housing market. The survey asks respondents to rate market conditions for the sale of new homes at the present time and in the next 6 months as well as the traffic of prospective buyers of new homes. It is a weighted average of separate diffusion indices for these three key single-family series.
The S&P 500 Composite Index is a market capitalization-weighted index of 500 of the most widely-held U.S. companies in the industrial, transportation, utility, and financial sectors.
The Schwab Center for Financial Research is a division of Charles Schwab & Co., Inc.
(0915-5799)


