What Was, What Is, and What May Be
Key Points
- 2015 has largely been a grinding year for stocks, and with uncertainty still relatively high and earnings growth under pressure, the start to 2016 may continue that pattern.
- A new Federal Reserve paradigm doesn’t mean the death knell for stocks. History shows that a slow hiking cycle has been positive for stocks, while a Presidential election year has also tended to be fairly upbeat.
- In contrast to the Fed, many foreign central banks are expanding their easing programs, which could provide for attractive investing opportunities.
Please note: Due to the upcoming holidays the next Schwab Market Perspective will be published on January 8, 2016.
Try to time the market at your own peril
2015 looks like it will end relatively flat for the major US indexes after trading in a tight range for most of the year, only to be jolted by a sharp pullback in August, followed by a robust rally in October. The lesson here is that trying to time the market is extremely difficult and that panic is not an investment strategy. The chart below looks at the entire history of the S&P 500, and when you consider the events encompassed in that time period, and see where stocks are now and how they have consistently bounced back, some perspective may be gained.
The resilience of the stock market has been impressive
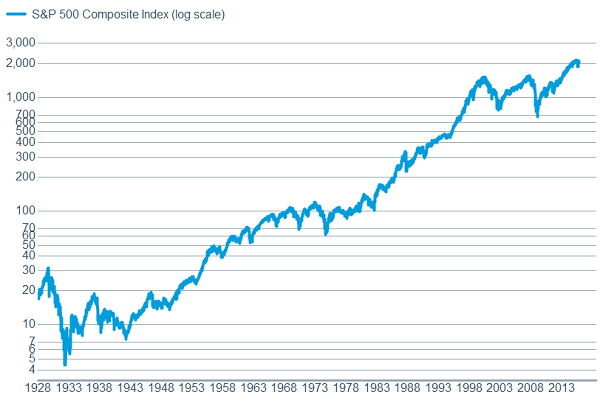
Source: FactSet, Standard & Poor's. As of Dec. 8, 2015. Past performance is no guarantee of future results.
Despite the good long-term prospects of US stocks and the bull market we’ve enjoyed since the 2008 recession, investors remain quite skeptical. According to ISI Evercore Research, through the end of November investors had pulled a net $143 billion out of US equity mutual funds this year, which constitutes a record—even surpassing 2008’s outflows. Investing isn’t always easy, but the above chart shows that throughout history, staying out of stocks for an extended period hasn’t been the best strategy.
The current US economic picture—a flawed painting?
That’s not to say there aren’t current headwinds keeping the economy from firing on all cylinders. Manufacturing weakened in the second half of the year and according to the Institute for Supply Management (ISM),moved into contraction territory in November for the first time in three years, and to its lowest level since 2009. Additionally, the Baltic Dry Index (a proxy for global shipping activity) has fallen, commodities have continued to drop, and a stronger dollar makes US exports more expensive for foreign economies.
Manufacturing is softening
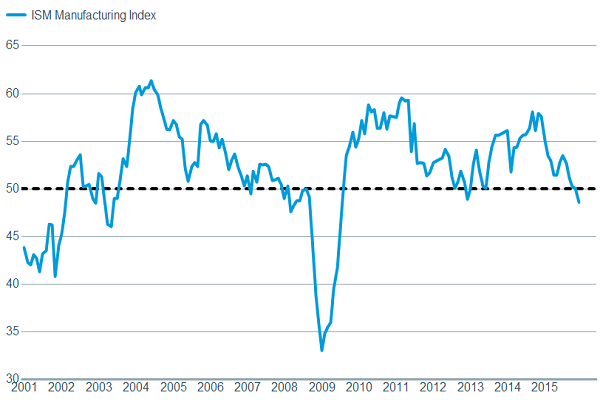
Source: FactSet, Institute for Supply Management. As of Dec. 8, 2015.
The Baltic indicates soft global trade
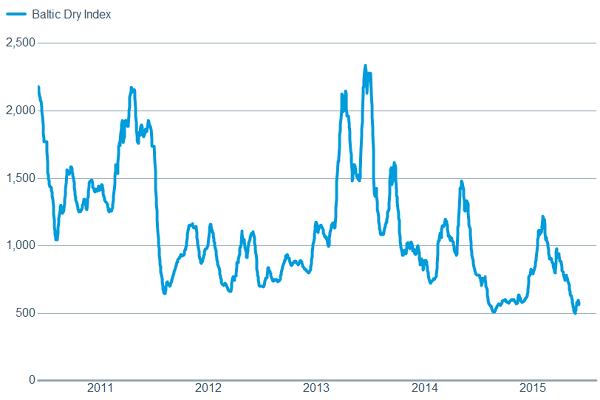
Source: FactSet, Baltic Exchange. As of Dec. 8, 2015.
A stronger dollar causes problems for exporters
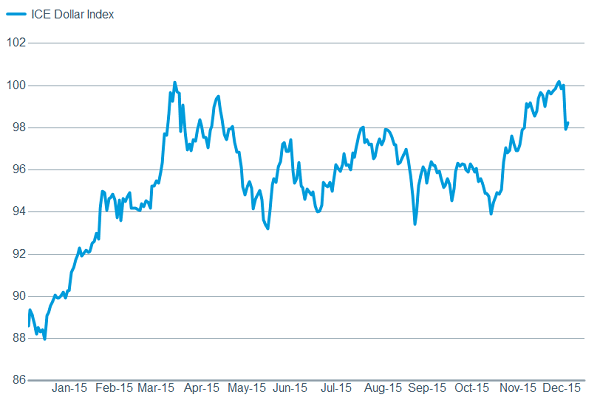
Source: FactSet, Intercontinental Exchange. As of Dec. 8, 2015.
Despite these trends in 2015, stocks managed to hold up relatively well. While manufacturing is important and shouldn’t be ignored, it represents only 12% of US economic activity; while the export market is a relatively small part of overall gross domestic product (GDP). The services side of the economy (representing 88% of US activity), in contrast, remained healthy throughout 2015 and looks to continue that performance entering 2016. The ISM Non-Manufacturing Index weakened slightly, but remained in territory depicting solid expansion, while the new order component also bodes well for activity in the coming months. One note, the Markit PMI indexes for both manufacturing and services posted better results than the ISM surveys, and although they have less historical context, they are becoming more widely followed as they encompass a broader swath of companies in their surveys. Additionally, the US consumer looks to be in good shape heading into the New Year. The labor market continued to improve throughout the year, with the unemployment rate falling from 5.6% at the start of the year, to 5.0% by the end of November, while the forward looking weekly initial unemployment claims continue to hover near record lows.
The labor market looks quite healthy
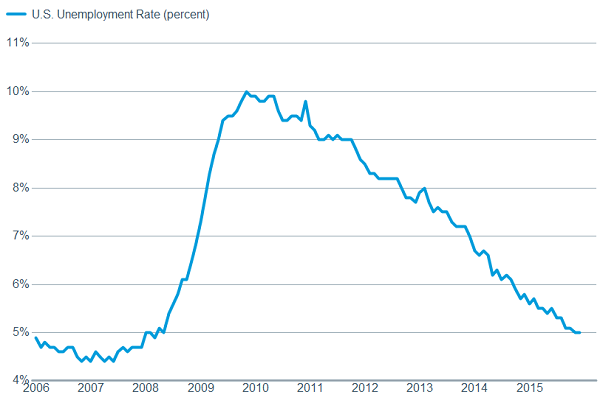
Source: FactSet, U.S. Dept. of Labor. As of Dec. 8, 2015.
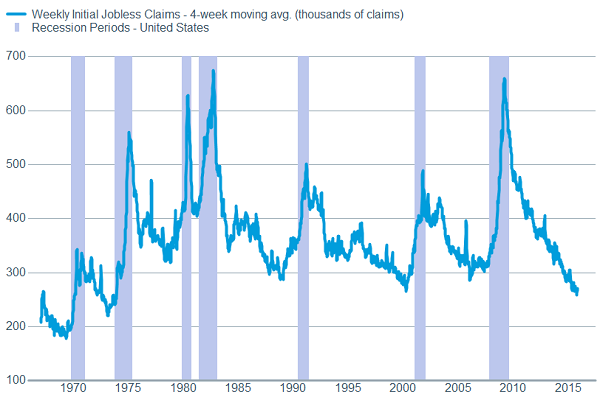
Source: FactSet, U.S. Dept. of Labor. As of Dec. 8, 2015.
The latest jobs report showed that 211,000 jobs were added in November; while the previous two months were revised higher by 35,000, continuing the positive trend seen throughout the year. It seems likely that the number of workers added to payrolls will slow some in 2016 as the labor market tightens and it becomes harder to find qualified workers. We’re finally starting to see some of that leak into wage gains, with average hourly earnings rising 2.4% year-over-year. Additionally, unions in major industries are negotiating decent pay hikes for the first time since the recession, and there are numerous local governments and large companies who have raised their minimum wage.
Additional potential help for the consumer came from the continued fall in commodities, which was highlighted by lower oil prices. As with many things, however, there is a downside as manufacturing associated with energy has taken a hit, contributing to the soft environment discussed above.
Lower oil hurts energy manufacturing, but helps consumers and other businesses
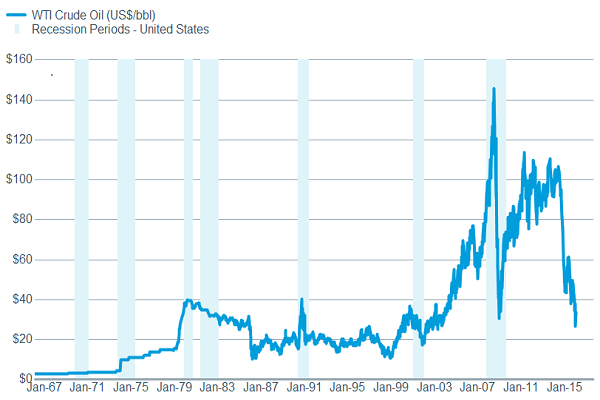
Source: FactSet, , Dow Jones & Co. As of Dec. 8, 2015.
But one thing we will continue to watch in 2016 is the potential of a “smarter” American consumer that is unwilling to pile on consumer debt and looks to save more money. The savings rate is now at 5.6%, the highest reading since 2012. Should this continue, it could mean slightly slower but more sustainable growth for the US economy. And consumers haven’t completely closed their checkbooks. Auto sales continue to move higher, while early holiday reports are that modest physical retail sales are being met with strong online sales, indicating a shift in method—not necessarily attitude—among US consumers.
Auto sales show US consumers aren’t dead, maybe just more prudent
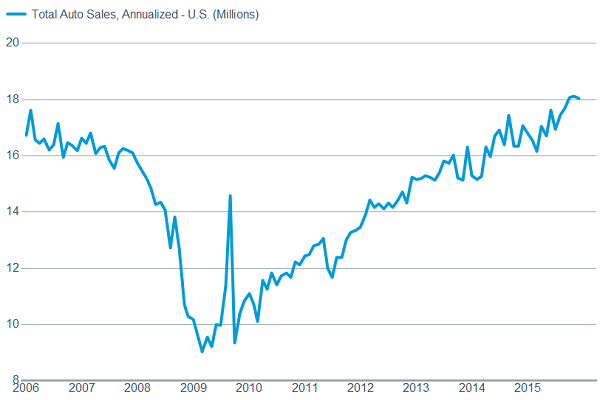
Source: Bloomberg. As of Dec. 8, 2015.
The future focus
There are myriad issues to contemplate when trying to divine the future, but the focus of the market heading into 2016 will likely continue to be the Fed. We believe an initial rate hike is likely at the December 16 Federal Open Market Committee (FOMC) meeting; which would be the first rate increase since 2006. But as we’ve been pointing out—and the Fed’s been reinforcing—it’s the path of hikes down the road that’s more important than the start date. At this point, the Fed has bent over backwards to soothe concerns by noting its desire to move gradually, allowing for the economy and markets to adjust. Slow rate hiking cycles have typically been positive for stocks, but with almost a decade having passed since the last hike, volatility is likely to persist.
We are entering a presidential election year; and while there will be copious amounts of rhetoric leading up to the election, it’s not typically until there are two candidates squaring off with actual proposals that the market pays much attention. It is interesting to note that the fourth year of the presidential cycle (the election year) has historically been the second best performing year in the four-year cycle, with an average gain of 11.3% since 1928 according to Strategas Research. Take that data with a grain of salt however; especially given that the third year historically has been the best by far; and the market bucked that tendency quite noticeably in 2015.
International opposing forces
The story was similar in most major international economies: manufacturing output surprised to the downside in 2015, while employment and consumer spending surprised to the upside. These forces pulling in opposite directions contributed to global stocks mirroring US stocks to some extent, and may end the year with near the unchanged line, measured by the MSCI AC World Index. In fact, despite rising volatility, throughout the year global stocks were never more than plus or minus 8% away from where they began the year.
Global manufacturing, excluding commodities, was relatively flat in 2015, according to data reported by the governments of major countries and regions like the United States, Eurozone, and Japan. But while manufacturing was in a slump, commodities crashed in 2015. The worst hit economies and markets were those most dependent upon natural resources. The commodity-driven downturns in the BARC (Brazil, Australia, Russia, and Canada) economies were felt in the stock markets of those countries with losses of -38%, -17%, -2%, -25%, respectively in US dollars*. Without a significant turnaround in commodity prices, which we do not foresee in 2016, conditions will likely remain challenging for these markets.
The global environment for stocks in 2016 may again be defined by opposing forces. As the Fed withdraws extraordinary economic stimulus through interest rate hikes, other major central banks, including the European Central Bank (ECB), Bank of Japan (BoJ), and Peoples Bank of China (PBoC), continue to pursue aggressive stimulus programs. Global central bank actions will likely play a significant role in driving market volatility and investor sentiment.
With inflation near zero, the ECB has announced an extension of its current quantitative easing (QE) program past the original end date of September 2016. The ongoing program may further the decline in the euro seen in 2015, and act as a boost for European exports and earnings. Though still sluggish, Eurozone corporate earnings have been improving and exceeding estimates by wider than average margins in recent quarters. Bucking the global trend, the region’s economic growth improved in 2015, as did job growth and business sentiment, and is expected to maintain the improved pace of growth in 2016. Even after a sharp rebound from the 2015 market correction, Eurozone stocks are still down about 10% from 2015’s high, while valuations are close to the historical average. These factors along with ongoing asset quality improvement that supports the financial sector, the largest sector of Europe's stock market, combine to make the region attractive to investors in 2016.
In Japan, exports have been impacted by slower demand from China. But this has been partially offset by the BoJ's QE program—which has weakened the yen and improved the attractiveness of Japan's exports—contributing to a 3.3% rise in merchandise exports to Europe over the past year, per data from Japan's Finance Ministry. Japan's economy posted solid growth in the third quarter; nevertheless, core inflation fell three months in a row pushing the BoJ to consider an even more aggressive pace of QE. Together with a fiscal stimulus proposal and pro-growth initiatives, including deregulation and corporate tax cuts, this should provide a positive economic and policy environment for Japanese stocks. While Japanese stocks outperformed US stocks by a wide margin to-date in 2015, below-average relative valuations and greater exposure to the technology and financial sectors make Japanese stocks attractive for investors again in 2016.
In 2015, emerging markets (EM) suffered a slowdown, but not a meltdown. An appreciating US dollar, falling commodity prices, and weak global trade have acted as a drag. A few factors have partially countered these forces and resulted in the MSCI EM Index experiencing a disappointing, rather than disastrous, loss of about -13% to-date in 2015. Inflation has been falling, enabling stimulus from some EM central banks, such as the PBoC. EM consumers have supported growth, especially in China, where retail sales were up 11% over the past year, per data from the National Statistics Bureau. Also, valuations of EM equities appear attractive and are trading below their long-term averages, which may have also limited their downside in 2015. Nevertheless, the trends in the dollar and commodity prices may continue to act as drags on EM stocks in 2016 even as improving economic growth acts as a boost.
2016 estimates at a glance
|
Country/Region |
2015 GDP |
2016 GDP |
Next 12 Months Earnings Growth |
2016 Central Bank Policy |
|
US |
2.6% |
2.8% |
13% |
Tightening |
|
Eurozone |
1.5% |
1.6% |
15% |
Easing |
|
Japan |
0.6% |
1.0% |
14% |
Easing |
|
Emerging Markets |
4.0% |
4.5% |
18% |
Mixed |
Source: Charles Schwab, International Monetary Fund World Economic Outlook October 2015, Factset data as of 12/9/2015.
If global earnings growth continues the improvement seen toward the end of 2015 along with global economic growth, 2016 should be a positive year for global stocks. However, we continue to expect further volatility as opposing forces continue to drive stocks both on the upside and downside.
*year-to-date performance through 12/8/2015 for the Ibovespa Brasil Sao Paulo Stock Exchange Index, FTSE All Share Index, Russian Trading System (RTS) Index, and S&P/TSX - Toronto Stock Exchange Index.
So what?
It’s been a “running to stand still” market this year, with US stocks breaking all-time records for the number of times they crossed above and below the flat performance line for the year. The start of 2016 looks to continue that grinding phase. Many global economies—including the United States—have become bifurcated, with manufacturing and commodities still struggling, but consumer and services sectors looking healthy. Investors should stick with their long-term allocations and not look to be either overly aggressive or defensive at this stage, given policy-related uncertainty. With some international central banks expanding their easing programs, assets in areas such as Europe, Japan and general emerging markets look relatively attractive and most investors should have exposure to those regions in a diversified portfolio.
(c) Charles Schwab


