Key Points
- U.S. equity indexes are within the summer’s range. But that doesn’t mean there hasn’t been action over the last three months as we believe a bullish rotation within equities may be taking place.
- The important third quarter earnings season is just gearing up, with expectations having been downgraded over the past couple of months, setting up the likelihood of a good quarter relative to expectations.
- However, some improvement in economic data and higher inflation readings leaves the possibility of tighter monetary policy from the Fed and even other central banks.
Flat, but not boring
U.S. equity indexes have made little headway over the past few months, but flat is relatively impressive given the obstacles of Fed and election uncertainty, some softer economic data, downgrades in earnings, and valuation concerns. But investors remain skeptical as sentiment, according to the Ned Davis Research (NDR) Crowd Sentiment Poll, remains neutral. Fund flows continue to show money flowing out of equity funds and into bond funds. The continued nervousness is understandable given the uncertainty, but we urge investors to stick with their long-term asset allocation and be careful about chasing yield. For income-oriented investors, do note that the percentage of S&P 500 stocks that have dividend yields above the 10-year Treasury yield is now near an all-time high at roughly 60% (NDR). For context, that’s up from below 10% between 1980 and 2000. The message is not to ignore the income that the equity portion of your portfolio may be generating.
We remain cautiously optimistic about stocks despite the recent sideways movement and the very real possibility of some “October surprises.” But remember, a market which is range-bound but more prone to pullbacks can allow earnings to catch up to price movements, helping to ease valuation concerns. Also, while the indexes have been flat, the rotation seen in the various sectors of the market bolsters our constructive view. Over the past three months, the more defensive sectors of utilities, consumer staples and telecommunications have been the worst performers; while the more cyclical sectors such as technology and financials have been the leaders. This indicates equity investors appear more willing to move out the risk spectrum, gaining confidence in the U.S. economic outlook. The outperformance of financials also likely reflects the belief that the Federal Reserve will hike rates later this year.
Economy perking up?
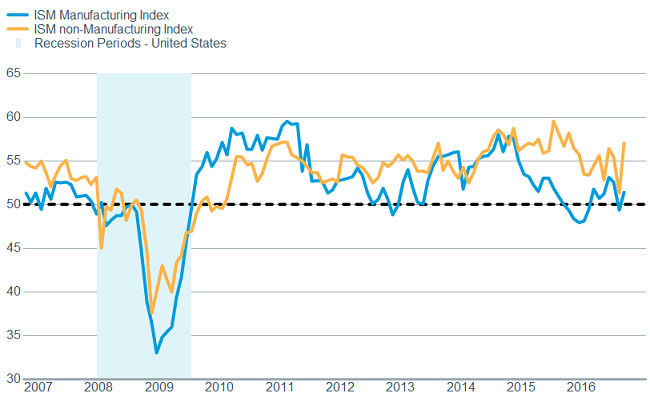
After a temporary soft patch in August, economic data has improved. The next couple of weeks will be data heavy and we’ll be watching closely to gauge likely Fed policy. We did see the closely-watched Institute of Supply Management’s (ISM) Manufacturing Index move back into territory depicting expansion—rising from 49.4 to 51.5. Importantly, the forward-looking new order component jumped from 49.1 to a strong 55.1, indicating improvement in corporate confidence in the future. Additionally, the ISM Non-Manufacturing Index—representing the much larger service side of the economy—jumped from 51.4 to 57.4, the largest single month increase in the history of the index. In addition, the new orders component rose to a robust 60.0.
ISM readings are both encouraging

Source: FactSet, Institute for Supply Management. As of Oct. 10, 2016.
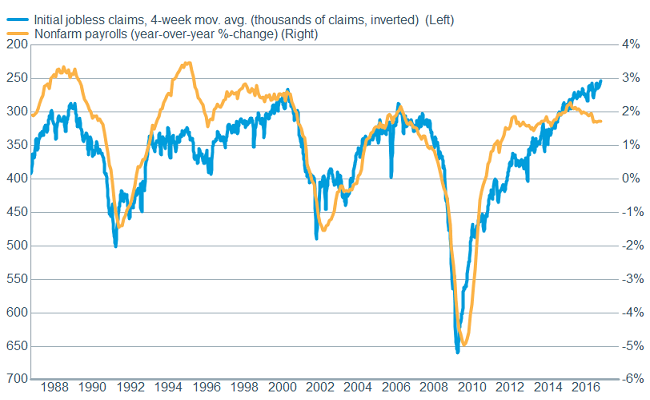
The forward looking initial jobless claims remains near historic lows, while the September jobs report showed that 156,000 jobs were added. While the unemployment rate ticked slightly higher to 5.0%, it was largely due to more people entering the workforce—considered a “good” rise in the unemployment rate.
Claims continue to indicate labor market improvement
Source: FactSet, U.S. Dept. of Labor. As of Oct. 10, 2016.
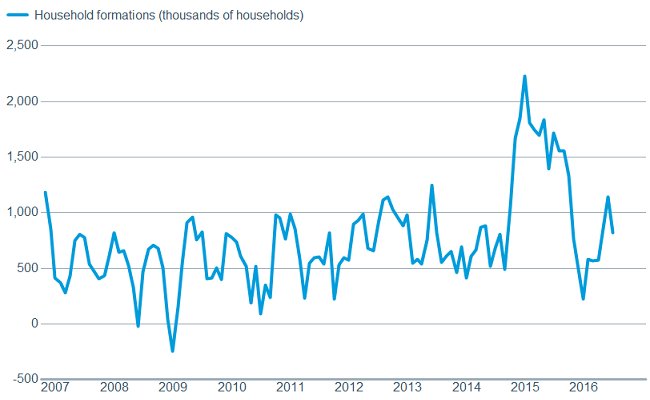
Although we’ve seen some soft housing data lately, we continue to believe that a strong job market, low interest rates, and increasing in household formations will bolster the housing market and increase the already solid level of consumer confidence.
Household formation shows signs of rising
Source: FactSet, Bloomberg. As of Oct. 10, 2016.
None of this stronger data suggests we’re about to see a rapid rise in economic growth though. In fact, the Atlanta Fed’s “GDPNow” projection for third quarter growth is down to 2.2% from 3.6% in early August. But that’s still up from the 1.1% real gross domestic product (GDP) growth average in the first half of the year; while the start to the fourth quarter is showing further improvement so far. The current earnings season—and projections and outlooks—could go a long way toward building on that story. Earnings estimates have steadily declined over the past month and the year-over-year change for the third quarter is expected to be negative according to Bloomberg. But with a typical “beat” level, which we believe is quite possible, earnings could finally break their negative streak.
Fed and election keeps investors on edge
These days there seems to be only two things on investors’ mind—the election and the Fed’s next move. The Fed has leaned in to a rate hike several times this year, only to pull back for a variety of reasons, leaving the Fed Funds rate unchanged since the December 2015 hike. Recent Fed commentary, including this week’s release of the September meeting minutes, has leaned more hawkish and futures markets have increased the odds of a Fed hike to more than 65% by year end. We continue to believe we’ll see a hike, likely in December, but don’t want to be too complacent about the upcoming November meeting. Most economists believe the Fed would be quite reluctant to act so close to an election, for fear of being accused of playing politics. However, some suggest the possibility of some “reverse psychology”—hiking prior to the election to “prove” they aren’t political. We’re leaning toward December.
As for the election, at least it’s almost over. While the market may have a kneejerk response to the results—especially if they represent a surprise relative to expectations—we urge investors to hold steady and not try to trade around the outcome. But we’re increasingly asked about what would be the least-settling outcome, and our response has been a Clinton win with one or both houses of Congress remaining in Republican control. The most unsettling would likely be a “Brexit”-type situation, where polls suggest a clear Clinton win, but we wake up and find Trump has won. Regardless of the outcome, do remember thought that this country has shown a remarkable ability to survive and thrive in all kinds of political environments, and we remain optimistic that it will continue to do so.
Inflation surprises
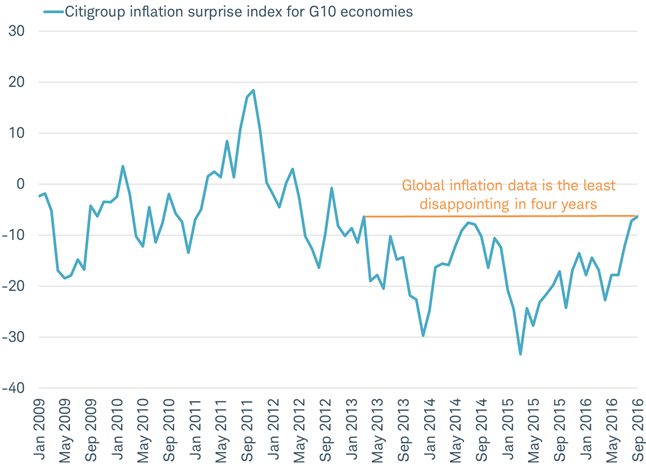
In the United States the Fed has noted that inflation is showing signs of picking up, while the International Monetary Fund (IMF) updated its world economic outlook in early October. It included a forecast for a rebound in the pace of global inflation from 0.3% in 2015, to more than double to 0.8% in 2016, and again more than double to 1.7% in 2017. Recent data has supported a stronger global inflation outlook. The Citigroup inflation surprise index for the world’s largest developed economies (the Group of 10)—which rises when inflation data exceeds economists’ expectations and falls when it misses expectations—is now the least disappointing it has been in four years, as you can see in the chart below.
Global inflation data is the least disappointing in four years
Source: Charles Schwab, Bloomberg data as of 10/11/2016.
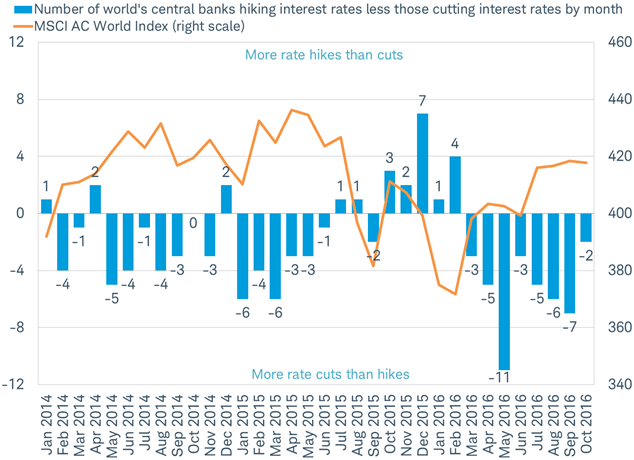
While inflation in emerging markets (EMs) is expected by the IMF to remain stable at around 4.5%, some EM central banks may raise interest rates in anticipation of a U.S. rate hike by the Fed in December, as they did last year. For years, more of the world’s central banks had been cutting rates each month than hiking them. But in the months surrounding the December 2015 Fed rate hike, there was a shift to rate hikes by many central banks, which led to a tightening of financial conditions and weighed on stock markets, as you can see in the chart below.
Global stocks slumped as central banks hiked rates in the months surrounding the first Fed rate hike in December 2015
Based on a study of 76 central banks.
October 2016 only reflects central bank actions through the 12th.
Source: Charles Schwab. Data through 10/12/2016.
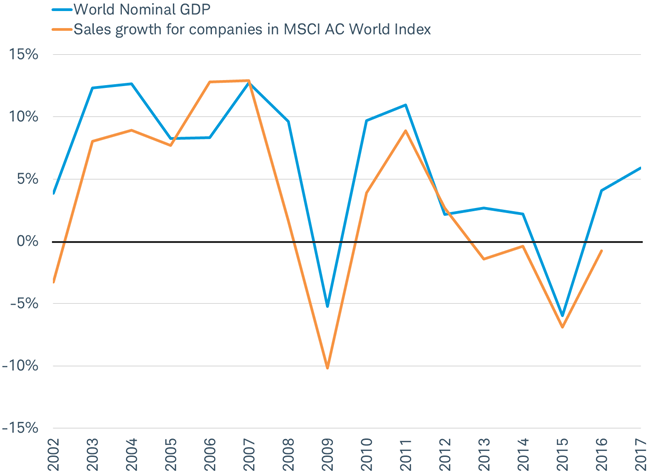
An offset to the potential negative impact on valuations from central bank rate hikes may be an improvement in sales growth. Nominal GDP growth (real GDP growth plus inflation) is forecast by the IMF to be over 5% in 2017 for the first time in six years. That could mean global corporate sales may actually grow in 2017 for the first time in several years, as you can see in the chart below.
Stronger nominal growth may lead to the return of corporate sales growth in 2017
Nominal GDP for 2016 and 2017 are IMF forecasts from the October 2016 World Economic Outlook.
Source: Charles Schwab, World Bank and Factset data as of 10/11/2016.
After eagerly seeking an upturn in inflation for several years, the world’s major central banks may finally be rewarded. The potential return of inflation from close to 0% in recent years to around 2% in 2017 has mixed implications for global stocks. A large number of rate hikes by central banks could pressure stock market valuations, but improving nominal economic growth could drive better sales in 2017. As a result, the return of inflation could foster an uptick in market volatility.
So what?
The U.S. stock market has held up well in the face of some fairly large obstacles and we believe that stronger earnings growth and better economic data should enable the long-running bull market to continue. We believe the Fed will hike rates one more time before year end, possibly encouraging tighter policy by other central banks as well. Tighter monetary policy, tied to the prospect of higher inflation globally, could make for a more volatile environment as the year comes to a close.
Important Disclosures
International investments are subject to additional risks such as currency fluctuations, political instability and the potential for illiquid markets. Investing in emerging markets can accentuate these risks.
The information provided here is for general informational purposes only and should not be considered an individualized recommendation or personalized investment advice. The investment strategies mentioned here may not be suitable for everyone. Each investor needs to review an investment strategy for his or her own particular situation before making any investment decision.
All expressions of opinion are subject to change without notice in reaction to shifting market, economic or political conditions. Data contained herein from third party providers is obtained from what are considered reliable sources. However, its accuracy, completeness or reliability cannot be guaranteed.
Past performance is no guarantee of future results. Forecasts contained herein are for illustrative purposes only, may be based upon proprietary research and are developed through analysis of historical public data.
Ned Davis Research (NDR) Daily Trading Sentiment Composite® shows perspective on a composite sentiment indicator designed to highlight short- to intermediate-term swings in investor psychology.
The Institute for Supply Management (ISM) Manufacturing Index is an index based on surveys of more than 300 manufacturing firms by the Institute of Supply Management. The ISM Manufacturing Index monitors employment, production inventories, new orders and supplier deliveries.
The Institute for Supply Management (ISM) Non-manufacturing Index is an index based on surveys of more than 400 non-manufacturing firms by the Institute of Supply Management. The ISM Non-manufacturing Index monitors employment, production inventories, new orders and supplier deliveries.
The Citigroup Economic Surprise Index measures the amount that economic activity surprised or disappointed relative to analyst expectations. It’s defined as weighted historical standard deviations of data surprises (actual releases vs Bloomberg survey median). A positive reading of the Economic Surprise Index suggests that economic releases have on balance beating consensus. The index is calculated daily in a rolling three-month window.
MSCI AC World Index is a market capitalization weighted index designed to provide a broad measure of equity-market performance throughout the world. The MSCI ACWI is maintained by Morgan Stanley Capital International, and is comprised of stocks from both developed and emerging markets.
The Schwab Center for Financial Research is a division of Charles Schwab & Co., Inc.
(1016-N7VE)
© Charles Schwab