Key Points
- U.S. equities turned around 180 degrees on a reduction in investor fear that had been building. We believe this is a positive shift, but underlying fundamentals haven't changed.
- Recent soft economic data contributed to the earlier stock market slump, but economic growth continues to muddle through, and a recession doesn't appear imminent. The earnings bar was set high as reporting season began, but companies have largely beaten expectations.
- Putting too much emphasis on political risk globally could be one of the bigger risks facing investors in the current environment.
Stocks make abrupt u-turn
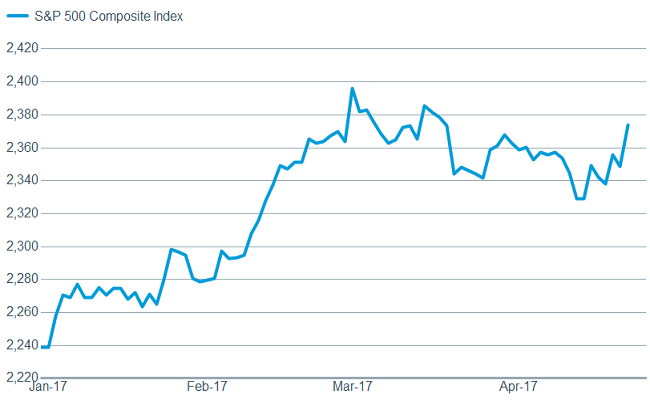
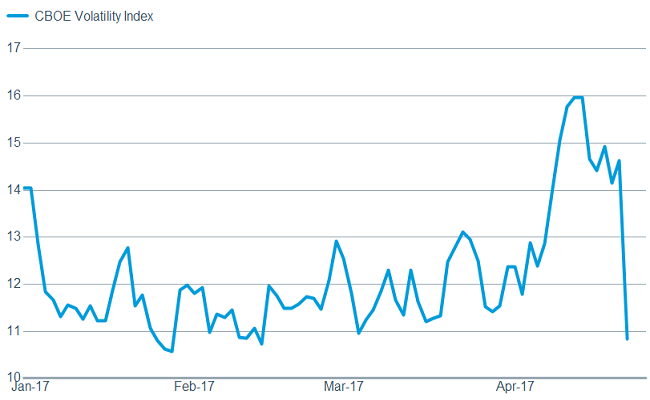
Recent market action has all the markings of a relief rally. The French vote in favor of centrist candidate Macron took "Frexit" off the table for now; a new tax cut proposal by the Trump administration, and the decreasing likelihood of a near-term U.S. government shutdown all appeared to play a part in the sharp rise in stocks and plunge in volatility.

Source: FactSet, Standard & Poor's. As of Apr. 25, 2017.
Source: FactSet, Chicago Board Options Exchange. As of Apr. 25, 2017.
There was a sharp reversal within the stock market as well during the pullback—or "risk off" phase. Defensive sectors, such as utilities and consumer staples benefitted from skittishness about the economy; while some more cyclical sectors, such as energy and financials had a rough go. In keeping with those moves, Treasury yields moved lower, illustrating a rising level of concern among investors. Notwithstanding geopolitical uncertainty and concerns about fiscal stimulus, our faith in the sustainability of the economic expansion was not tested, as leading indicators continue to point up. Instead, the consolidation period for U.S. stocks helped relieve some of the overbought conditions which had developed; which in turn helped alleviate overly optimistic sentiment. The Ned Davis Research Crowd Sentiment Poll moved back toward neutral territory and helped build a good base for the next move higher.
Those risk-off trades have suddenly staged a sharp reversal, with more cyclical areas of the market benefitting; while Treasury yields have moved higher, indicating a sudden appetite for increased risk. The change in market behavior is welcome, but it could swiftly bring back excess investor enthusiasm—often a contrarian indicator. In addition, U.S. growth experienced yet another soft patch in the first quarter; from which it needs to emerge to enable the bull market to continue.
Soft data but not overly concerning…yet
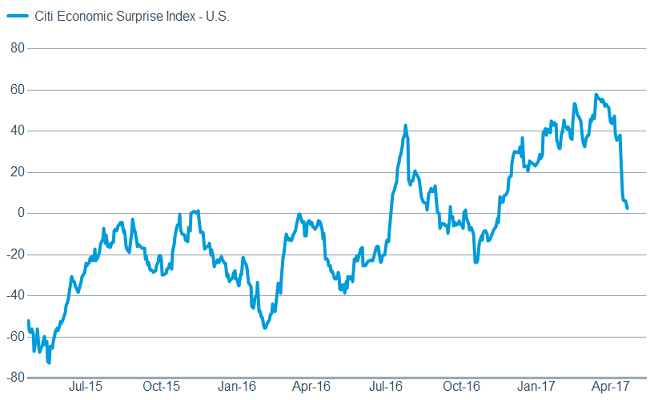
We have often highlighted that when it comes to the relationship between economic data and the stock market, better or worse tends to matter more than good or bad. Given the deterioration in the Citigroup Economic Surprise Index—which measures economic data relative to expectations—a pullback was to be expected.
Economic surprise downturn
Source: FactSet, Citigroup. As of Apr. 24, 2017.
This deterioration doesn't point to heightened recession risk; which is historically what ushers in extended bear markets in stocks.
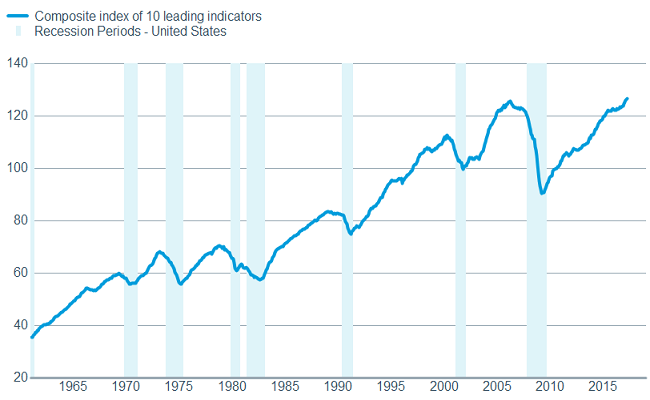
According to The Conference Board's Index of Leading Economic Indicators (LEI), the U.S. economy remains on track.
Leading indicators still flashing green
Source: FactSet, U.S. Conference Board. As of Apr. 24, 2017.
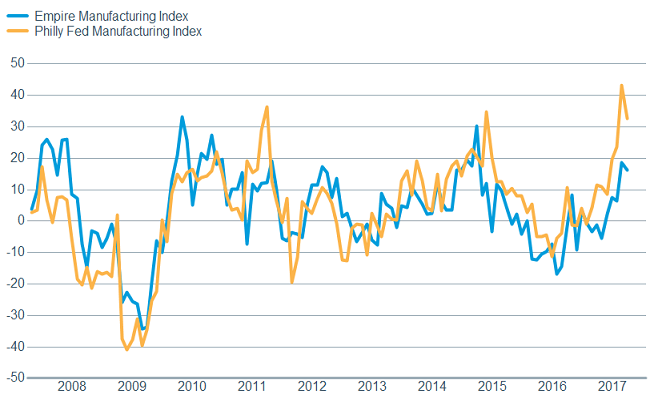
We have started to see a modest retreat in "soft" data which may indicate more realism entering the market. In addition to the modestly weaker ISM manufacturing and services indexes earlier in the month (the former is represented in the LEI), we have recently seen weaker regional survey data. Both the Empire Manufacturing Index and the Philly Fed Index retreated, although all of these surveys remain in territory depicting expansion.
Regional surveys softening a bit
Source: FactSet, Federal Reserve Bank of New York, Federal Reserve Bank of Philadelphia. As of Apr. 24, 2017.
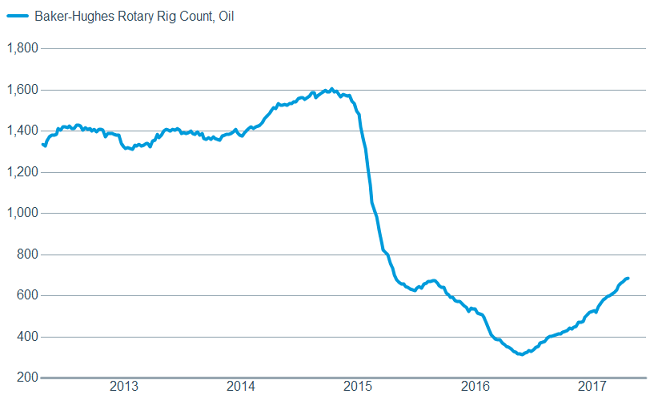
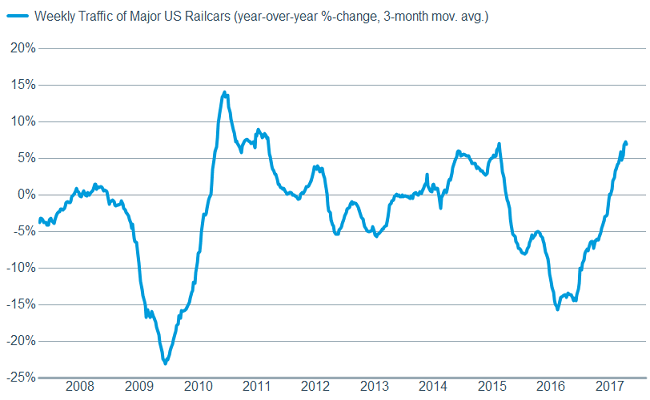
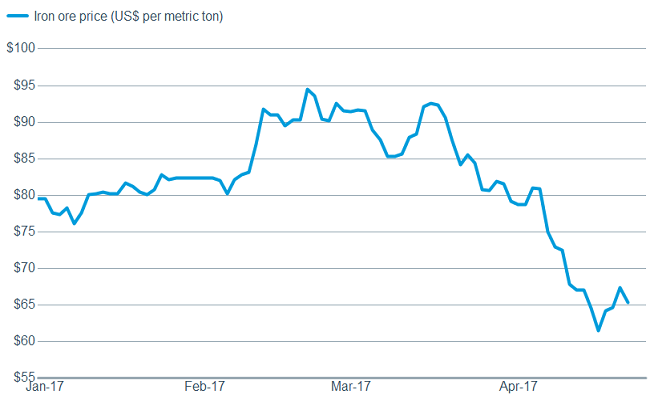
We believe this taming of optimism is both healthy and a bit more realistic. We don't believe that trend growth is as low as the 0.7% real gross domestic product (GDP) print posted for this year's first quarter, but neither do we believe the economy has accelerated markedly. Economic data has been mixed, especially within the industrial sector: the rig count and railcar loadings have both accelerated; but iron ore prices have fallen, indicating some cyclical weakness.
A mixed picture that leans positive
Source: FactSet, Baker Hughes, Inc. As of Apr. 24, 2017.
Source: FactSet, Association of American Railroads (AAR). As of Apr. 24, 2017.
Source: FactSet, Commodity Research Bureau. As of Apr. 25, 2017. China import Iron Ore Fines 62% FE spot.
We continue to believe that fuel for the bull market will also come from improving earnings. The expectations bar was set fairly high heading into this reporting season, but for the most part companies have been beating those elevated expectations. To date, 75% of S&P 500 companies have beaten bottom-line earnings expectations. But although companies beating estimates have mostly seen their stocks rewarded, the few that have missed have been punished rather harshly.
Government may be helping more than realized
Some of the recent swing in sentiment, and market action, can be attributed to the shifting political hopes in both Washington DC and abroad. The recent individual and corporate tax reform proposal from the Trump administration was initially cheered by the market; but we caution that there is a long road ahead amid likely fierce opposition from Democrats and deficit-minded Republicans. In general, corporate leaders continue to laud a more business-friendly environment, and that this heightened confidence should lead to more capital spending and longer-term investments. We may be seeing some of that already, with Evercore ISI Research reporting that the North American Equipment Dealers Survey, which has been a good indicator of the direction of capex spending, has moved higher based on the six month sales outlook.
And while the Federal Reserve continues to be a focus of investors, it seems unlikely that we'll see another move in rates at the Fed’s meeting in early May. As noted above, U.S. economic data has been mixed and inflation data has been soft, so there is very little impetus for the Fed to move against a market which is expecting no action.
Political risk
As we've seen with the shifts in sentiment mentioned above, one risk for investors in 2017 may be putting too much emphasis on political risk—in the United States and globally. On a daily basis, political headlines can nudge stock markets one way or another, but the gains over the past year are really less about politics and more about stronger global growth.
History shows that the economy and markets have a bigger impact on politics than the other way around. While the media still features stories about the risks to investors of a global wave of populist political sentiment, it may have failed to notice that we have had four elections since Brexit where populists did worse than expected: Spain, Austria, Netherlands and now France. The outcomes of these votes have been unsurprising and favored establishment candidates; highlighting the fading of political risk as global economic growth picks up and concerns over immigration recede.
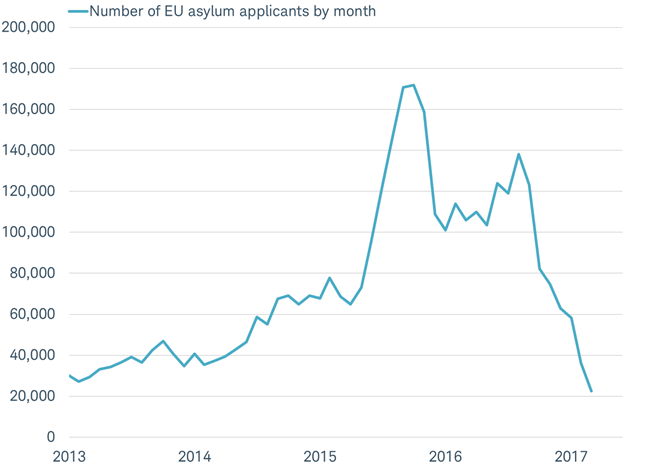
As we noted after the Netherlands election in mid-March, plunging European Union (EU) immigration—the issue fueling much of the rise in anti-EU sentiment in 2014-2016—may mean the political influence of populists peaked in 2016, as you can see in the chart below.
Number of EU asylum seekers has plunged with the political clout of populists in Europe
Source: Charles Schwab, Eurostat data as of 4/26/2017
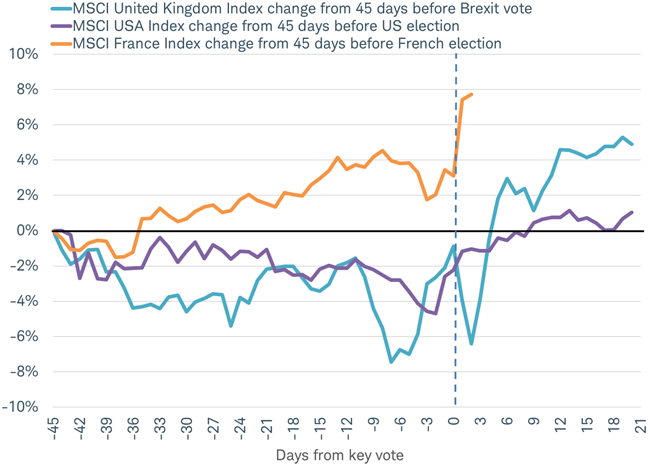
An even more important takeaway from the global political drama is that stocks have continued to rise over the past year; whether the votes were surprise wins for populists (Brexit, U.S. election) or expected outcomes for mainstream candidates. It hasn't paid to be overly cautious by focusing on the drama of political risk. We can see that even though French stocks bucked the trend of other key votes by posting gains during the 45 days ahead of the vote, they still rallied just as sharply following the vote.
French stocks post gains before and after first round election
Source: Charles Schwab, Bloomberg data as of 4/25/2017.
As for what’s next for France, centrist candidate Emmanuel Macron is expected to beat "Frexit" candidate Marine Le Pen in the second round election on May 7. The voting in the first round was close, but polls indicate Macron could lead by more than 20% in the second round. While we know that polls can’t always be trusted, this is a much larger lead than those that lead to surprise outcomes in the Brexit vote and U.S. election.
While the odds of a Le Pen win are low, they are not zero. Le Pen finished lower in the polls than expected several weeks ago, but she still made the second round. Nevertheless, even in the event of a win by Le Pen, a Frexit is unlikely. Little representation of Le Pen's party in parliament and relatively high support for the euro would be big hurdles for Le Pen to overcome to produce a Frexit. The EU has not proven to be as fragile as perceived: the European debt crisis in 2011-2012 led to a deepening of financial integration rather than pulling it apart; the Brexit vote has not led to a flood of other national referendums to leave the EU; and support among citizens for the euro is at a 12-year high.
So what?
A shift in sentiment has led to a sharp reversal in market action recently, with leadership shifting back toward cyclical areas of the market. We continue to believe the bull market will continue due to decent economic growth and a good profits picture, but there will likely be sentiment-driven dips and surges to come. We urge investors to remain disciplined and focus on longer-term horizons and the underlying fundamentals of the economy.
Important Disclosures
International investments are subject to additional risks such as currency fluctuations, political instability and the potential for illiquid markets. Investing in emerging markets can accentuate these risks.
The information provided here is for general informational purposes only and should not be considered an individualized recommendation or personalized investment advice. The investment strategies mentioned here may not be suitable for everyone. Each investor needs to review an investment strategy for his or her own particular situation before making any investment decision.
All expressions of opinion are subject to change without notice in reaction to shifting market, economic or political conditions. Data contained herein from third party providers is obtained from what are considered reliable sources. However, its accuracy, completeness or reliability cannot be guaranteed.
Diversification and rebalancing a portfolio cannot assure a profit or protect against a loss in any given market environment. Rebalancing may cause investors to incur transaction costs and, when rebalancing a non-retirement account, taxable events may be created that may affect your tax liability.
Past performance is no guarantee of future results. Forecasts contained herein are for illustrative purposes only, may be based upon proprietary research and are developed through analysis of historical public data.
The S&P 500 Composite Index is a market capitalization-weighted index of 500 of the most widely-held U.S. companies in the industrial, transportation, utility, and financial sectors.
The Chicago Board of Exchange (CBOE) Volatility Index (VIX) is an index which provides a general indication on the expected level of implied volatility in the US market over the next 30 days.
The Citigroup Economic Surprise Index measures the amount that economic activity surprised or disappointed relative to analyst expectations. It’s defined as weighted historical standard deviations of data surprises (actual releases vs Bloomberg survey median). A positive reading of the Economic Surprise Index suggests that economic releases have on balance beating consensus. The index is calculated daily in a rolling three-month window.
Composite Index of 10 leading Indicators is an index that is a composite average of ten leading indicators in the US complied by the Conference Board. It is designed to signal peaks and troughs in the business cycle, generally known as the leading economic index (LEI). Components of the LEI include average weekly manufacturing hours, average weekly initial claims, new orders for consumer goods and non-defense capital goods, building permits and stock prices. Other components are indexes of supplier deliveries and consumer expectations, M2 money supply and the interest rate spread between 10-year Treasury bonds and federal funds.
The Empire Manufacturing State Index is a regional, seasonally-adjusted index published by the Federal Reserve Bank of New York distributed to roughly 175 manufacturing executives and asks questions intended to gauge business conditions for New York manufacturers.
The Philadelphia Federal Index is an index that is published by the Philadelphia Federal Reserve Bank and is constructed from a survey of participants who voluntarily answer questions regarding the direction of change in their overall business activities. The survey is a measure of regional manufacturing growth.
The MSCI United Kingdom Index is designed to measure the performance of the large and mid cap segments of the UK market. With 113 constituents, the index covers approximately 85% of the free float-adjusted market capitalization in the UK.
The MSCI USA Index is designed to measure the performance of the large and mid cap segments of the US market. With 626 constituents, the index covers approximately 85% of the free float-adjusted market capitalization in the US.
The MSCI France Index is designed to measure the performance of the large and mid cap segments of the French market. With 76 constituents, the index covers about 85% of the equity universe in France.
The Institute for Supply Management (ISM) Manufacturing Index is an index based on surveys of more than 300 manufacturing firms by the Institute of Supply Management. The ISM Manufacturing Index monitors employment, production inventories, new orders and supplier deliveries.
The Institute for Supply Management (ISM) Non-manufacturing Index is an index based on surveys of more than 400 non-manufacturing firms by the Institute of Supply Management. The ISM Non-manufacturing Index monitors employment, production inventories, new orders and supplier deliveries.
The Schwab Center for Financial Research is a division of Charles Schwab & Co., Inc.
© Charles Schwab
Read more commentaries by Charles Schwab