Key Points
-
If the stock market gains of the past 10 years are largely attributable to central bank purchases, then the return of growth to central bank balance sheets that began this month would be a strong positive signal for stock market investors.
-
Yet, analysis reveals no consistent relationship between growth in central bank balance sheets and growth in the stock market on a rolling 12 month basis.
-
As we head into 2020, investors should be cautious in assuming that the return of central bank balance sheet growth means stocks will follow along.
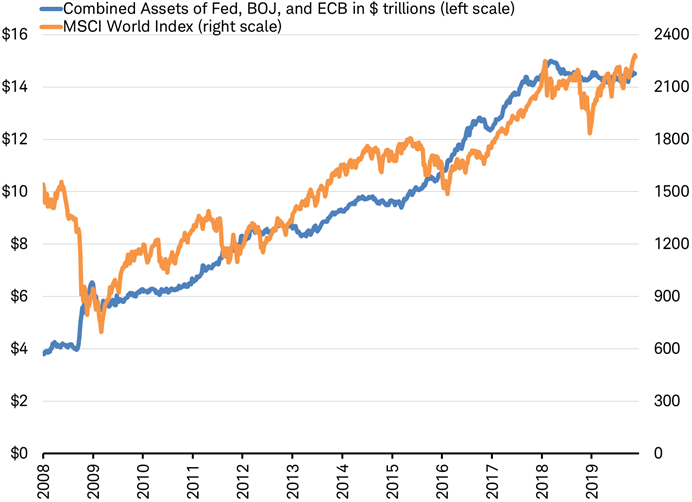
There seems to be a widely held view that Quantitative Easing (QE), more specifically central bank bond purchases, lifts the stock market. Some expand this view further believing the stock market gains of the past 10 years are largely attributable to central bank purchases, supported by the fact that central bank balance sheets and the stock market have both generally been on the rise since the financial crisis, as you can see in the chart below.
On the rise: central bank assets and stocks

Fed=Federal Reserve, ECB=European Central Bank, BOJ=Bank of Japan
Source: Charles Schwab, Bloomberg data as of 11/22/2019. Past performance is no guarantee of future results.
This would suggest that when central banks are buying investors should expect gains, and when they are not stocks may struggle. If true, the return of growth to central bank balance sheets that began this month would be a strong positive signal for stock market investors.
Yet, history doesn’t support such a simplistic relationship. There have been periods over the past 10 years when central banks slowed their buying or even trimmed their balances sheets and stocks still went up and periods when the banks increased their purchases yet stocks slid. In fact, central bank balance sheets shrank during much of 2019’s global stock market rally. Now that central bank balance sheets are back to growing again, it’s worth taking a look at this relationship and what it may tell us about the stock market in 2020.
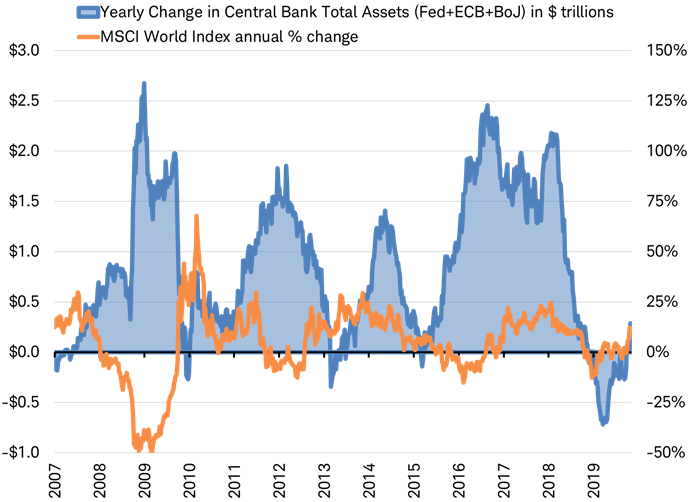
The chart below shows little to no consistent relationship between growth in central bank balance sheets and growth in the stock market on a rolling 12 month basis.
No consistent relationship: growth in QE and stocks appear unrelated
Source: Charles Schwab, Bloomberg data as of 11/22/2019. Past performance is no guarantee of future results.
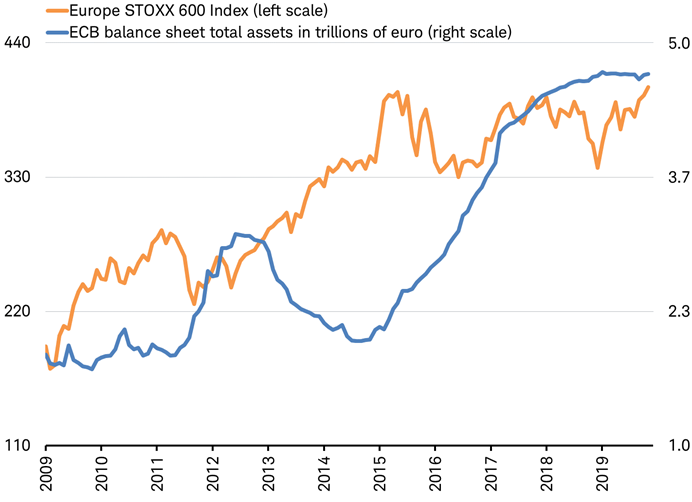
A driver of the upturn in central bank assets in the past month seen at the end of the above chart can be found in Europe. The European Central Bank (ECB) restarted QE on November 1. Looking at the relationship between the ECB’s balance sheet and the European stock market we can see that while both have risen over time, they have done so out of sync with each other. European stocks fell as the ECB balance sheet grew and rose as the balance sheet shrank, as you can see in the chart below.
Out of sync: the ECB balance sheet and Europe’s stock market
Source: Charles Schwab, Factset data as of 11/22/2019. Past performance is no guarantee of future results.
Instead of tracking QE, stocks moved more in sync with the outlook for growth in the economy and earnings. The growth outlook worsened in 2011 with the European debt crisis, in 2015 as China slowed and oil prices plunged, and in late 2018 as the trade war heated up. Sometimes central banks increased asset purchases in response to these threats, but it’s more likely that stocks tracked changes in the outlook rather than the central bank responses.
As we head into 2020, investors should be cautious in assuming that the return of central bank balance sheet growth means stocks will follow along. The real driver of the stock market in 2020 may be the outlook for growth tied to prospects for a comprehensive U.S.-China trade deal, which may revive growth in manufacturing and corporate earnings.
Important Disclosures
The information provided here is for general informational purposes only and should not be considered an individualized recommendation or personalized investment advice. The investment strategies mentioned here may not be suitable for everyone. Each investor needs to review an investment strategy for his or her own particular situation before making any investment decision.
All expressions of opinion are subject to change without notice in reaction to shifting market or economic conditions. Data contained herein from third party providers is obtained from what are considered reliable sources. However, its accuracy, completeness or reliability cannot be guaranteed. Supporting documentation for any claims or statistical information is available upon request.
Past performance is no guarantee of future results and the opinions presented cannot be viewed as an indicator of future performance.
Investing involves risk including loss of principal. International investments involve additional risks, which include differences in financial accounting standards, currency fluctuations, geopolitical risk, foreign taxes and regulations, and the potential for illiquid markets. Investing in emerging markets may accentuate these risks.
Fixed income securities are subject to increased loss of principal during periods of rising interest rates. Investment value will fluctuate, and bond investments, when sold, may be worth more or less than original cost. Fixed income securities are subject to various other risks, including changes in interest rates and credit quality, market valuations, liquidity, prepayments, early redemption, corporate events, tax ramifications, and other factors. High-yield bonds and lower-rated securities are subject to greater credit risk, default risk and liquidity risk.
Indexes are unmanaged, do not incur management fees, costs and expenses, and cannot be invested in directly.
The MSCI World Index captures large and mid-cap representation across 23 Developed Markets (DM) countries. With 1,651 constituents, the index covers approximately 85% of the free float-adjusted market capitalization in each country.
The Europe STOXX 600 Index has a fixed number of 600 components representing large, mid and small capitalization companies among 17 European countries, covering approximately 90% of the free-float market capitalization of the European stock market. The countries that make up the index are the United Kingdom France, Germany and Switzerland, as well as Austria, Belgium, Denmark, Finland, Ireland, Italy, Luxembourg, the Netherlands, Norway, Poland, Portugal, Spain, and Sweden.
© Charles Schwab & Co.
© Charles Schwab
Read more commentaries by Charles Schwab