Economic indicators are released every week to help provide insight into the overall health of the U.S. economy. With the Fed’s tightening on monetary policy and the constant threat of a recession looming, policymakers and advisors are closely monitoring economic indicators because the data can ultimately impact business decisions and financial markets. In the week ending on August 17th, the SPDR S&P 500 ETF Trust (SPY) fell 2.16%, while the Invesco S&P 500® Equal Weight ETF (RSP) was down 2.79%.
In this article, we look at three closely watched indicators from the past week – the Conference Board Leading Economic Index, retail sales, and industrial production. By examining these data points, we gain crucial insights into different aspects of economic activity, which subsequently help provide us with a better understanding of the economy’s trajectory.
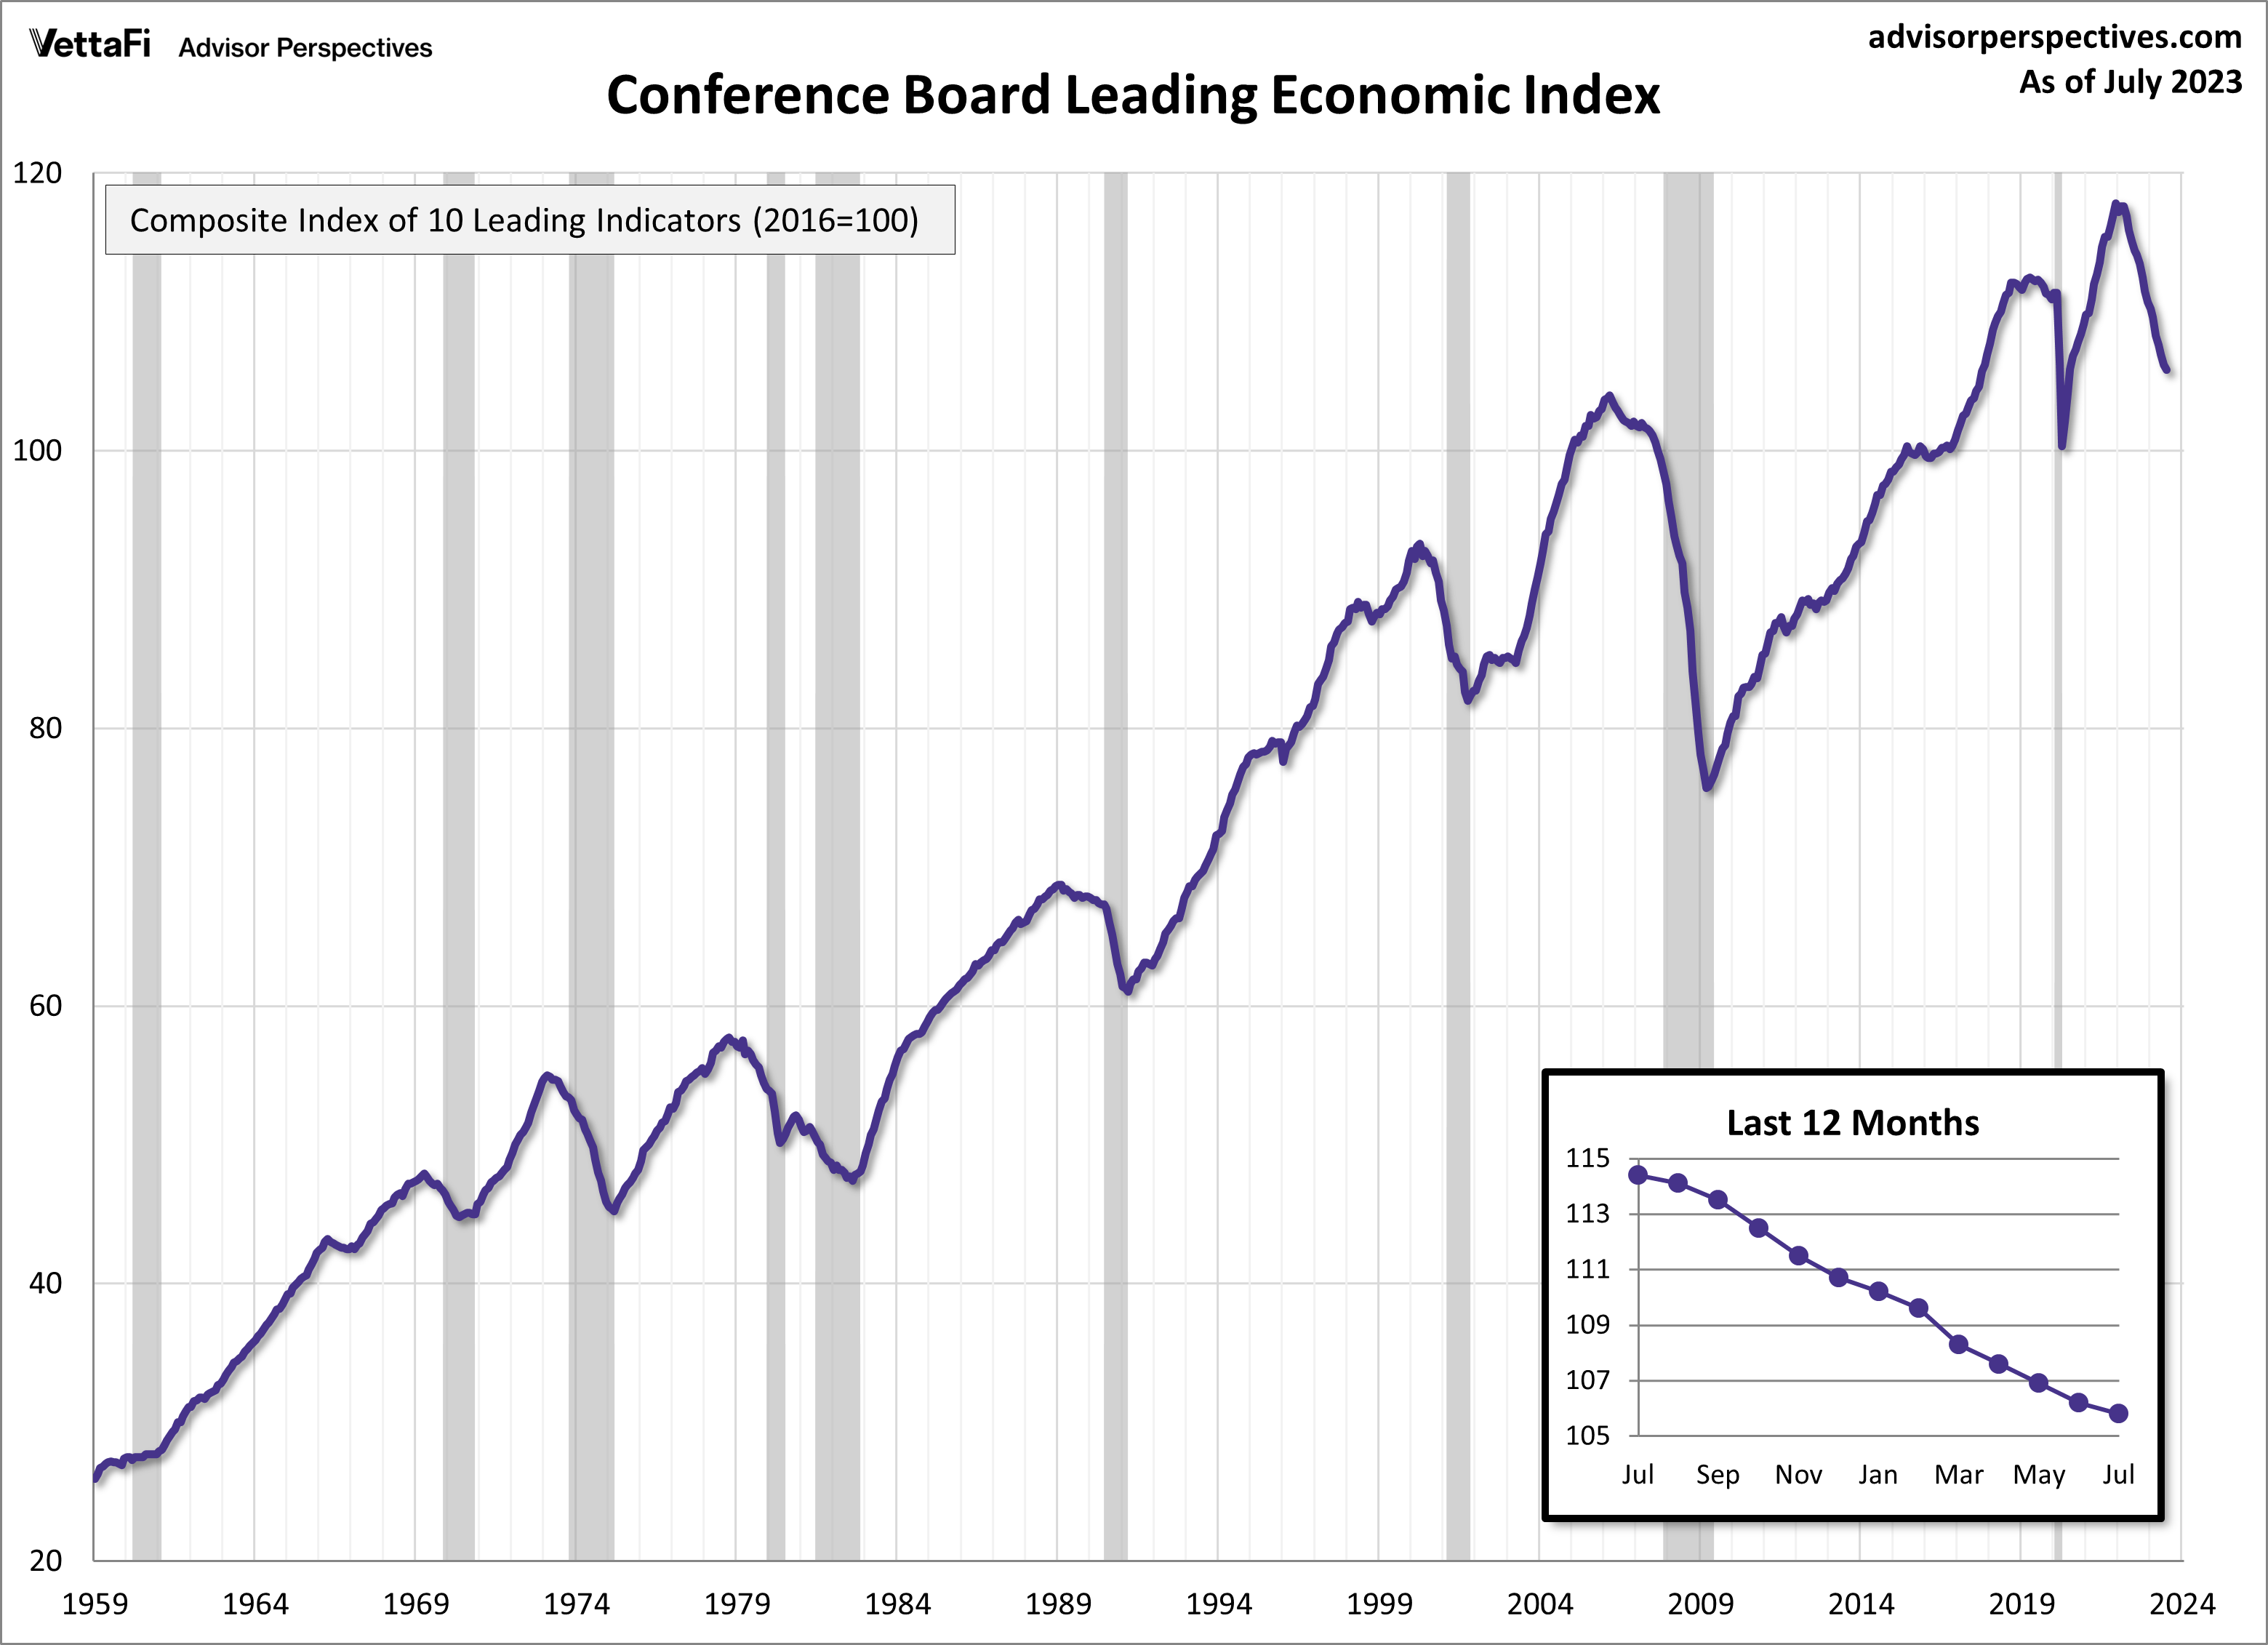
Leading Economic Index
The Conference Board Leading Economic Index (LEI), a composite index designed to predict the economy’s trajectory, continues to sound alarms about future economic uncertainty. July marked the 16th consecutive month of decline for the LEI, with 0.4% drop to 105.8 – its lowest reading since 2020. This lengthy sequence of monthly declines, reminiscent of the period leading up to the 2007-2008 Great Recession, bolsters the Conference Board’s conviction about an impending recession. More specifically, the Conference Board is projecting a short and shallow recession spanning from Q4 2023 to Q1 2024 due to the index’s indications of slowing economic activity.
In July, eight of the index’s ten components made negative contributions, with the largest declines coming from average consumer expectations for business conditions, ISM® New Orders Index, and the interest rate spread (10-year Treasury bonds less federal funds rate). The two positive contributors were the S&P 500® Index of Stock Prices and the average weekly initial claims for unemployment insurance.

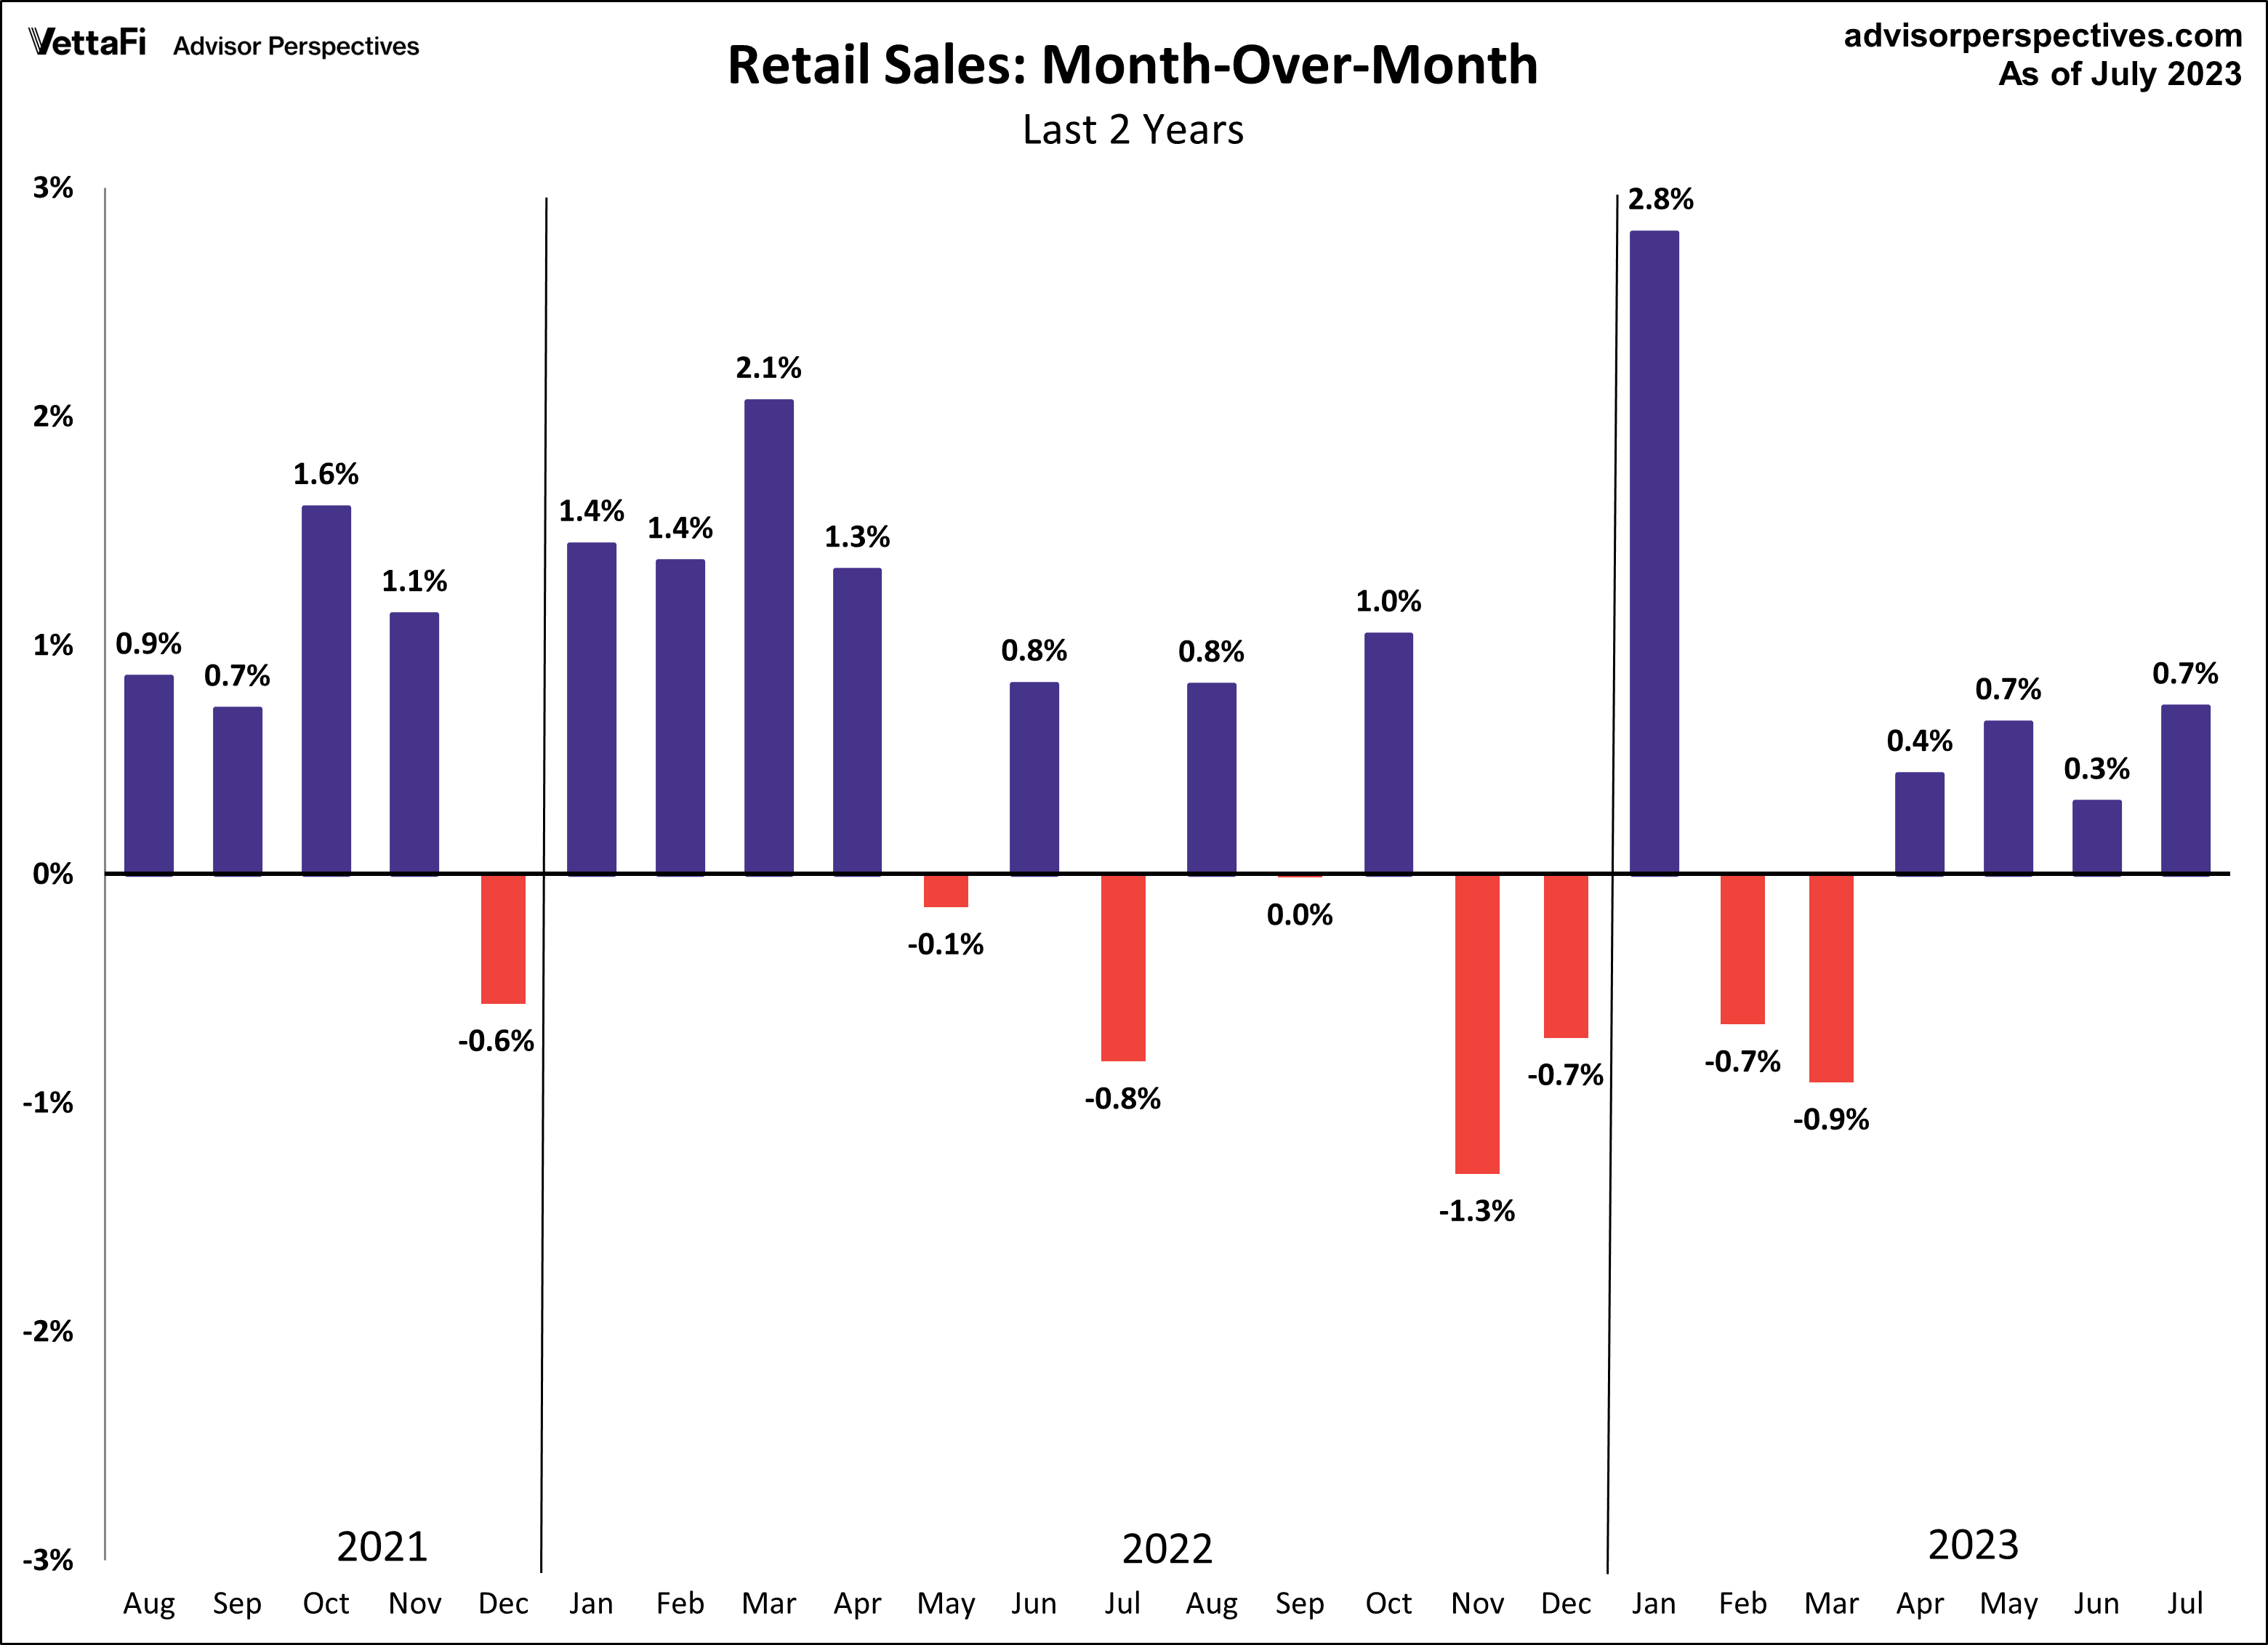
Retail Sales
American consumers are not ready to put their wallets away just yet as spending rose for a fourth consecutive month. Retail sales increased 0.7% in July from the previous month, exceeding expectations of 0.4% growth in purchases. Core retail sales (excluding automobiles) were up 1.0% from last month, defying expectations of a 0.3% decline. Lastly, control purchases, which is thought to be an even more “core” view of retail sales, were up 1.0% from last month. While this series typically does not garner as much attention as the headline and core figures, control purchases are a more consistent and reliable reading of the economy.
Despite facing various challenges, such as higher interest rates, tightening credit conditions, inflation, and economic uncertainty, U.S. consumers have been fueling the economy for much of this year. Consumer spending has increased in five of the seven months this year, demonstrating the resiliency of consumers. However, with student loan repayments, a potential resurgence in inflation, and cooling wage growth on the horizon, consumer spending may retreat in the coming months. Retail sales will have an impact on the interest in the SPDR S&P Retail ETF (XRT).
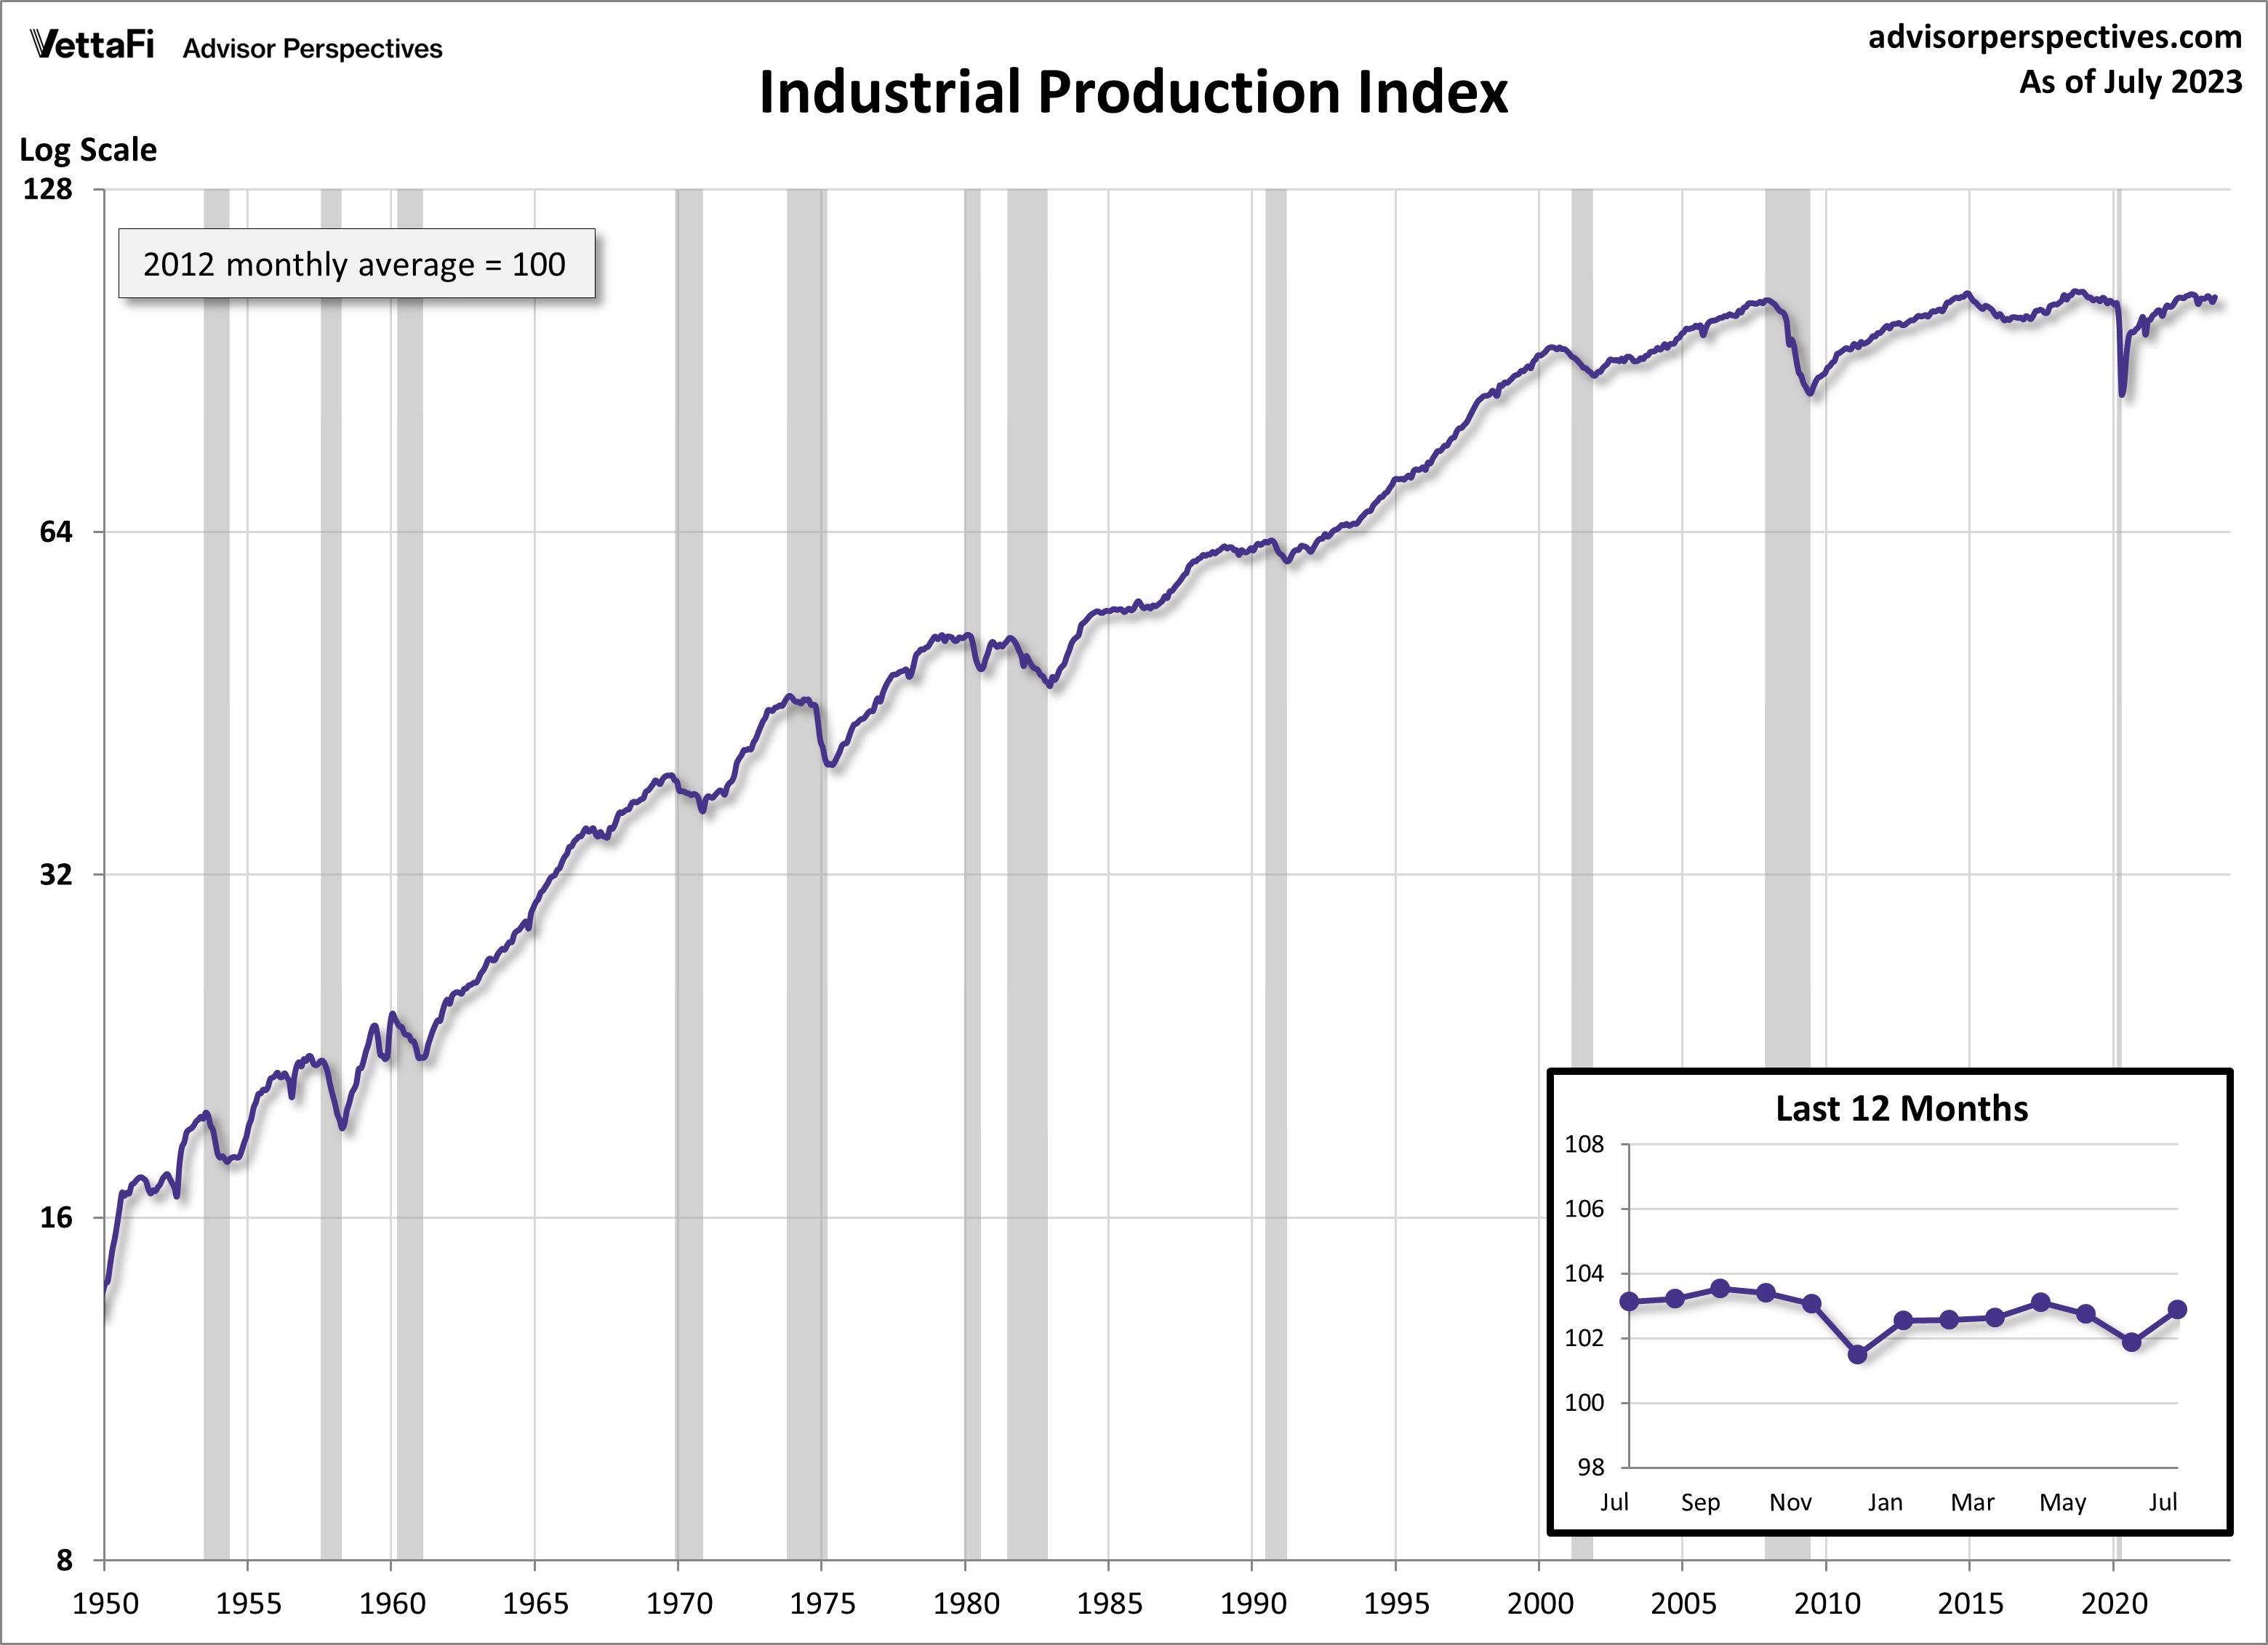
Industrial Production
U.S. factory output rebounded in July, surpassing expectations and reversing two consecutive months of decline. Industrial production rose 1.0% in July, outpacing the 0.3% projected growth. A breakdown of the index reveals that last month’s growth can be largely attributed to two sectors: autos and utilities. Specifically, the production of motor vehicles and parts jumped 5.2%, while the high July temperatures caused a 5.4% spike in the utilities index. Compared to one year ago, industrial production was down 0.23%, marking the third straight month of negative year-over-year readings.
Capacity utilization, which measures the amount of slack in the economy by comparing current production output to its maximum potential output, also rose for the first time in three months. The latest reading of the capacity utilization index was up 0.9% from last month to 79.3, surpassing the 79.1 forecast. In addition to showing cycles of economic growth and demand, capacity utilization also serves as a leading indicator of inflation, rendering it a closely monitored measure of economic health.
Economic Indicators and the Week Ahead
This week we’ll get a sense of consumer attitudes toward the economy as well as some key housing market insights. On Tuesday, the National Association of Realtors will release July’s data on existing home sales, while on Wednesday, the Census Bureau will issue data on new home sales. Persistent constraints on existing home inventory have led to a prolonged decline in existing home sales over the past year and a half. In response, new home sales have surged, emerging as the primary choice for homebuyers amidst the scarcity of existing options. Existing and new home sales could impact homebuilders and residential real-estate ETFs such as iShares U.S. Home Construction ETF (ITB), SPDR S&P Homebuilders ETF (XHB), and iShares Residential and Multisector Real Estate ETF (REZ).
Lastly, on Friday, the University of Michigan will release this month’s final reading of its Consumer Sentiment Index. Finally, consumer attitudes are expected to be essentially unchanged from last month. The final report for the Michigan Consumer Sentiment Index is predicted to remain at the preliminary reading of 71.2, a slight dip from last month’s interim high. The Consumer Discretionary Select Sector SPDR ETF (XLY) is tied to consumer sentiment.
Originally published on ETFTrends.com on August 18, 2023.
A message from Advisor Perspectives and VettaFi: To learn more about this and other topics, check out our most recent white papers.
Read more commentaries by VettaFi