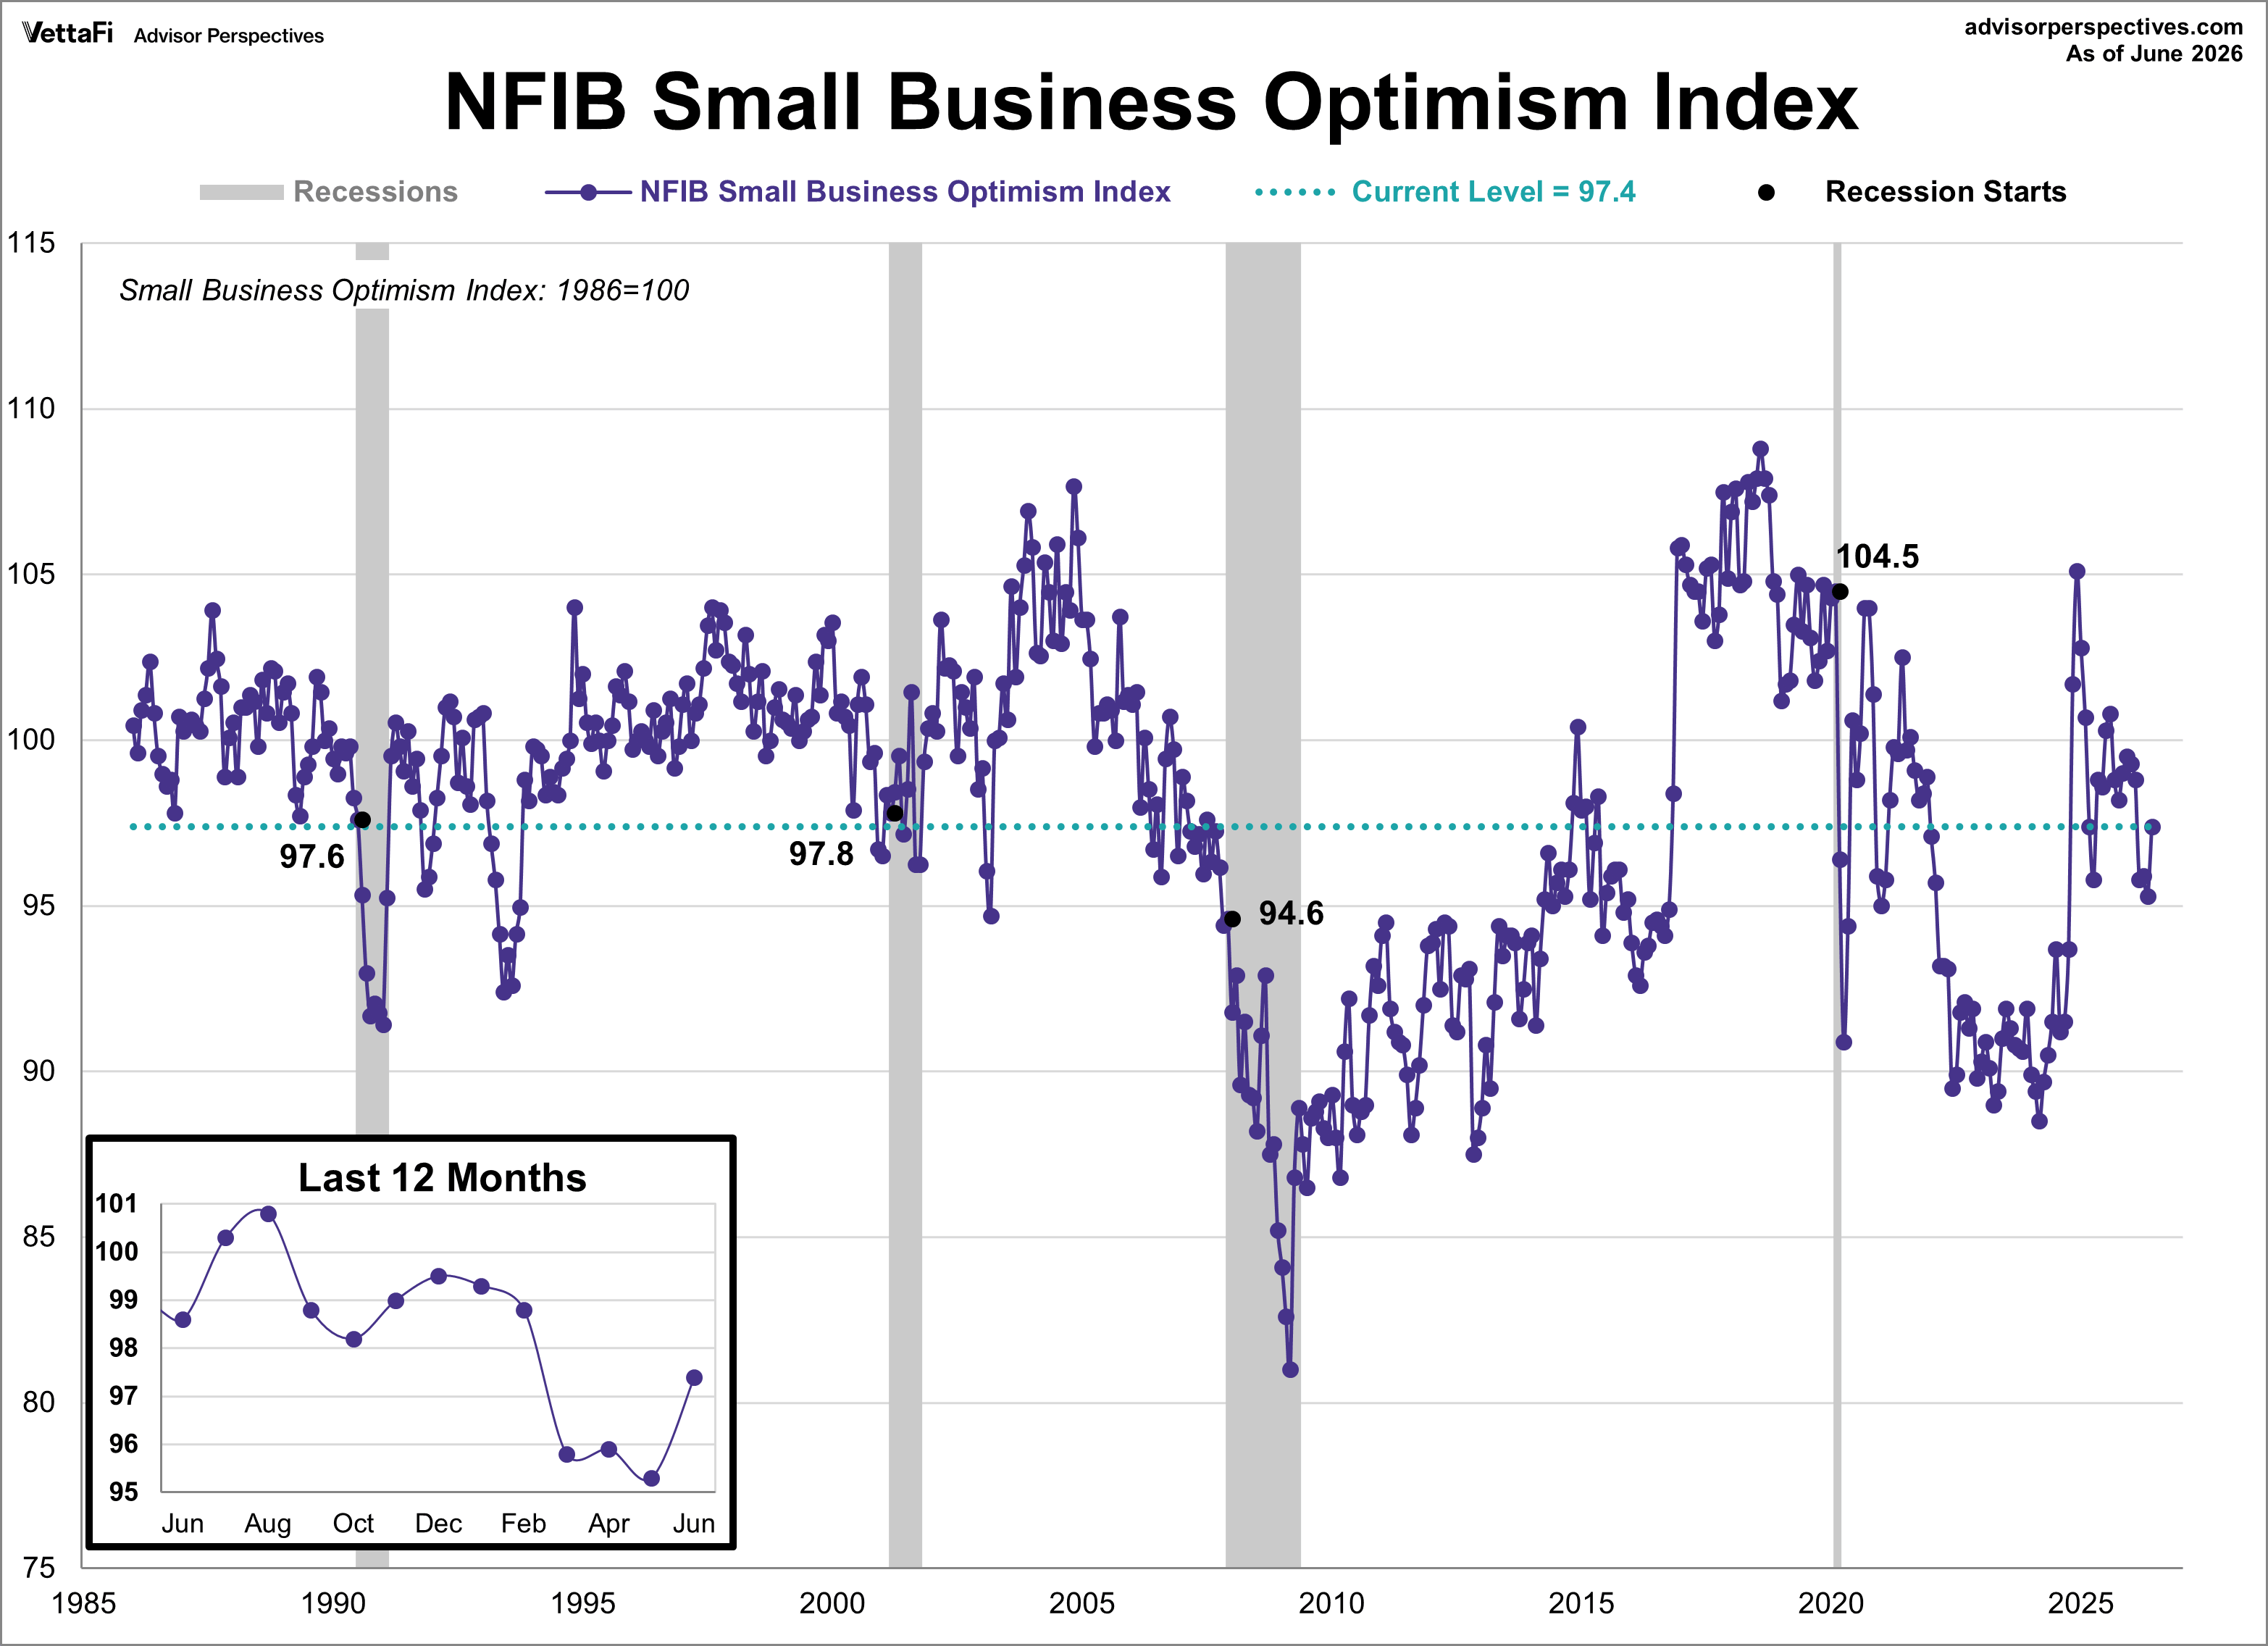
The NFIB Small Business Optimism Index rose 2.1 points to 97.4, beating the 95.8 forecast and reaching its highest level since February. However, the index remains below its historical average for a fourth straight month and puts it in the 37th percentile of the series.
“Current economic conditions present small business owners with both encouraging developments and ongoing challenges,” said NFIB Chief Economist Bill Dunkelberg. “Lower fuel costs provide welcome relief for businesses as well as consumers, with firms anticipating improved operating conditions over the next six months. While there have been improvements in the overall environment, high interest rates and modest economic growth are causing owners to approach hiring and capital spending with caution.”
Key Takeaways from June's report:
-
Inflation Remains the Top Problem: Inflation continues to plague small businesses, with 21% of owners naming it as their single most important business challenge. This marks the highest level recorded since October 2024.
-
Optimism About the Future Spikes: For the first time this year, business owners are growing significantly more confident about economic conditions.
-
Prices Keep Rising, But Future Hikes May Slow Down: A net 38% of owners raised their average selling prices, marking the fourth consecutive monthly increase and the highest level since January 2023. However, the share of owners planning to raise prices in the near future dropped slightly to a net 32%.
-
Hiring Demand Rebounds Amid Worker Shortages: Finding help remains a critical issue, as 32% of small business owners reported job openings they could not fill. To combat this, a net 11% plan to create new jobs over the next three months.
-
Sales Expectations and Growth Investments Hit Yearly Highs: Confidence in consumer demand is returning. Owners expecting higher real sales volumes rose 8 points to a net 9%. Spurred by this, 20% of small business owners plan to make major capital investments in the next six months, marking the highest reading of the year.
- Overall health of business evaluations: Excellent 10%, Good 57%, Fair 28%, Poor 5%
The first chart below tracks the NFIB Small Business Optimism Index since 1986, with a baseline level of 100. Notice the sharp declines in sentiment during the Great Financial Crisis and the COVID-19 pandemic. In contrast, the index showed relative resilience during the 2000-2003 Tech Bubble collapse. Following the Great Recession, small-business sentiment remained weak for an extended period, a pattern that closely resembled the past two years of pandemic-related disruptions and high inflation. Another interesting pattern to the index was the nearly identical jumps following the 2016 and 2024 elections.
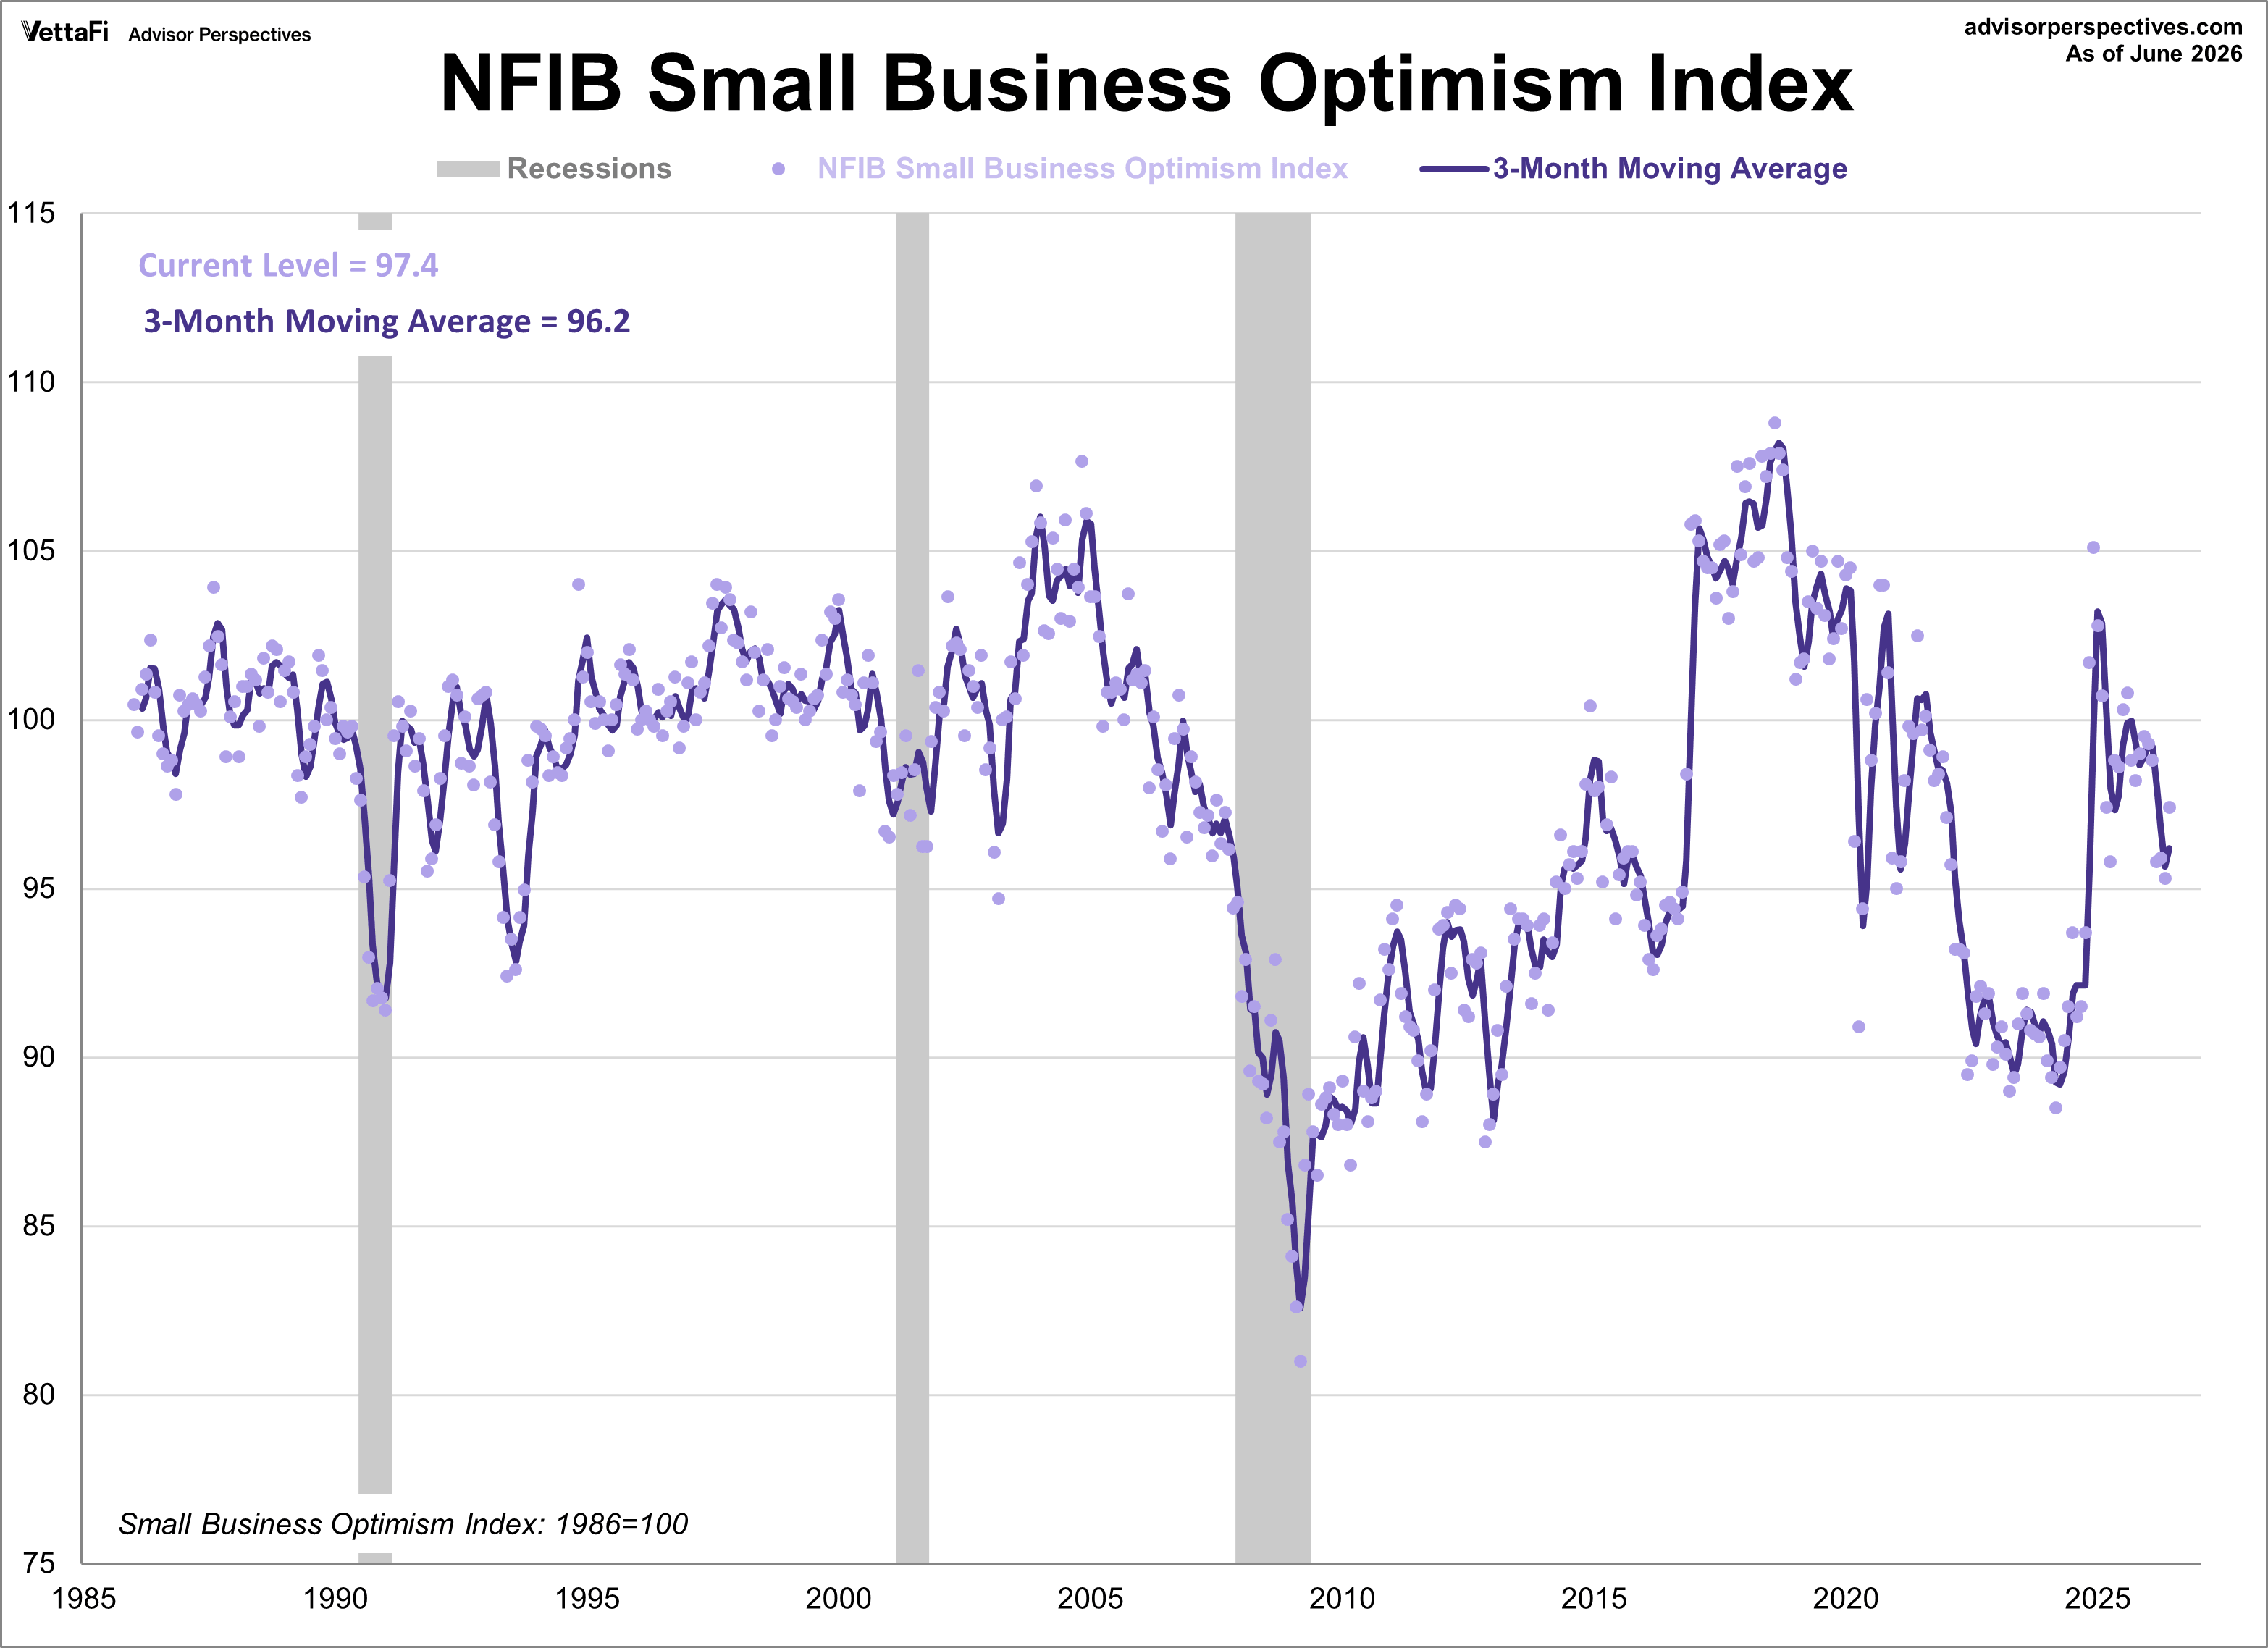
The average monthly change in the NFIB Small Business Optimism Index is 1.4 points. To filter out short-term fluctuations, the chart below presents a 3-month moving average alongside the individual monthly values, represented by dots.
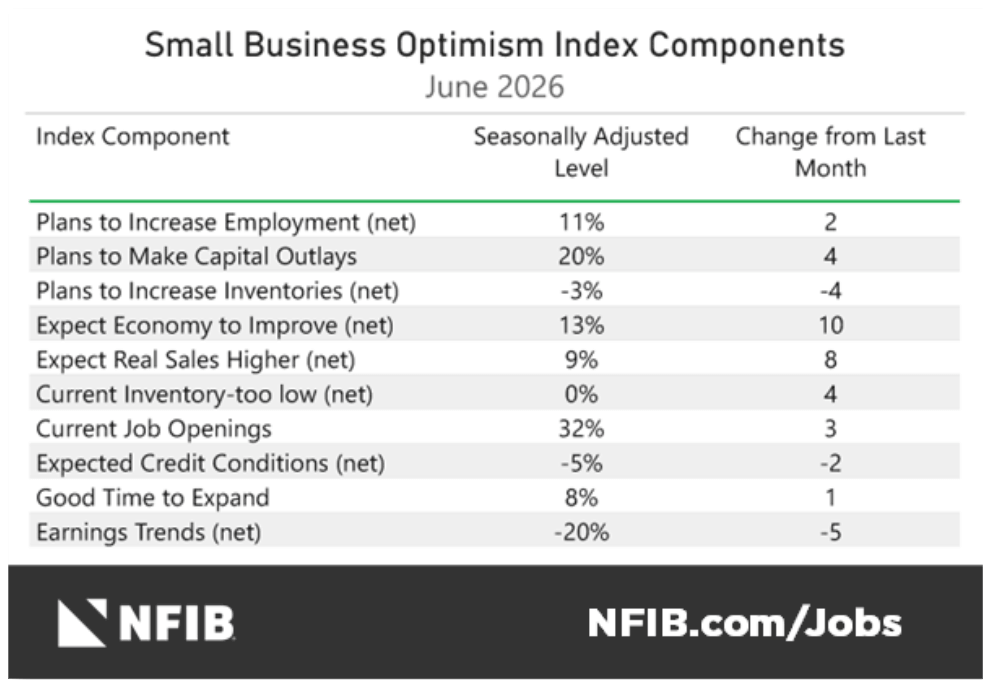
NFIB Small Business Survey Components
The NFIB Small Business Optimism Index is composed of ten components. In June, seven components increased and three declined.
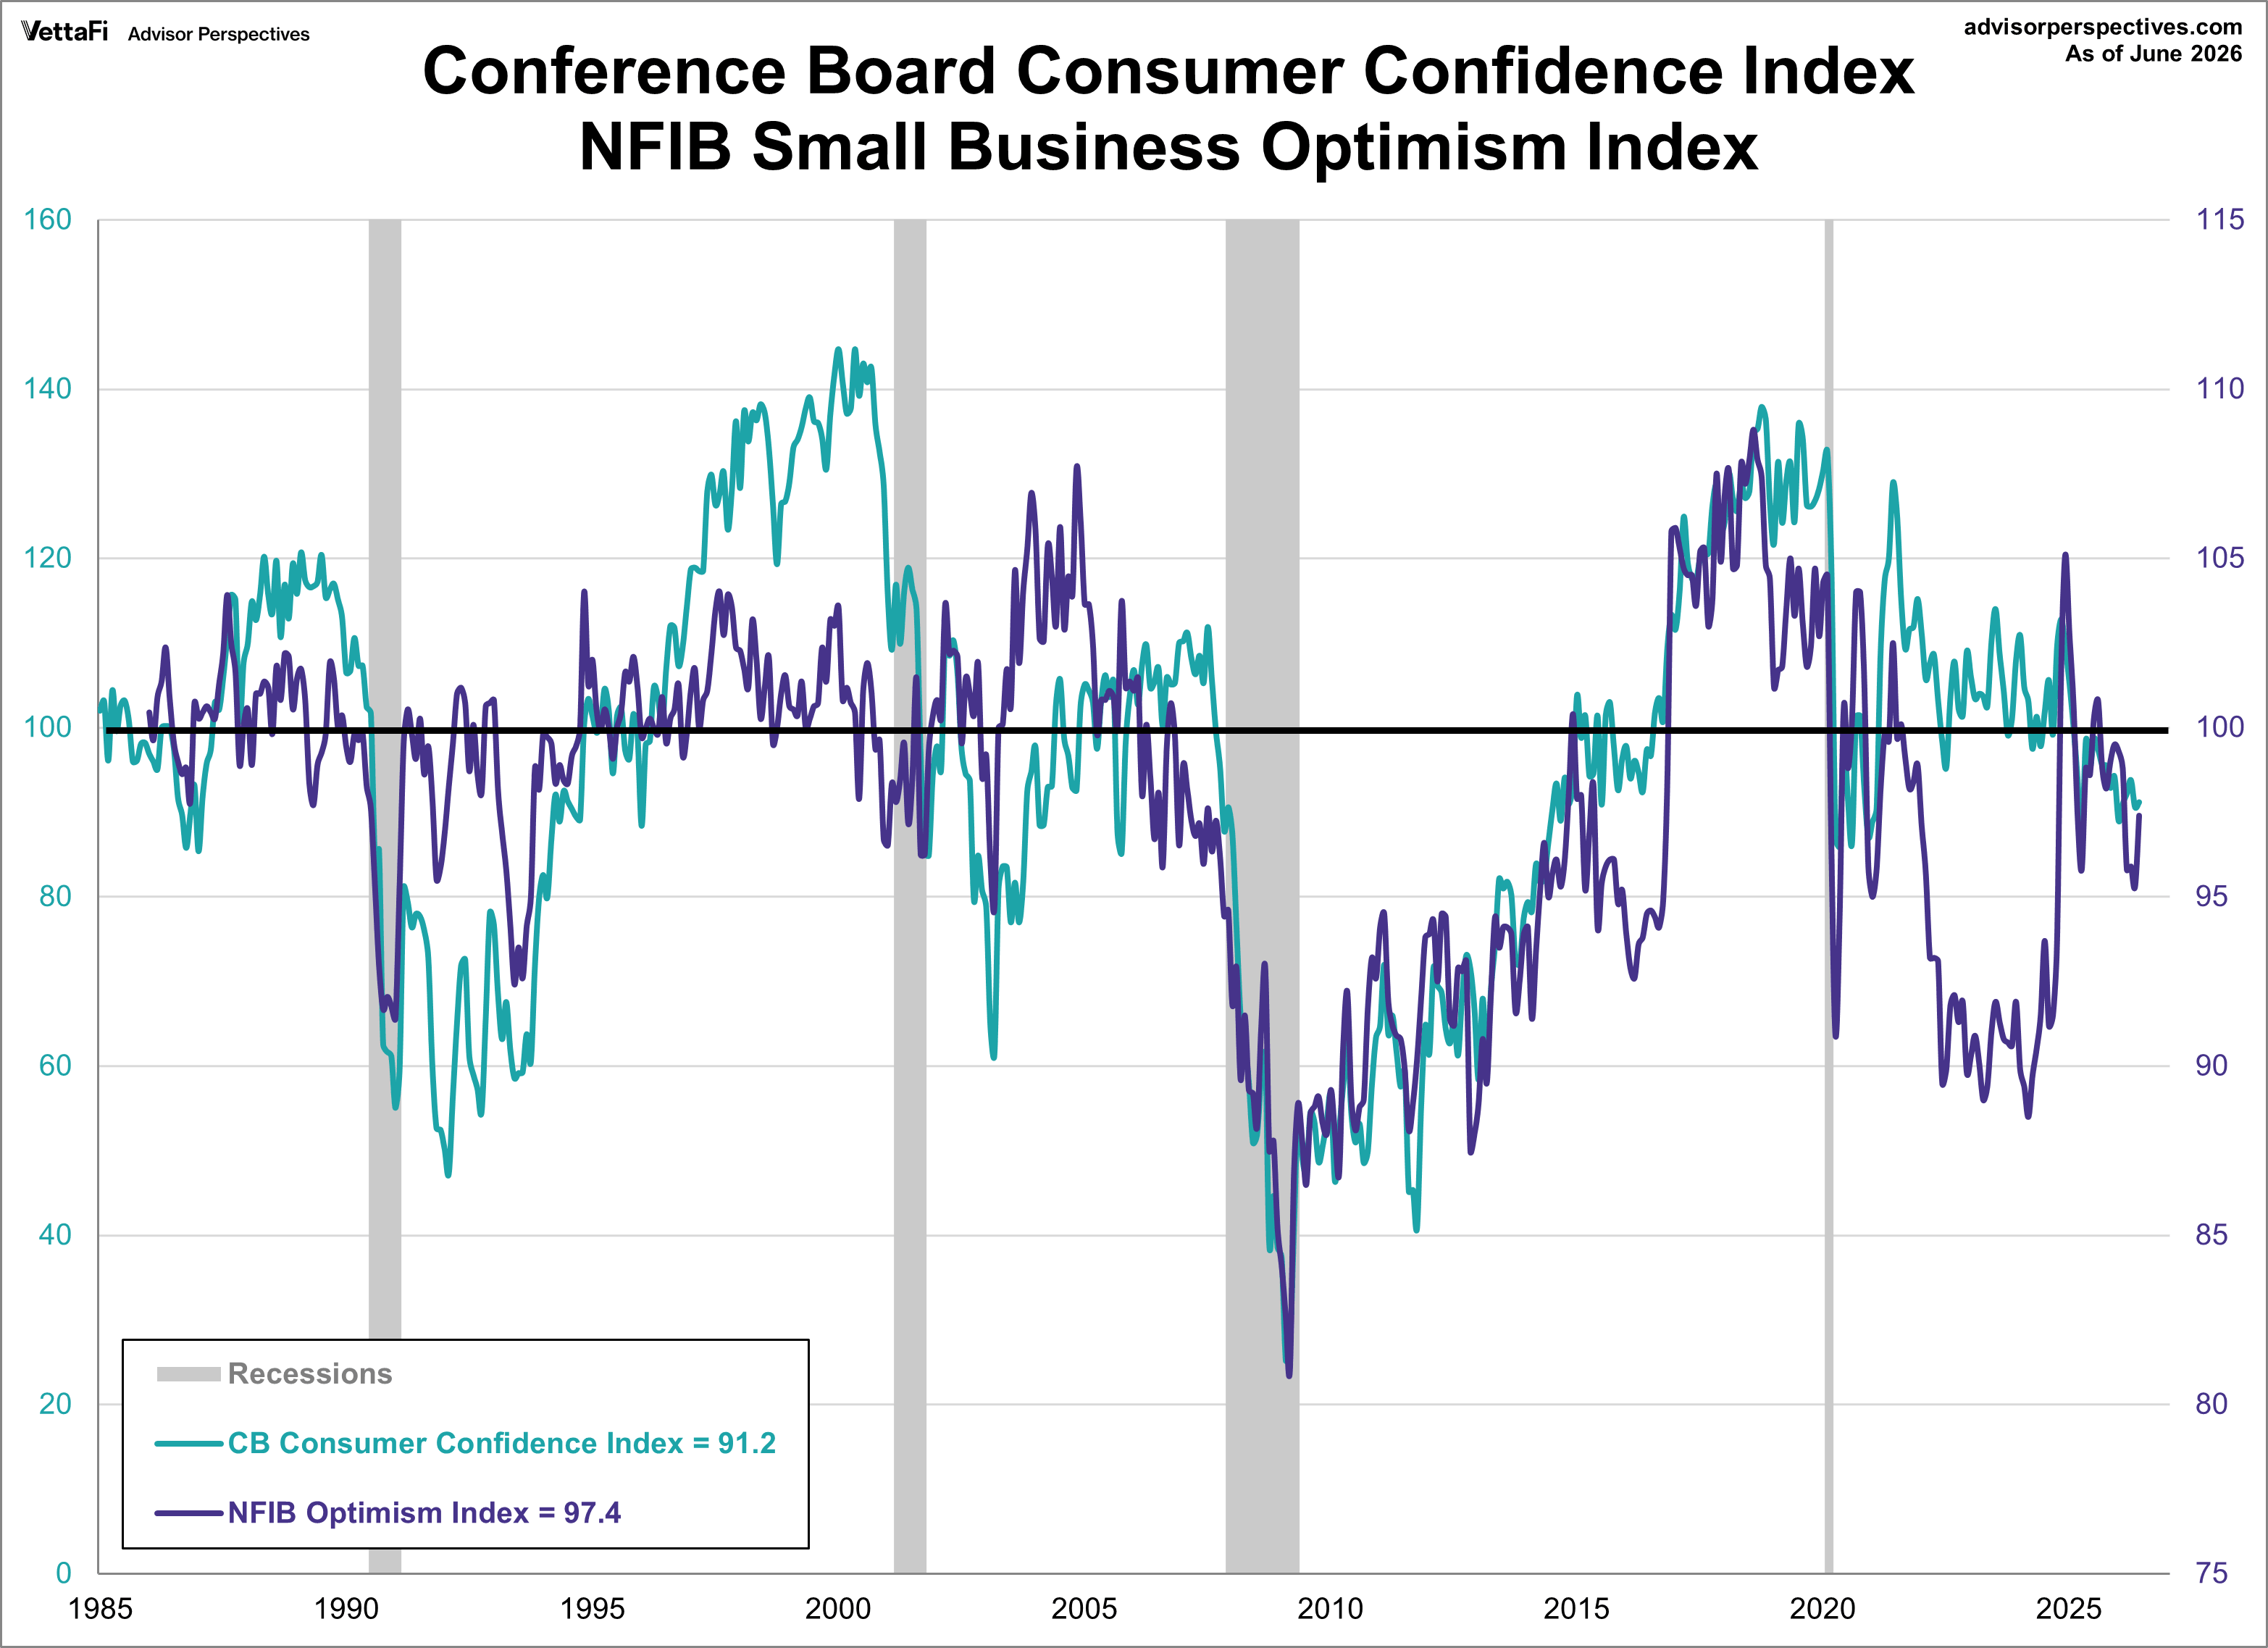
Business Optimism and Consumer Attitudes
The next few charts are overlays of the Business Optimism Index with two of the main measures of consumer attitudes: Conference Board Consumer Confidence and University of Michigan Consumer Sentiment Index. The Consumer Confidence Index is influenced by employment and labor market conditions from the worker's perspective whereas the Michigan Sentiment Index is more focused on employment conditions from the business perspective. (For more information on how these indexes measure up against each other, check out our monthly update Two Measures of Consumer Attitudes: MCSI vs. CCI).
In our first chart comparing the NFIB Small Business Optimism Index with the Conference Board Consumer Confidence Index, we can see that the consumer measure is the more volatile of the two. Therefore, it is plotted on a separate axis to give a better comparison of the two series from the common baseline of 100.
Next, we compare the NFIB Small Business Optimism Index with the University of Michigan Consumer Sentiment Index. Again, we've plotted each index on a separate axis, however in this chart, we can see that the business measure is more volatile of the two.
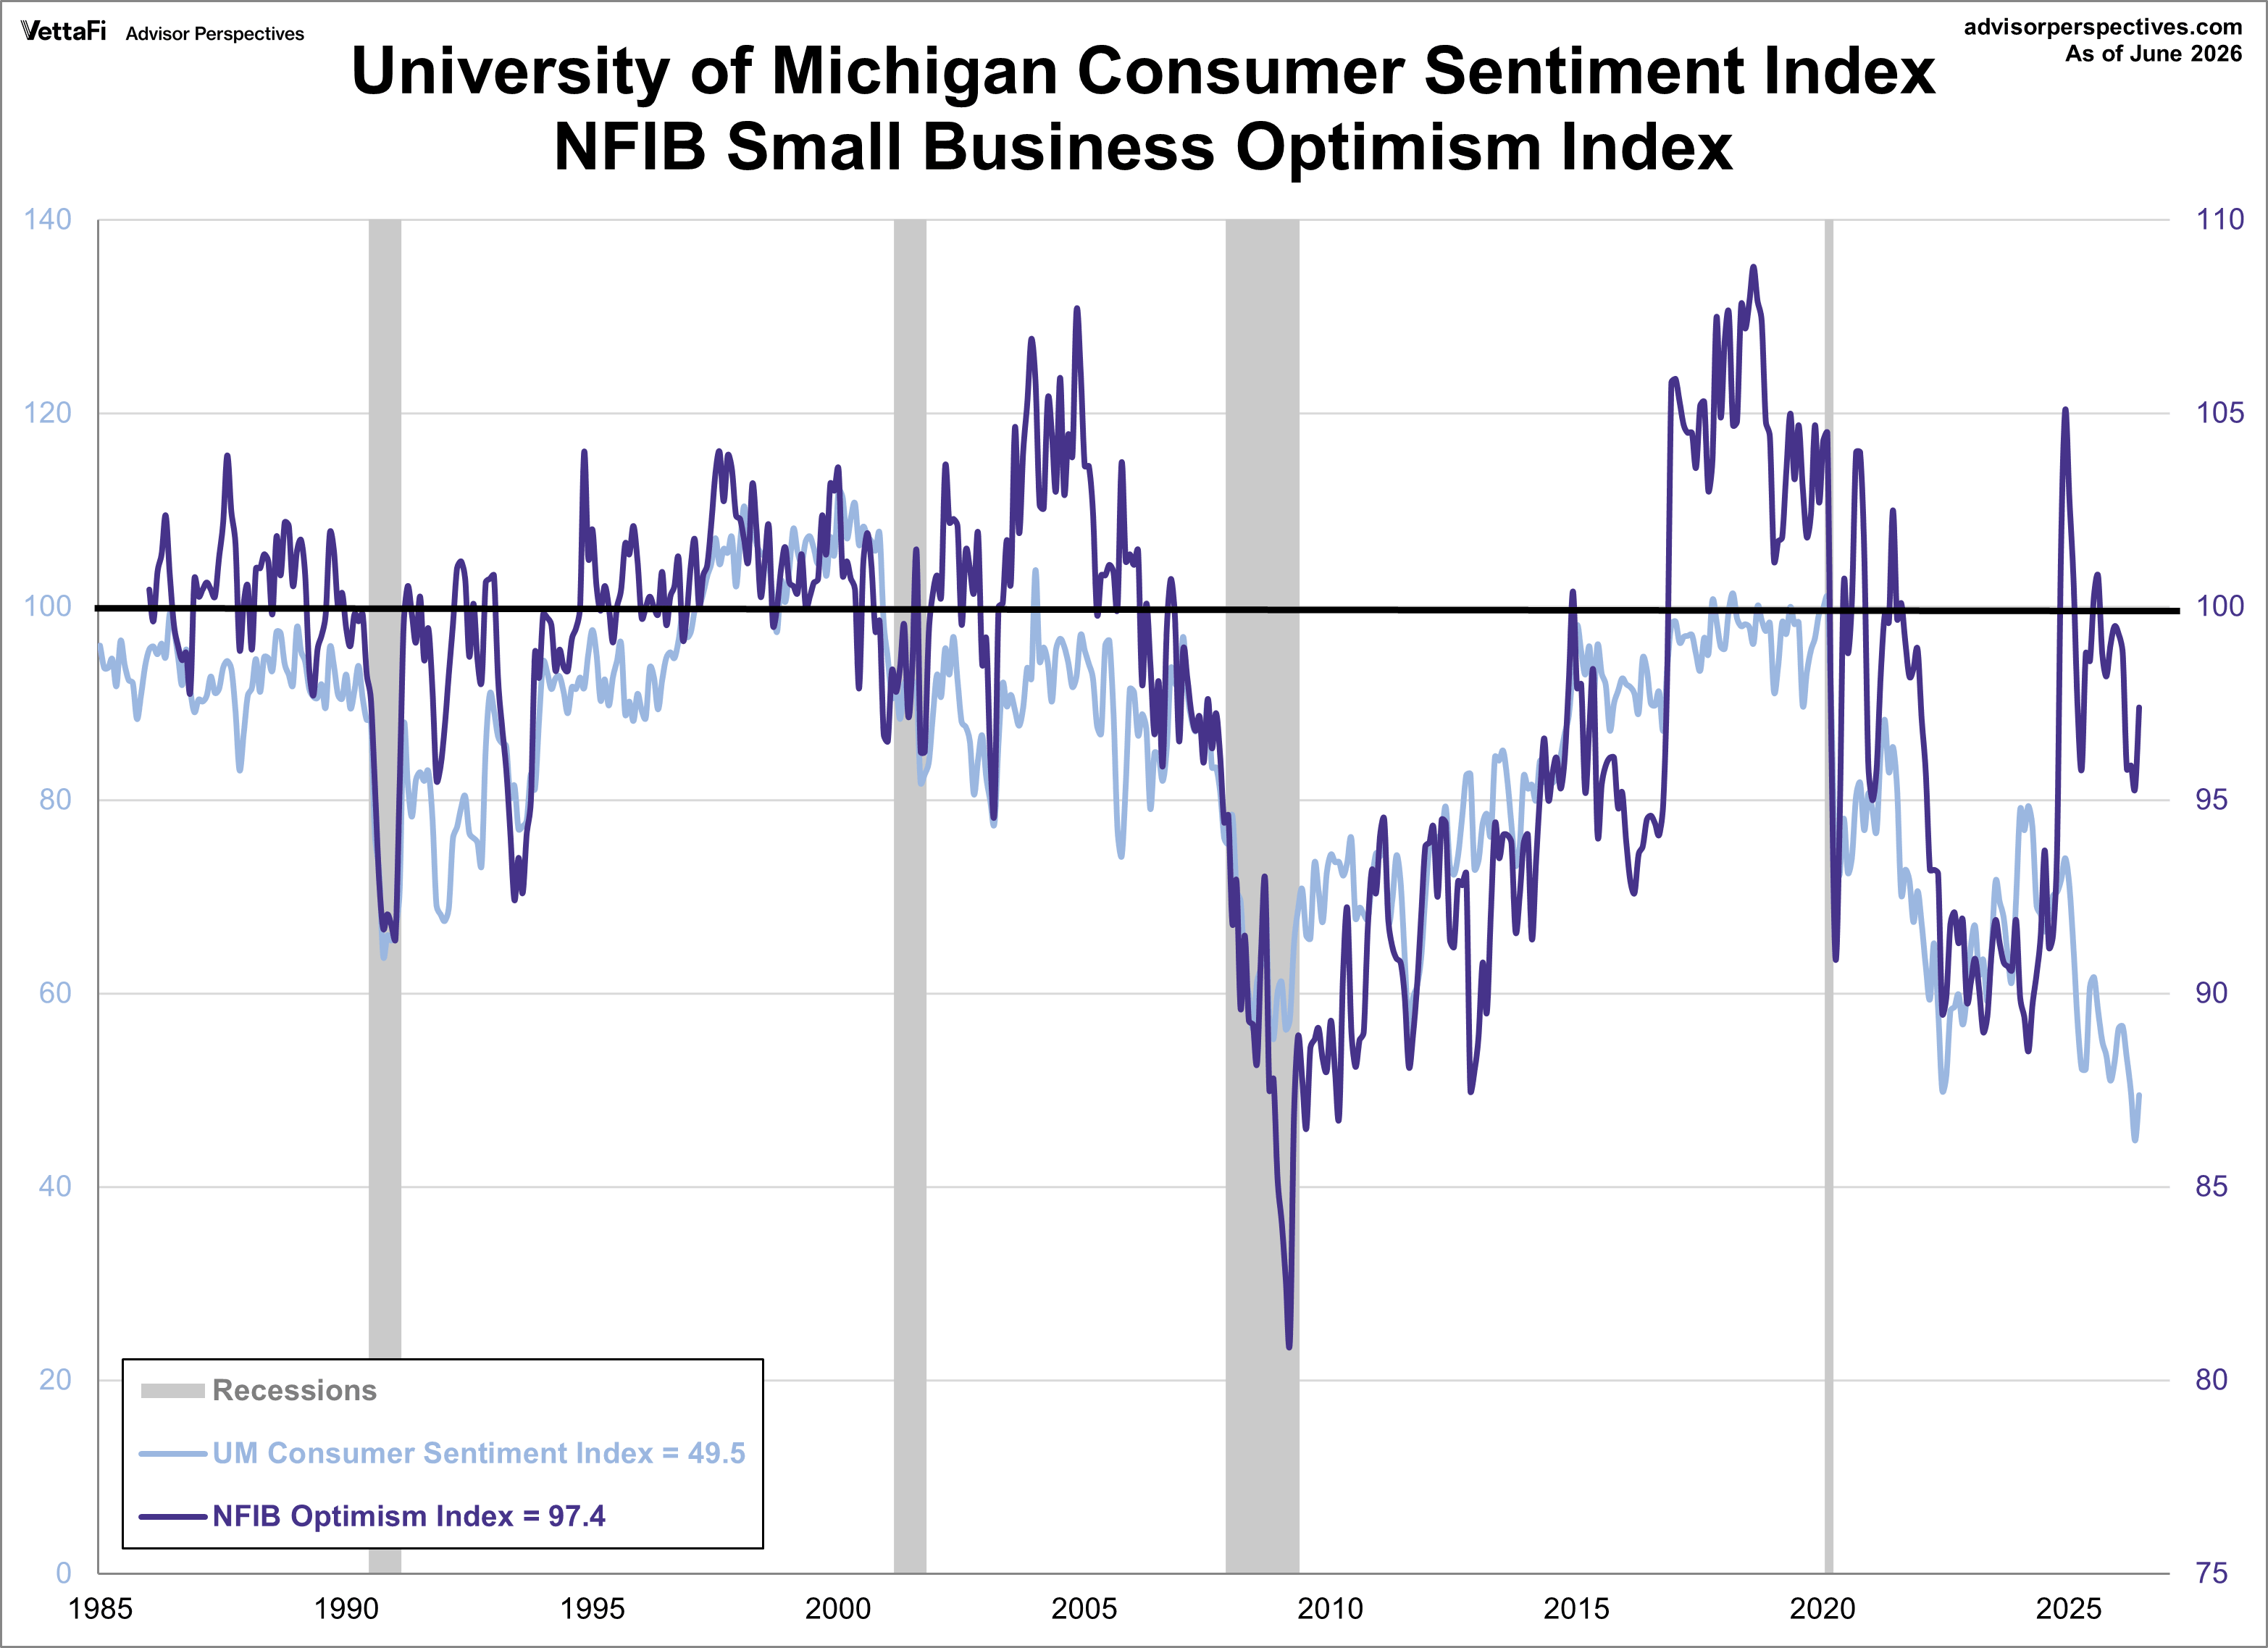
Despite the volatility though, we can see that these two measures of mood (business and consumer) have been highly correlated, falling and rising together for the most part. A decline in Small Business Sentiment was a long leading indicator for the first two recessions of the century, but clearly not for the Covid-19 recession.


