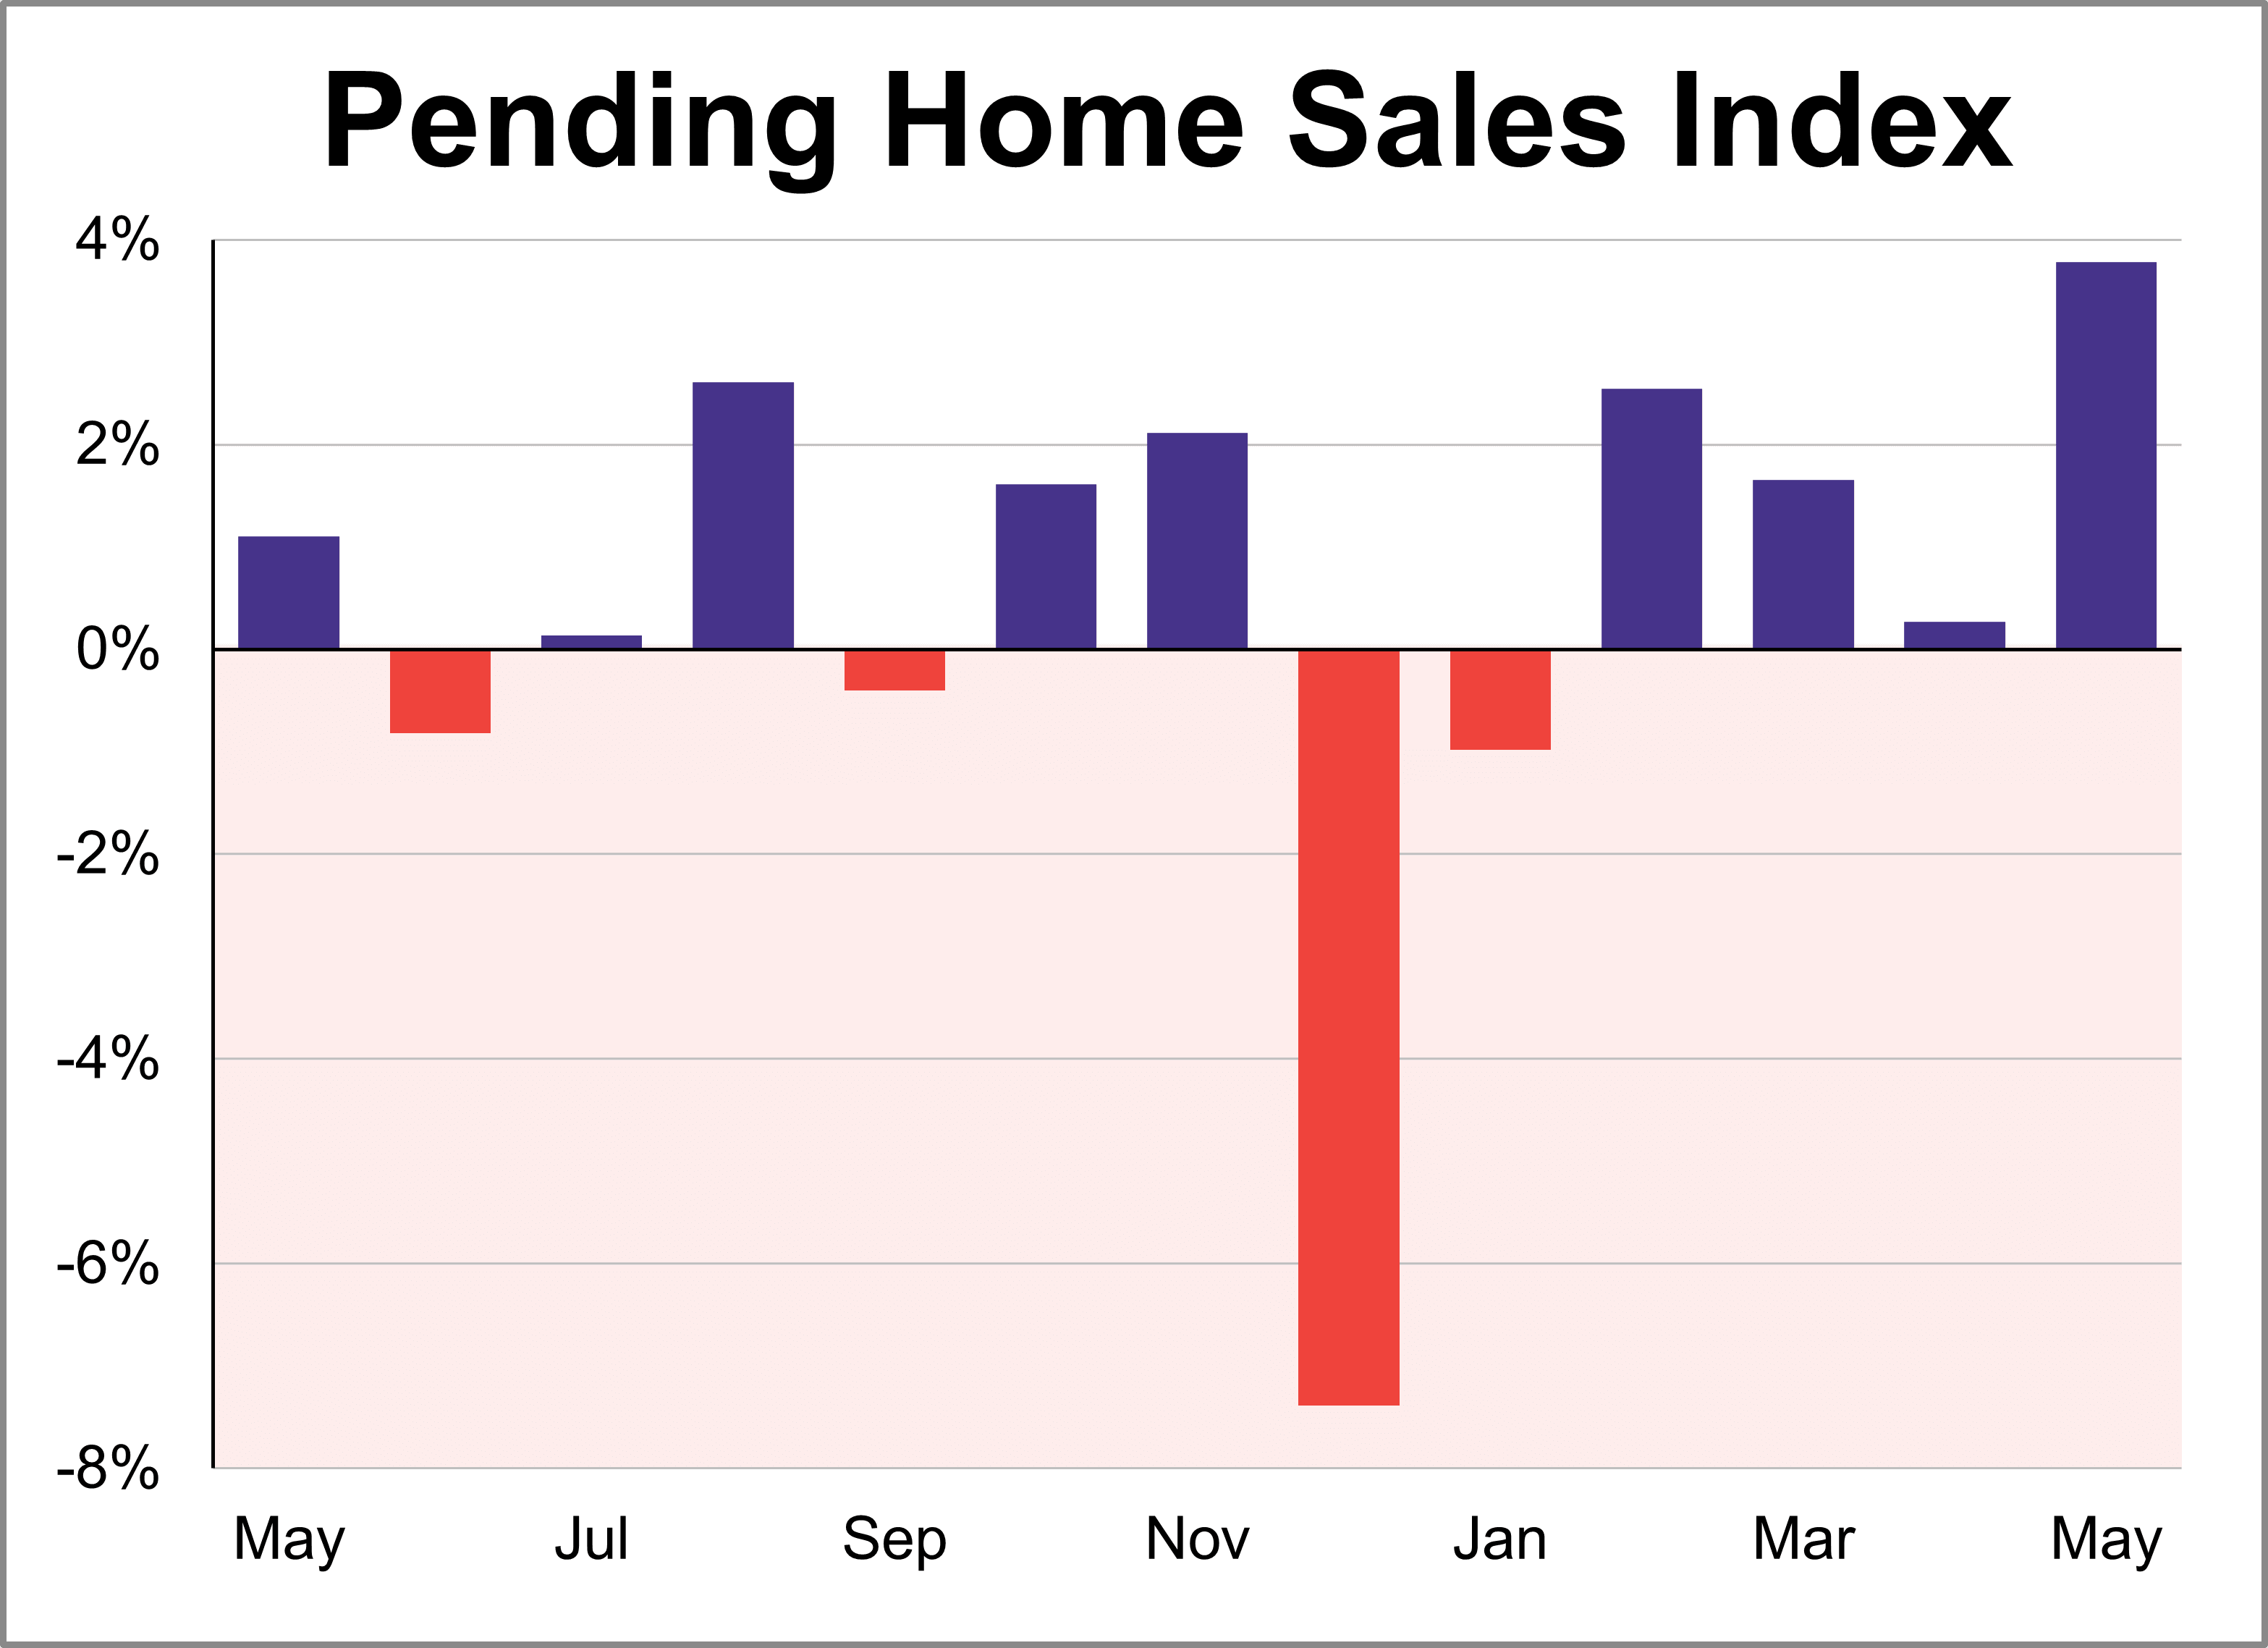
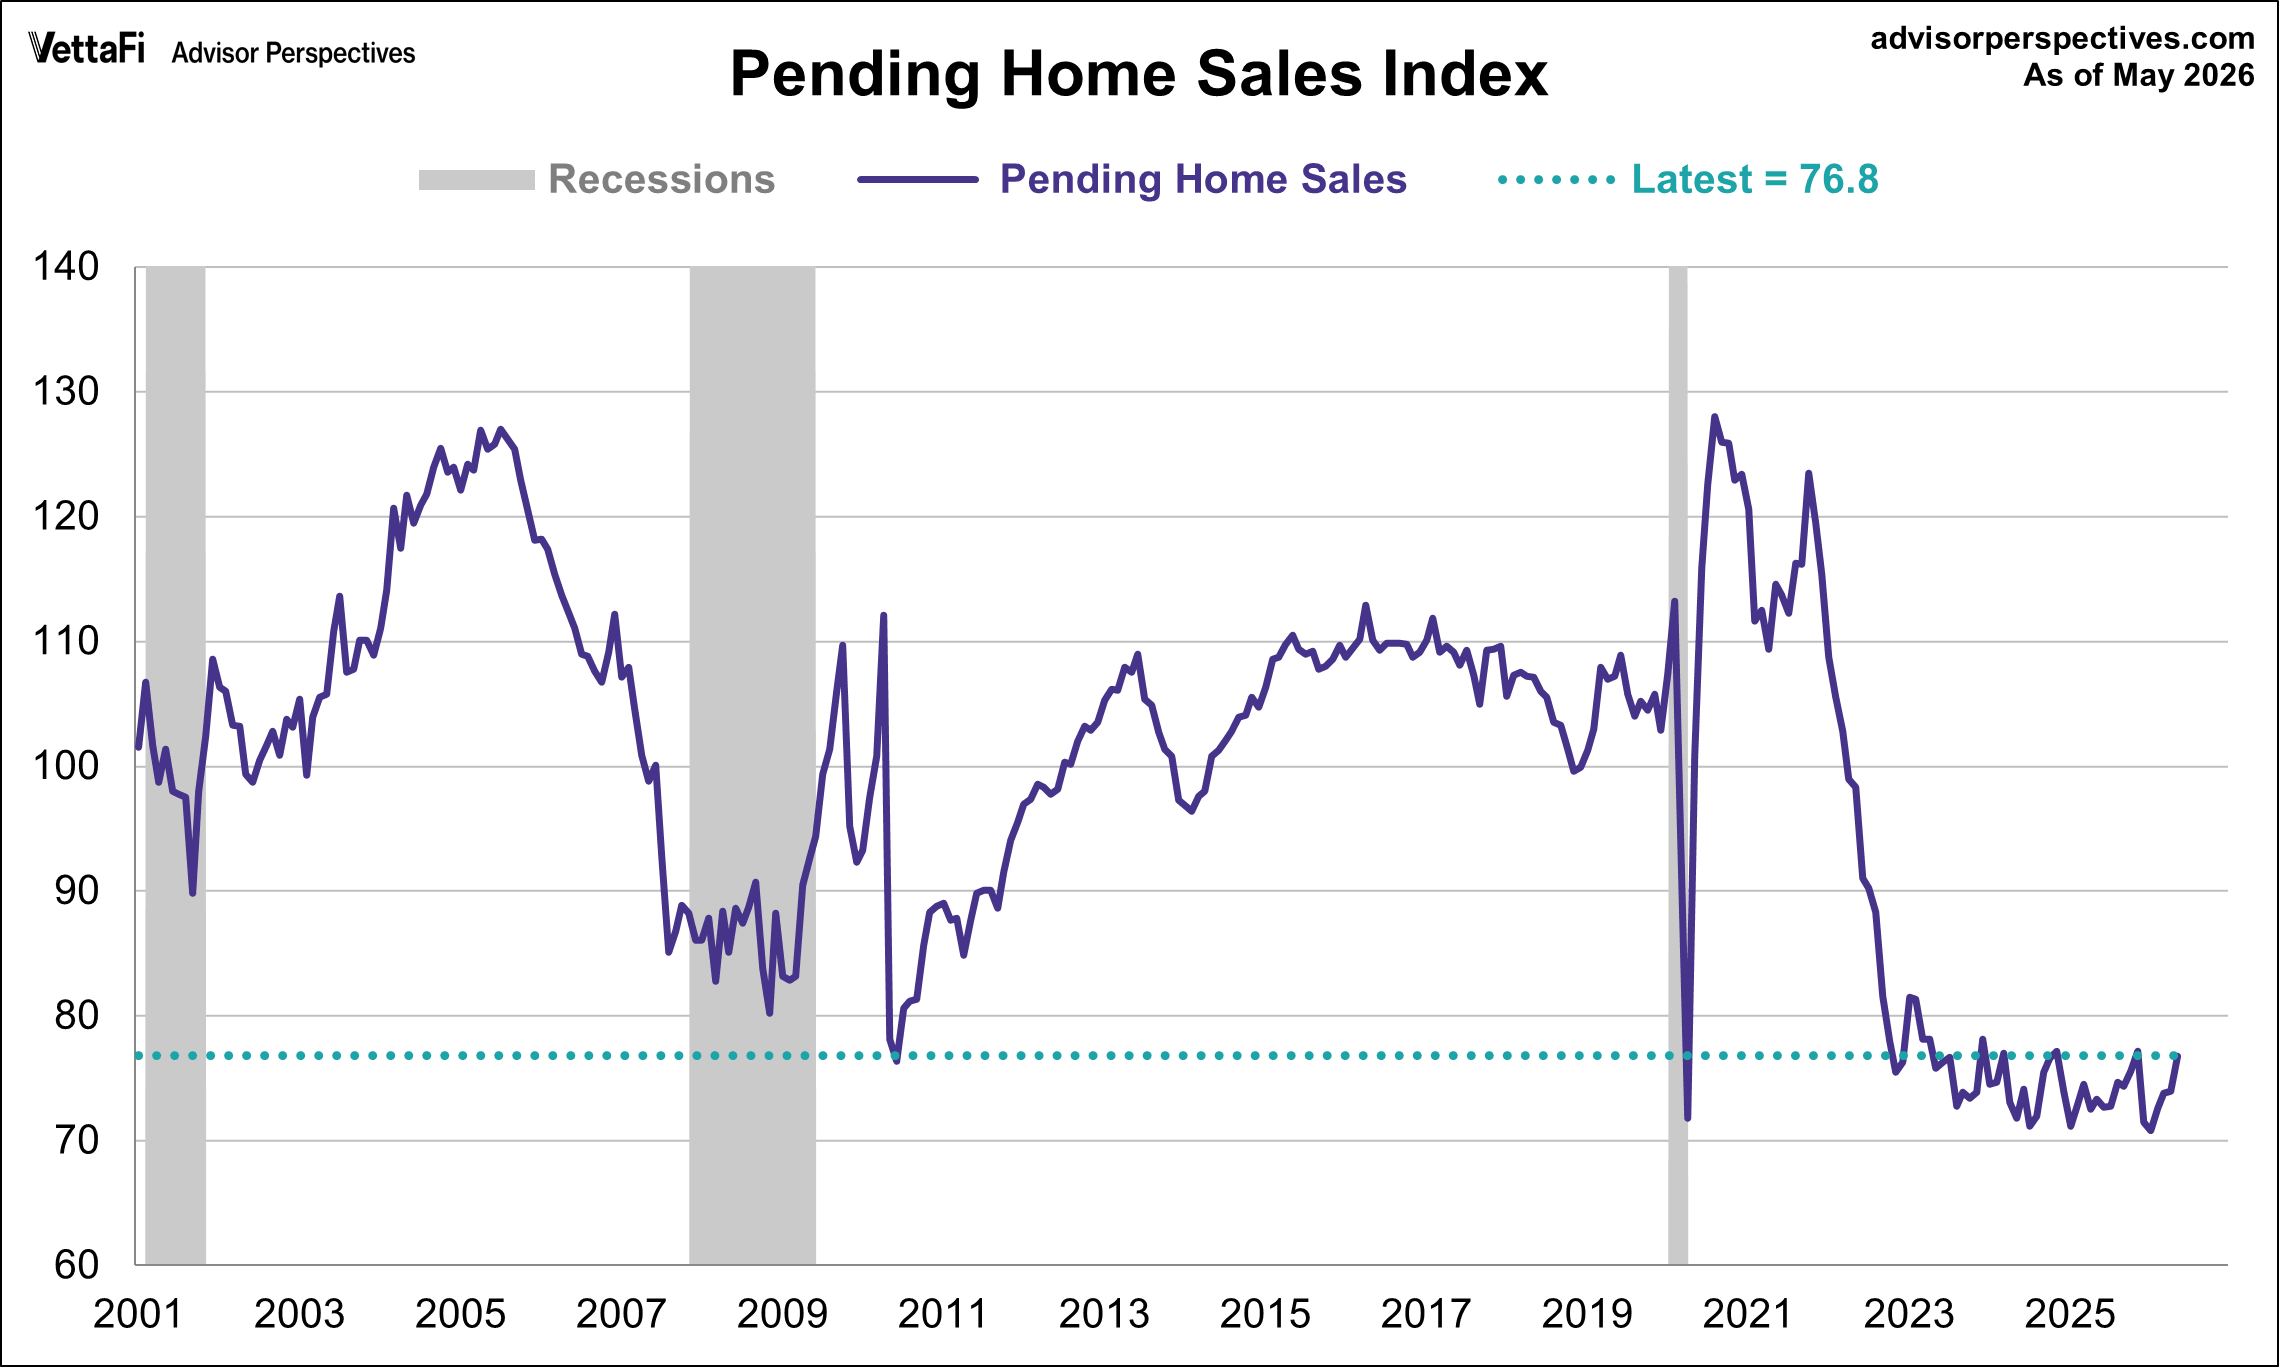
The National Association of Realtors® (NAR) pending home sales index jumped 3.8% in May to 76.8, marking its fourth consecutive monthly gain and highest level in six months. This surge represents the largest monthly increase for the index since September 2024 and was significantly better than the expected 0.8% growth. Compared to one year ago, the index is up 4.8%.
Key Takeaways
- The pending home sales index rose 3.8% in May to 76.8 and are up 4.8% compared to one year ago.
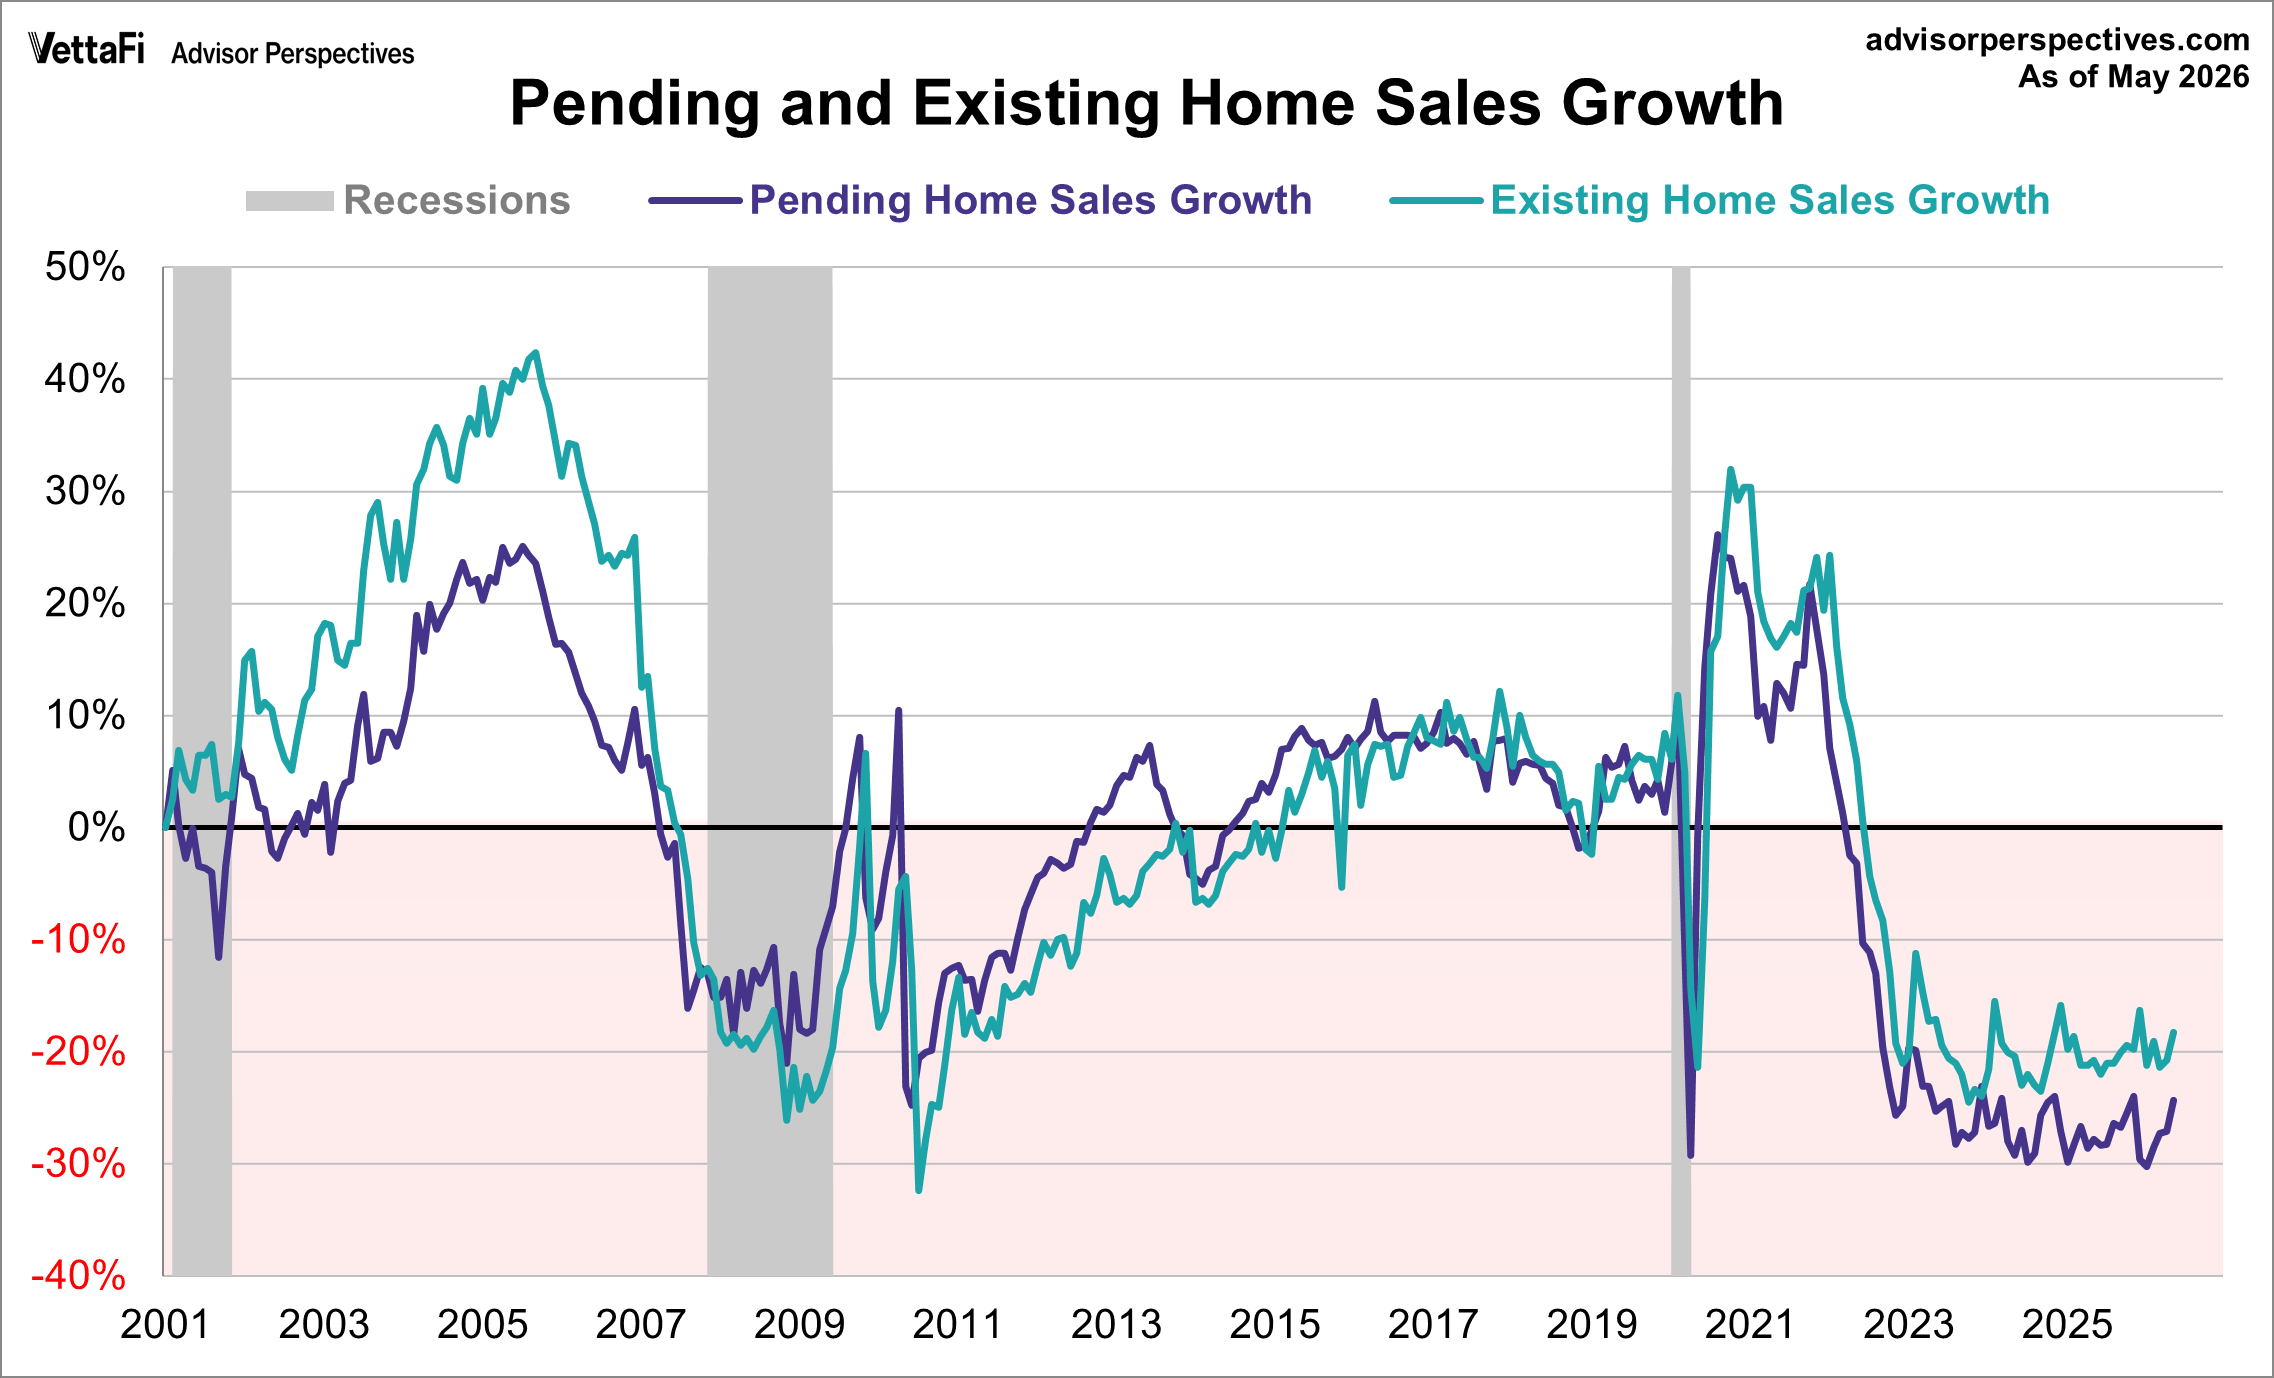
- Since 2001, pending home sales have fallen 26.3%, while existing home sales have fallen 21.2%.
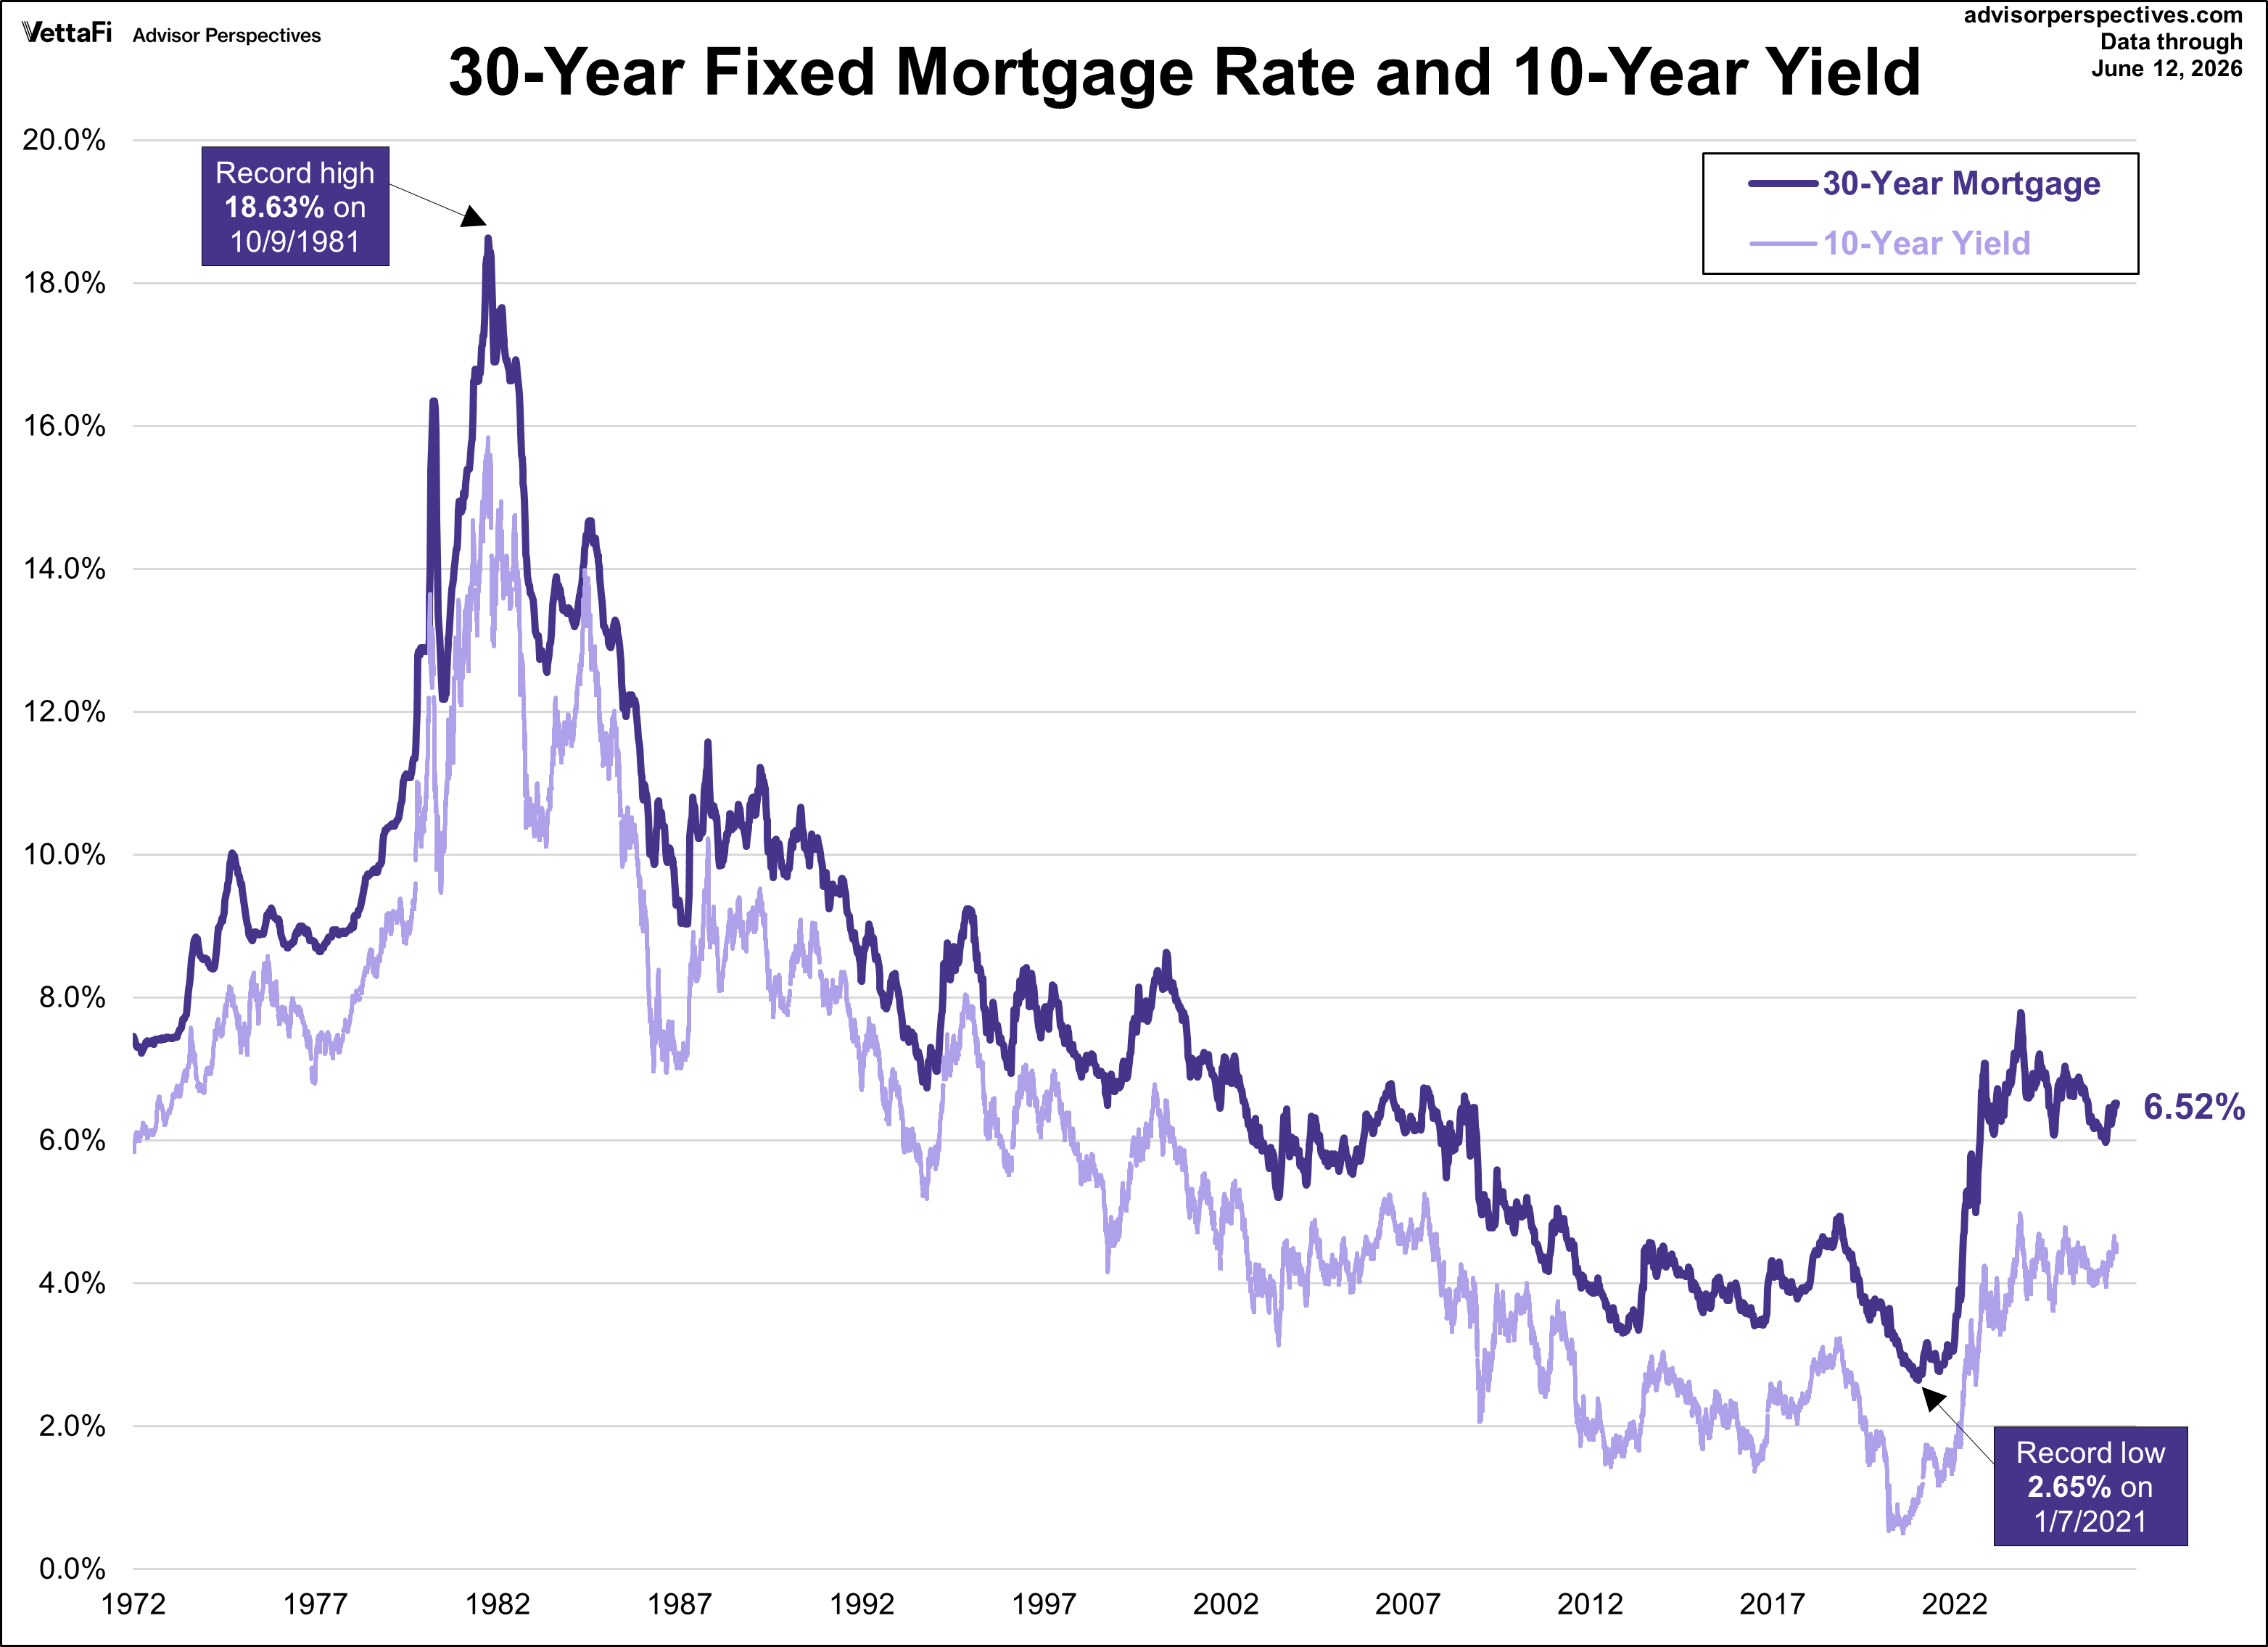
- According to Freddie Mac, the average 30-year fixed-rate mortgage in May 2026 was 6.44%.
“A late spring buyer rush—even with mortgage rates not budging—is an indication of pent-up housing demand and consumers’ acceptance of above-6% mortgage rates as the new normal,” said NAR Chief Economist Dr. Lawrence Yun. “The inventory-constrained Northeast region, which has seen faster home price growth but slower home sales for several months, is now showing more buyer contract signings. More supply is needed to help moderate home price growth.”
“Going forward, falling oil prices will help lower mortgage rates,” Yun said. “But declines will be modest given sizable borrowing by the federal government and strong AI investment spending by tech companies.”
Pending Home Sales Background
The pending home sales index (PHSI) was created by the National Association of Realtors® to track home sales where the contract is signed but the transaction has not yet closed. An index of 100 is equal to the level of contract activity in 2001. The PHSI is a leading economic indicator of future existing home sales.
The chart below gives us a snapshot of the index since 2001, the first year data was analyzed.
Over this time frame, the US population has grown by 20.7%. For a better look at the underlying trend, here is an overlay with the nominal index and the population-adjusted variant to show the growth in sales over the past 25 years.
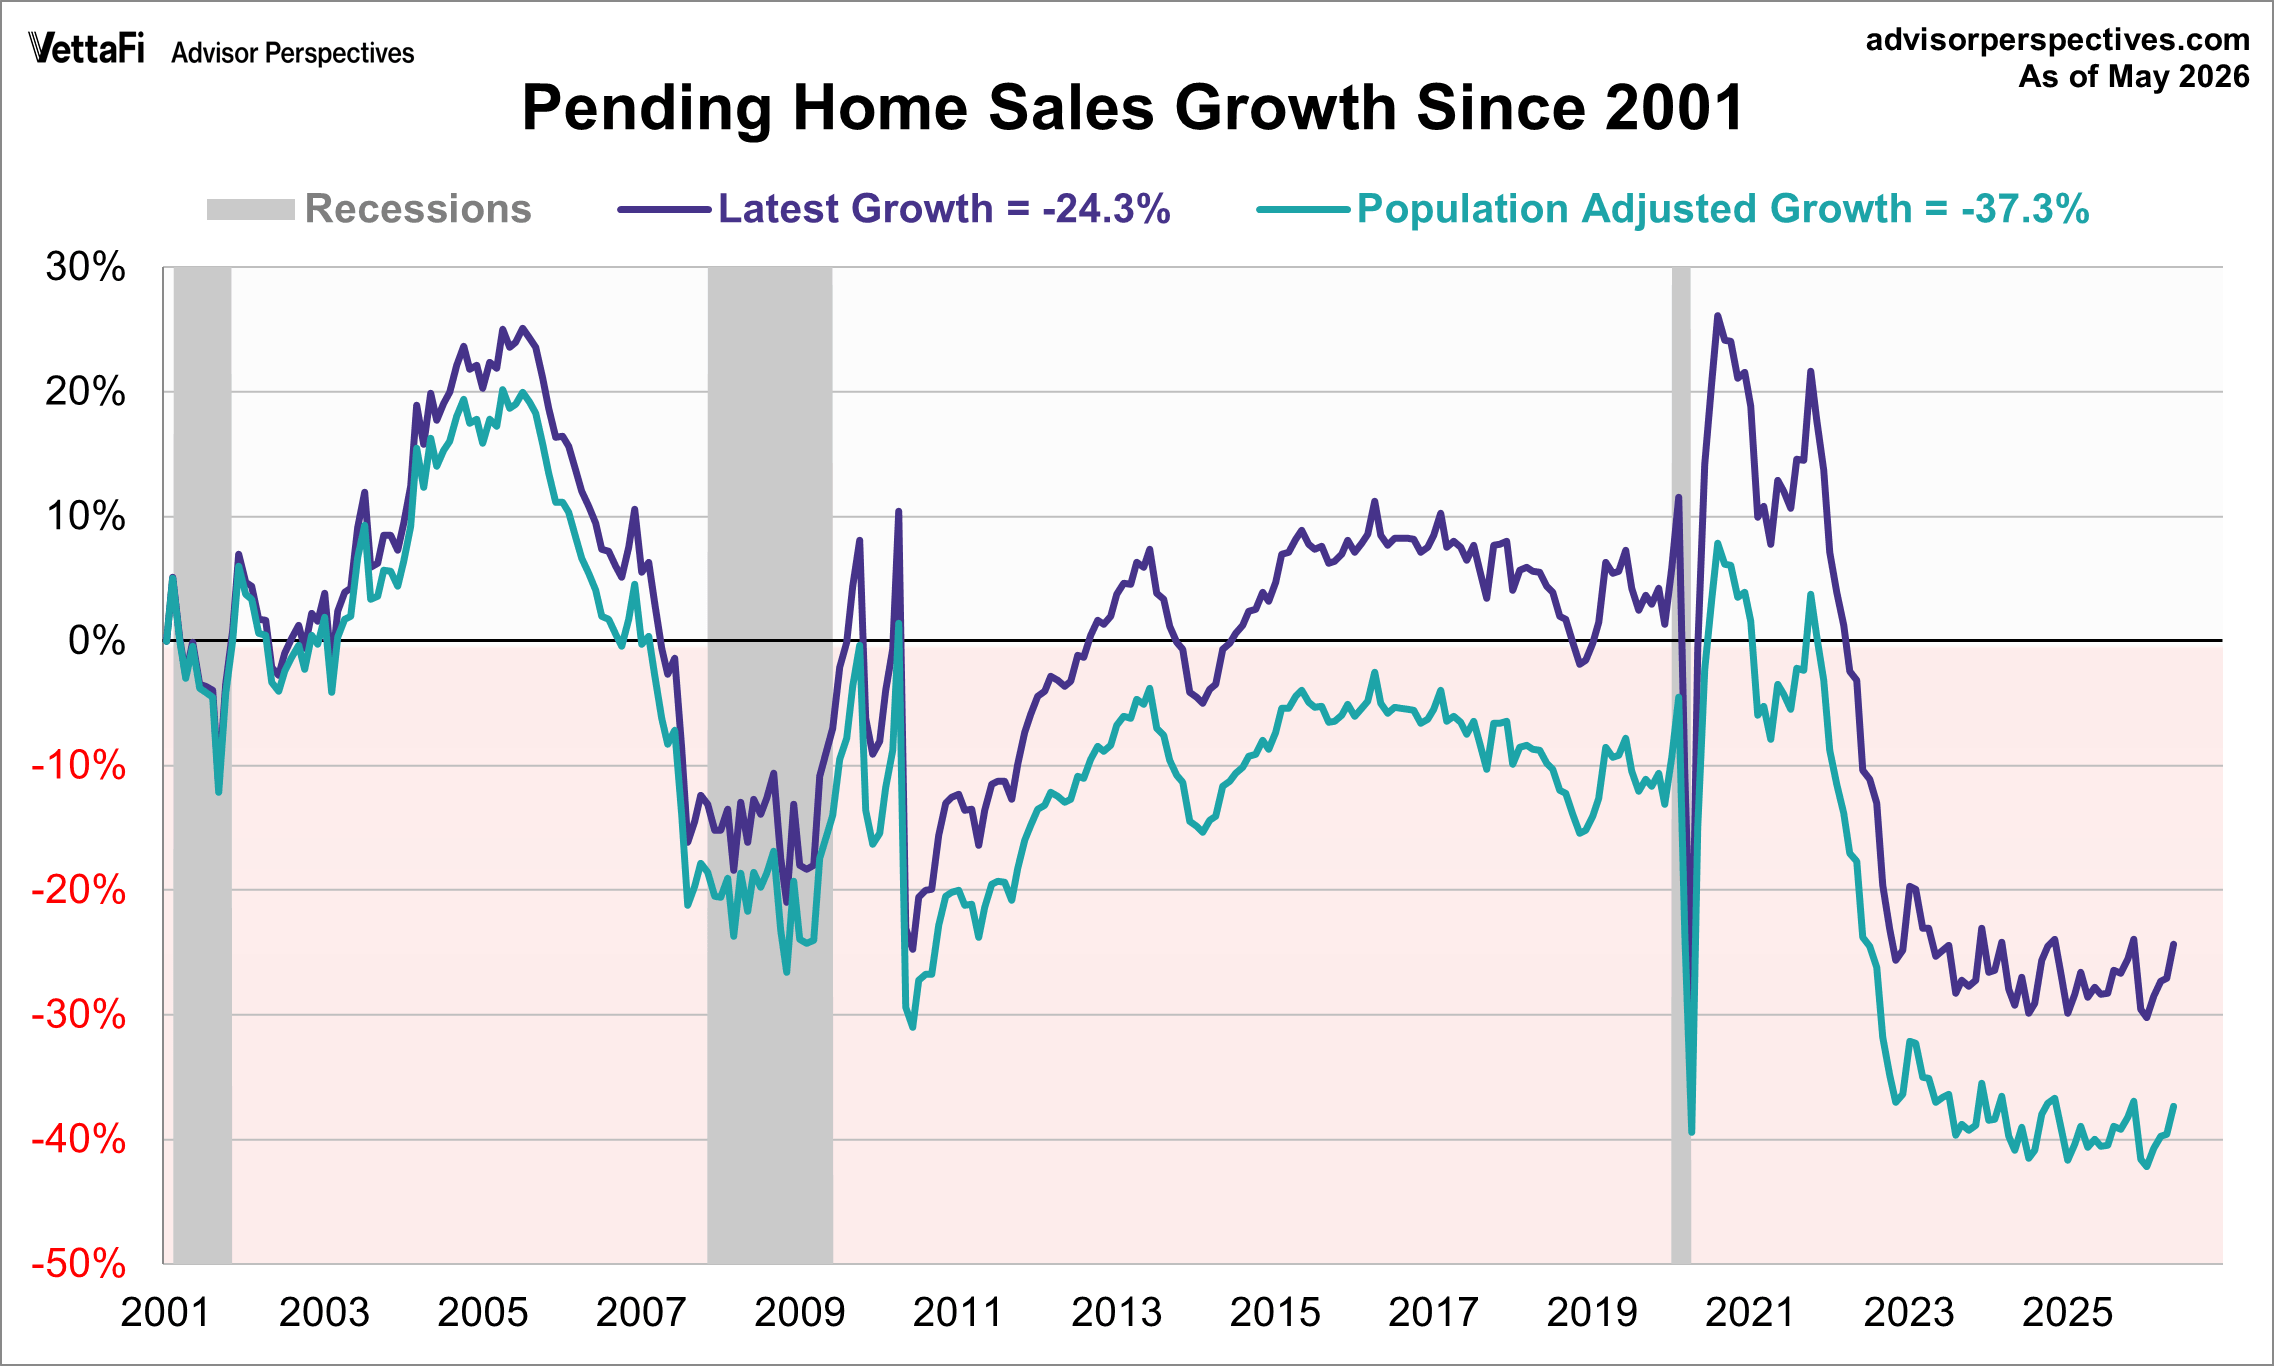
The above chart shows the percent change relative to turn-of-the-century baseline values. The index for the most recent month is currently 40% below its all-time high from August 2020, while the population-adjusted index is 48% off its high from April 2005.