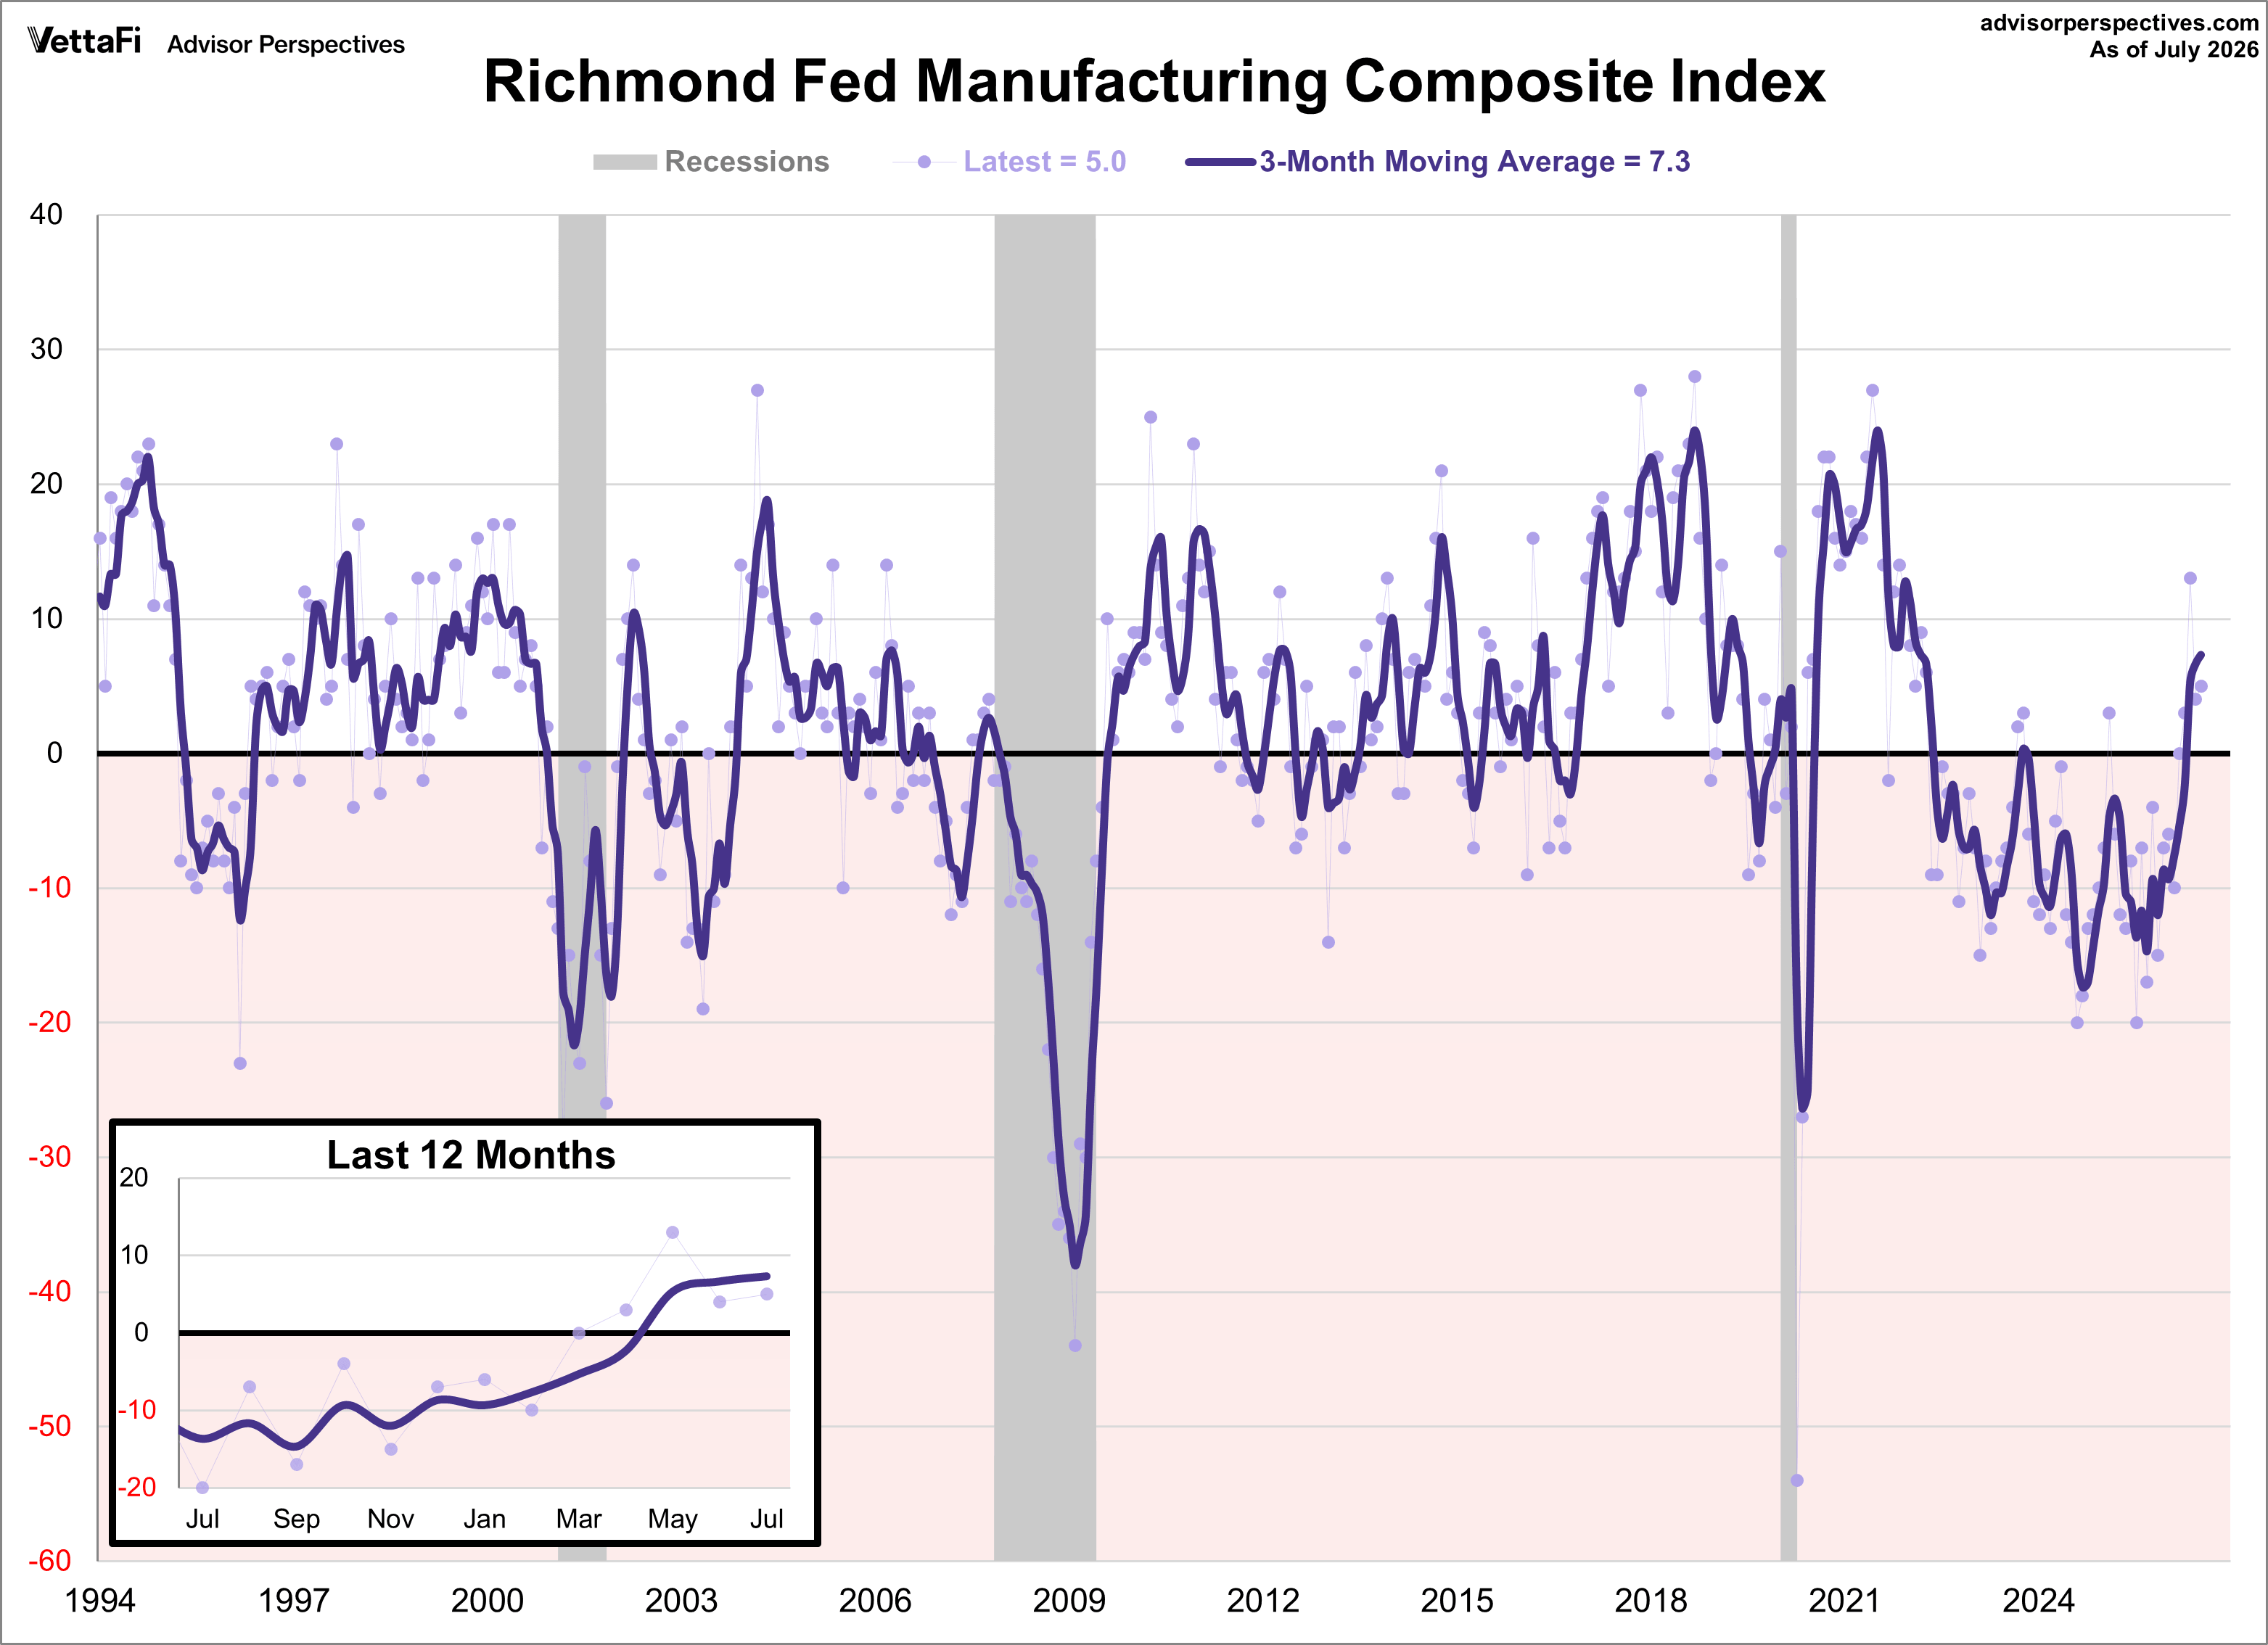
Fifth district manufacturing activity was mostly flat in July, according to the most recent survey from the Federal Reserve Bank of Richmond. The composite manufacturing index inched up one point to 5, marking the fourth consecutive positive reading. This month's reading was below the forecast of 7.
Here is an excerpt from the latest Richmond Fed manufacturing report:
Fifth District manufacturing activity was mostly flat in July, according to the most recent survey from the Federal Reserve Bank of Richmond. The composite manufacturing index was nearly unchanged in July, increasing from 4 to 5. Two of its three component indexes increased somewhat in July: shipments to 8 from 4 and employment to 2 from −1. Meanwhile, the new orders index edged down to 5 from 8.
The future indexes for shipments and new orders remained firmly in positive territory. The expectations index for employment was unchanged at 15 in July.
The local business conditions index increased notably to 10 in July from −1 in June. Meanwhile, the future local business conditions index fell to 19 from 22.
The average growth rate of prices paid fell to 6.08 percent in July from 6.99 in June. Growth in prices received also decreased, from 4.57 in June to 3.96 in July. Firms expected growth in both prices paid and prices received to decline somewhat over the next 12 months.
Background on Richmond Fed Manufacturing
The Richmond Manufacturing Index is a gauge of manufacturing activity in the Fifth Federal Reserve District (Maryland, North Carolina, the District of Columbia, Virginia, most of West Virginia, and South Carolina) compiled from a survey of ~100 manufacturers. The composite manufacturing index is an average of indexes on shipments, new orders, order backlogs, capacity utilization, supplier lead times, number of employees, average work weak, wages, inventories, and capital expenditures. This is a diffusion index, meaning negative readings indicate contraction and worsening conditions, while positive ones indicate expansion and improving conditions. The survey offers clues on inflationary pressures and the pace of growth in the manufacturing sector for this region of the country and the accumulated results can help trace long-term trends.
Here is a snapshot of the complete Richmond Fed Manufacturing Composite series.
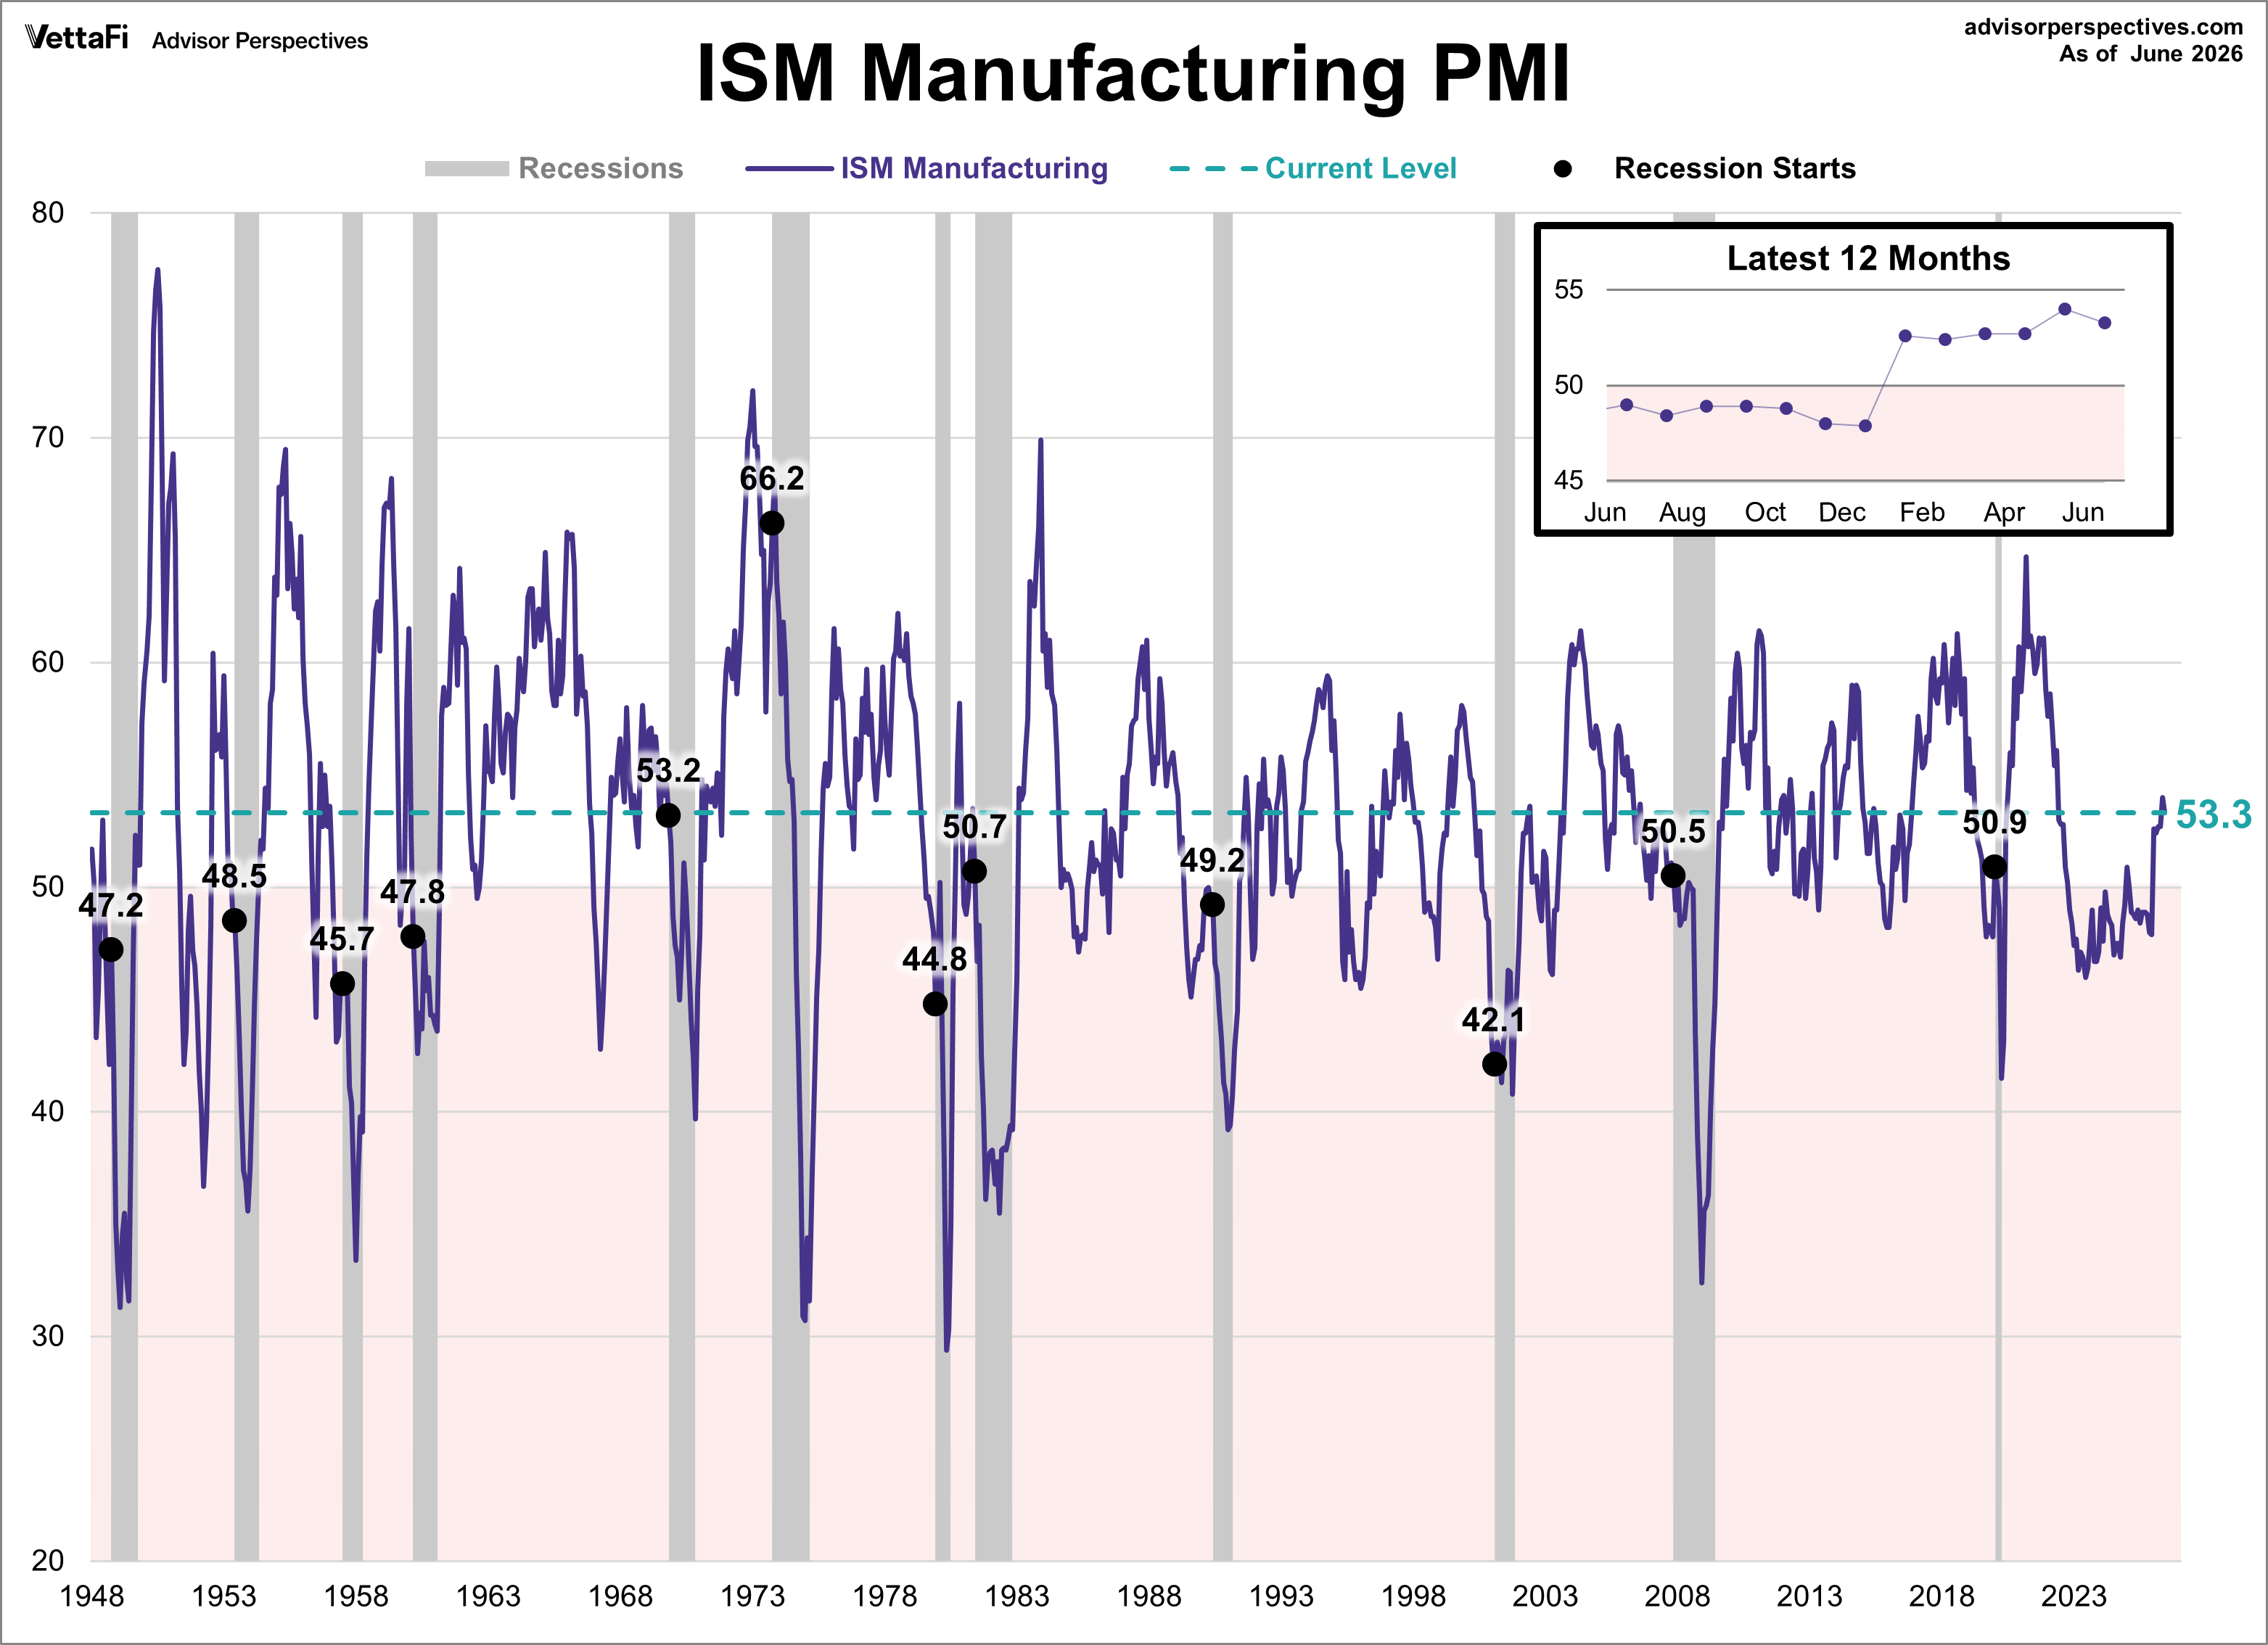
For comparison, here is the latest ISM Manufacturing survey.
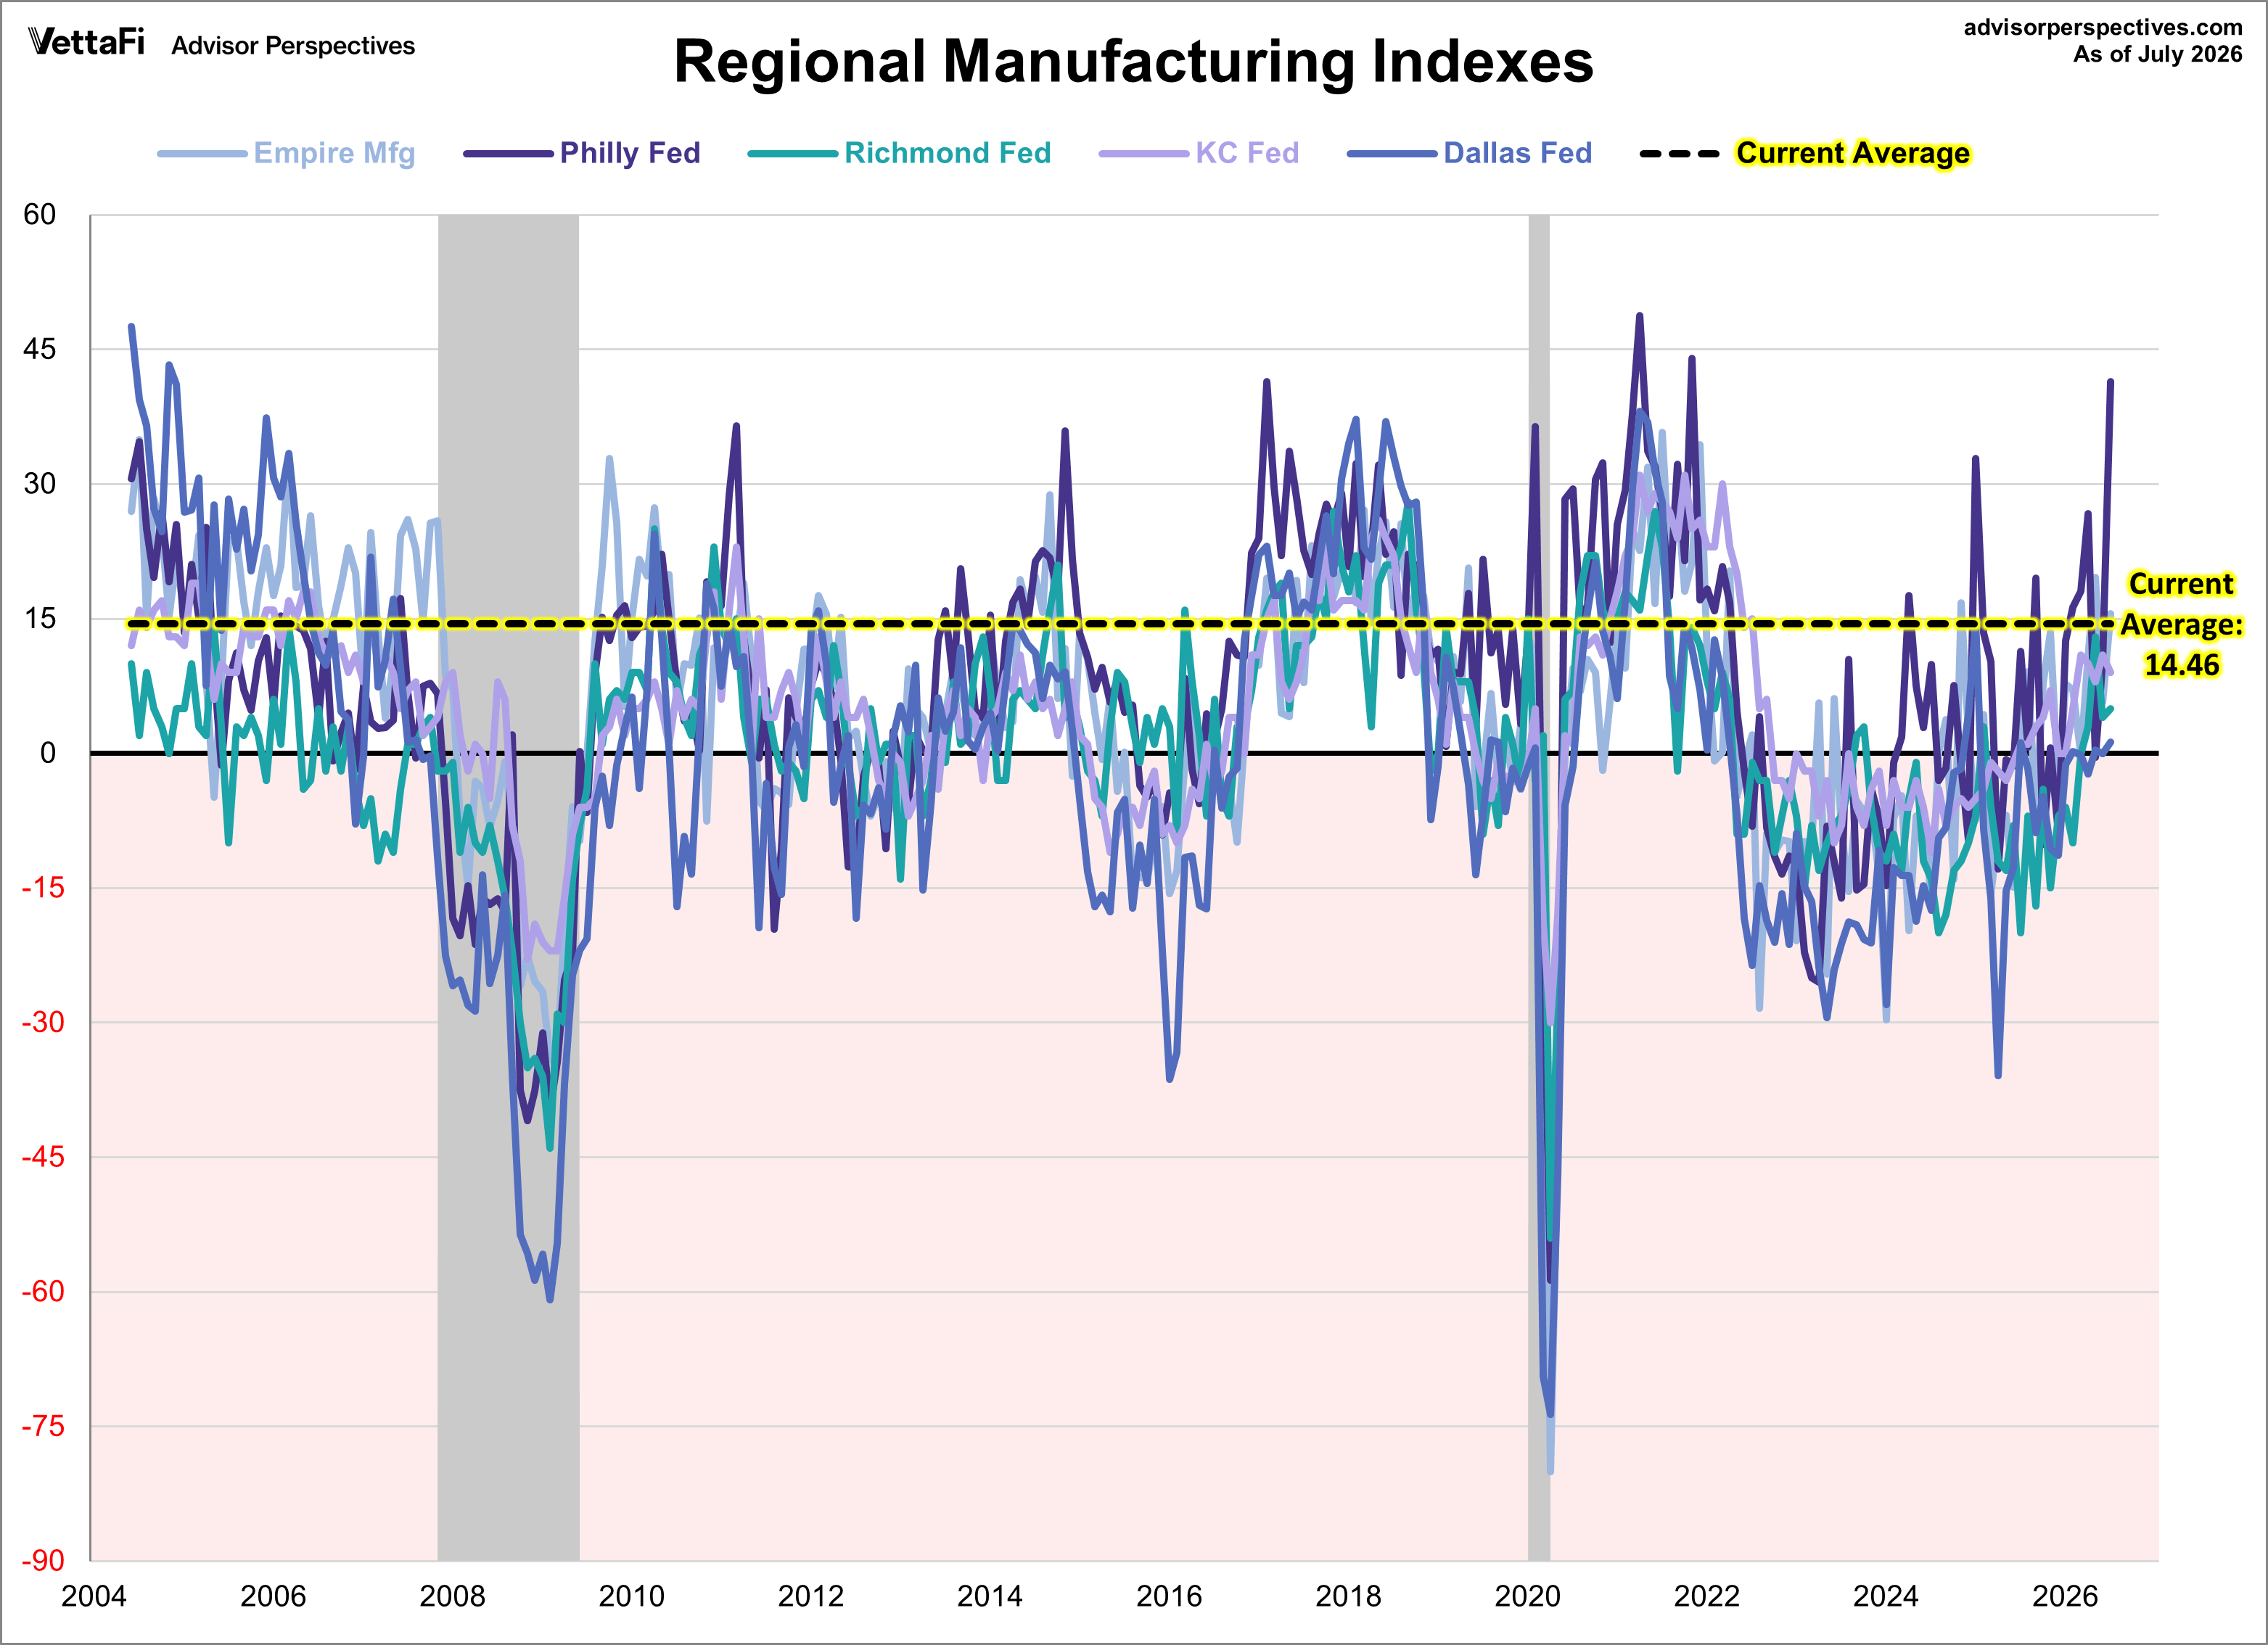
Let's compare all five regional manufacturing indicators. Here is a three-month moving average overlay of each since 2004 (for those with data).
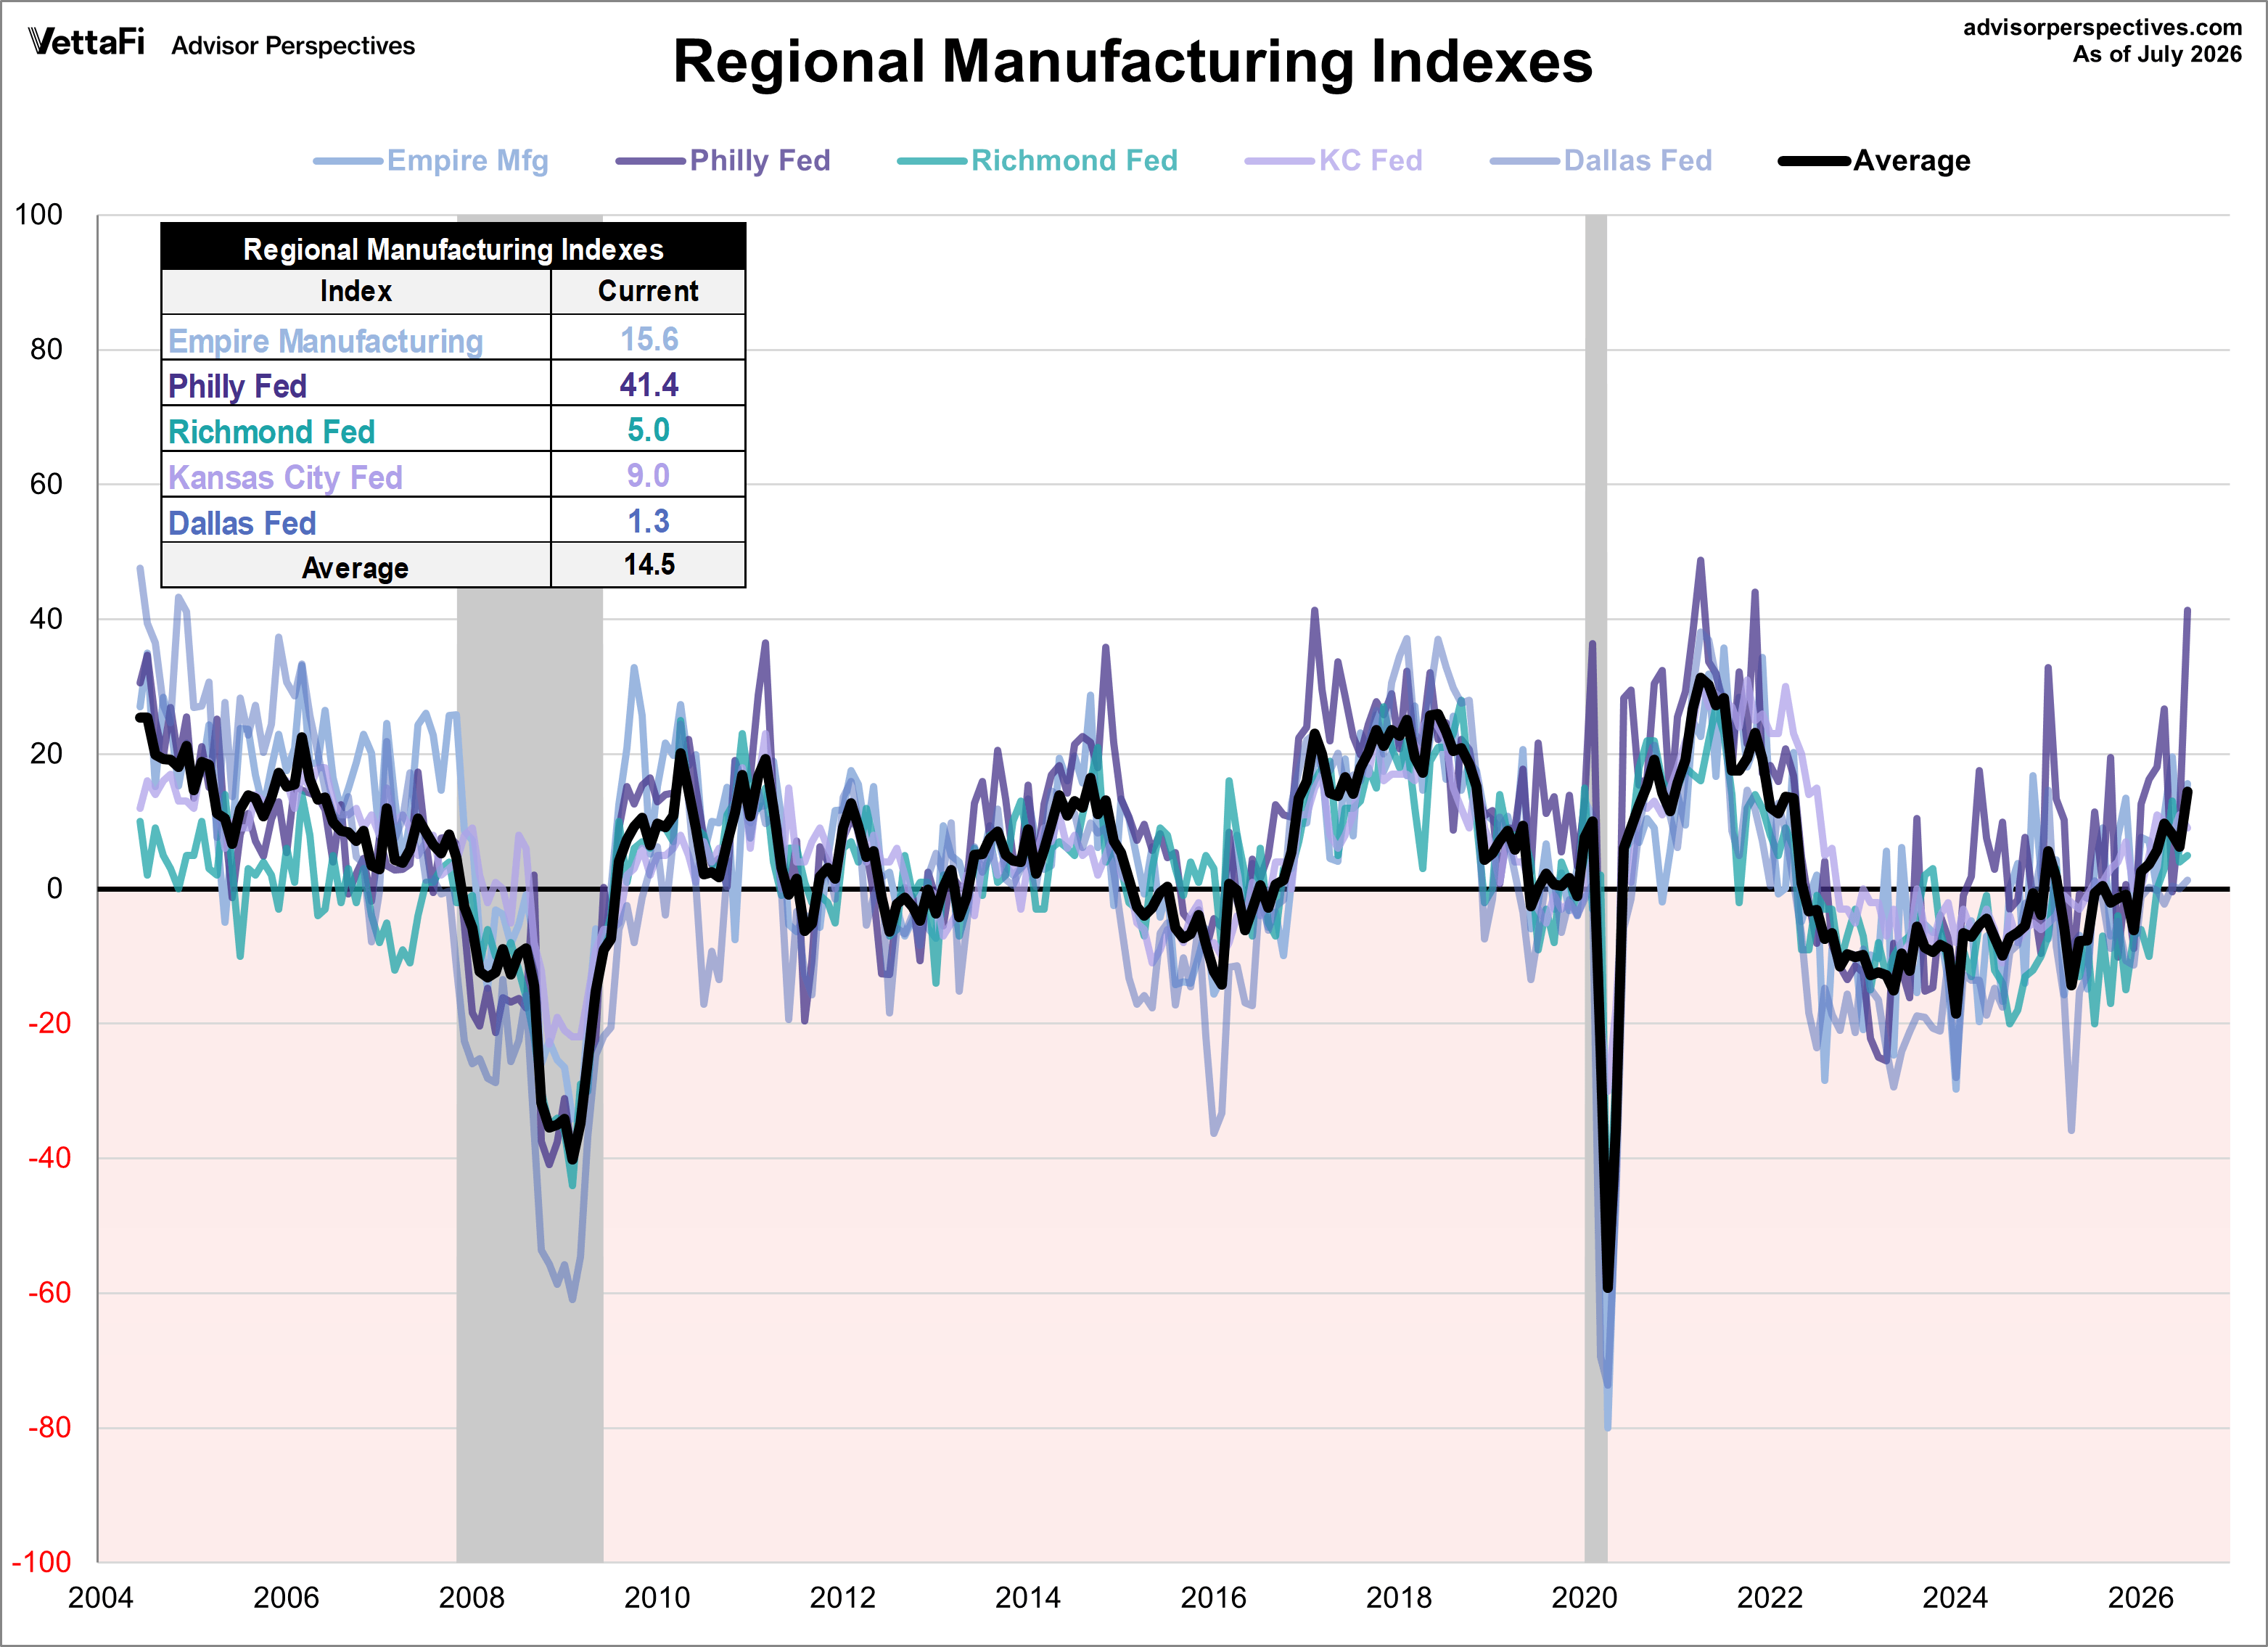
Here is the same chart including the average of the five.
ETFs associated with industrials and manufacturing include: First Trust Industrials/Producer Durables AlphaDEX Fund (FXR), Industrial Select Sector SPDR Fund (XLI), Vanguard Industrials ETF (VIS), and iShares U.S. Industrials ETF (IYJ).