Key Points
- Economic (and earnings) momentum has picked up—and not just post-election.
- Earnings are expected to grow by more than 12% in 2017.
- Valuations are reasonable considering inflation; but that also represents a risk factor next year.
The stock market has had an excited run since the presidential election, with heightened optimism for growth looking ahead into 2017. Not to rain on the optimists’ parade, but there was actually ample evidence of improving growth before the election.
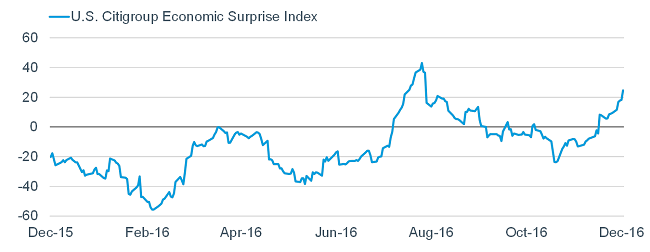
Economy better than expectations
As seen in the chart below, the recent surge in the Citigroup Economic Surprise Index—a measure of how economic reports are coming in relative to expectations—began about three weeks ahead of the election.

Source: FactSet, as of December 2, 2016.
Notable strength has been seen among the various confidence measures—including consumer and business—regional manufacturing indexes, both ISM manufacturing and services indexes, housing-related data, the oil/gas rig count, railcar loadings, retail sales, motor vehicle sales, and job/wage growth.
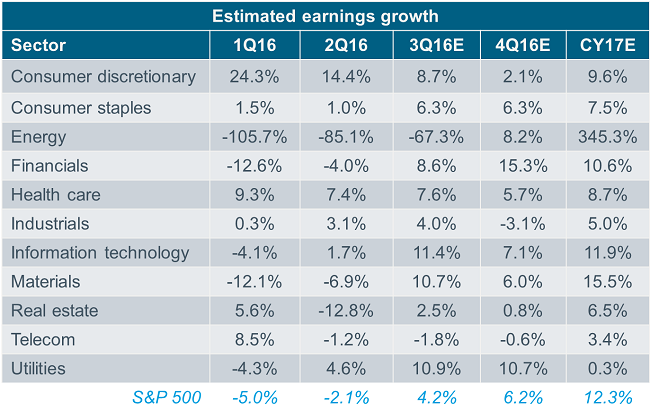
Earnings recession decisively over
The improvement in economic growth and prospects has helped turn the earnings expectations frown upside down. The table below shows earnings growth by sector (and for the S&P 500 overall), covering each quarter so far this year, as well as for 2017. The first two quarters of 2016 now represent “actual” results; while the third quarter is not yet official (hence, they’re still “expected” results). Clearly, since they haven’t yet been reported, the data shown for both the fourth
quarter and next year are “expected” results.
Source: Thomson Reuters, as of December 2, 2016.
Nowhere is the improvement in earnings more dramatic than in the energy sector. From a drag of more than -100%, energy sector earnings are expected to rebound by nearly 350% in 2017. But it’s not just energy—every one of the 11 S&P 500 sectors is now expected to show positive growth next year.
After three consecutive years (2014, 2015 and 2016) of S&P 500 earnings of about $118—i.e., no growth—Thomson Reuters has nearly $133 as an expectation for 2017.
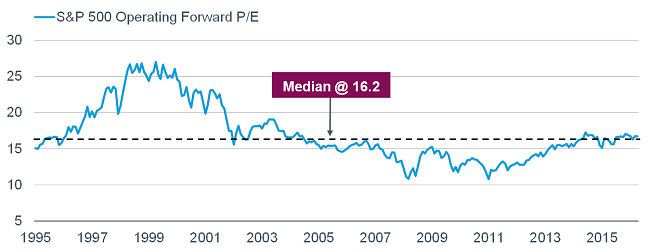
Both P and E in P/E rising
So, the E in the P/E is improving. What about valuations specifically? I’ve noted frequently over the past year that the conditions for valuation expansion were limited; especially recently given the move higher in both inflation and longer-term interest rates. That meant earnings needed to do more of the heavy lifting for the market; which appears to be kicking in.
Let’s take a look at the most commonly-used valuation metric—the forward P/E on the S&P 500. As you can see, the market is trading right around the 20-year median; suggesting it’s neither cheap nor expensive.
Source: FactSet, as of December 2, 2016. P/Es are based on forward 12-month consensus operating earnings.
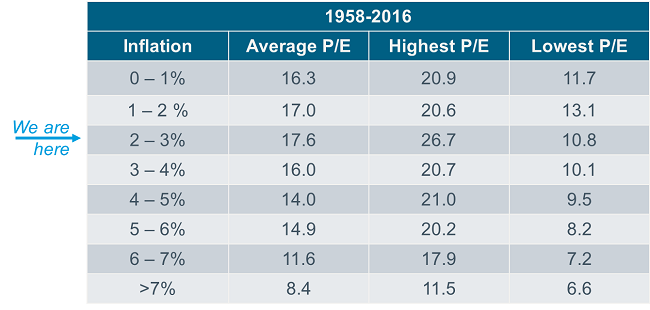
But valuations should never been viewed in a vacuum relative to historic medians. Inflation needs to be considered given that earnings are more valuable when inflation is low (but not too low). The table below dates back to 1958 and breaks the period down into a variety of inflation zones, using the core Consumer Price Index (CPI).
Source: Bureau of Labor Statistics, FactSet, as of October 31, 2016.
As you can see, we currently reside in the “sweet spot” for inflation; during which times historically the market has traded at the highest average multiple. If inflation remains in this zone, it suggests the market is a bit under-valued. Any acceleration in inflation beyond current projections could put some downward pressure on multiples.
The net
The third quarter marked the return to positive earnings growth; after a five quarter “earnings recession.” Every year since the Great Recession ended in mid-2009, the U.S. economy has suffered a mid-year slowdown; with the drag from the energy sector particularly impactful on corporate earnings. It looks like we may finally launch out of what had been an earnings recession—but also the muddle through era in which the U.S. economy has sat so far in this recovery.
The information provided here is for general informational purposes only and should not be considered an individualized recommendation or personalized investment advice. The investment strategies mentioned here may not be suitable for everyone. Each investor needs to review an investment strategy for his or her own particular situation before making any investment decision.
All expressions of opinion are subject to change without notice in reaction to shifting market conditions. Data contained herein from third party providers is obtained from what are considered reliable sources. However, its accuracy, completeness or reliability cannot be guaranteed.
Examples provided are for illustrative purposes only and not intended to be reflective of results you can expect to achieve.
(1216-RMUD)
© Charles Schwab
© Charles Schwab
Read more commentaries by Charles Schwab