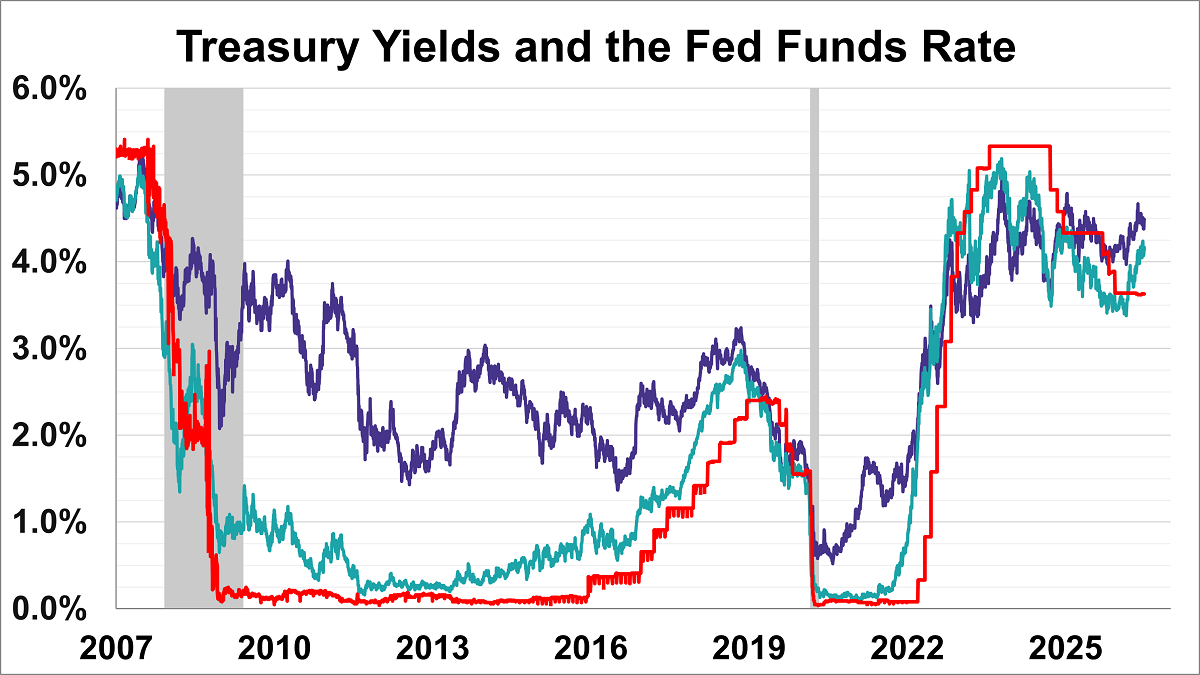
The yield on the 10-year note finished July 2, 2026 at 4.49% while the 2-year note ended at 4.14%.
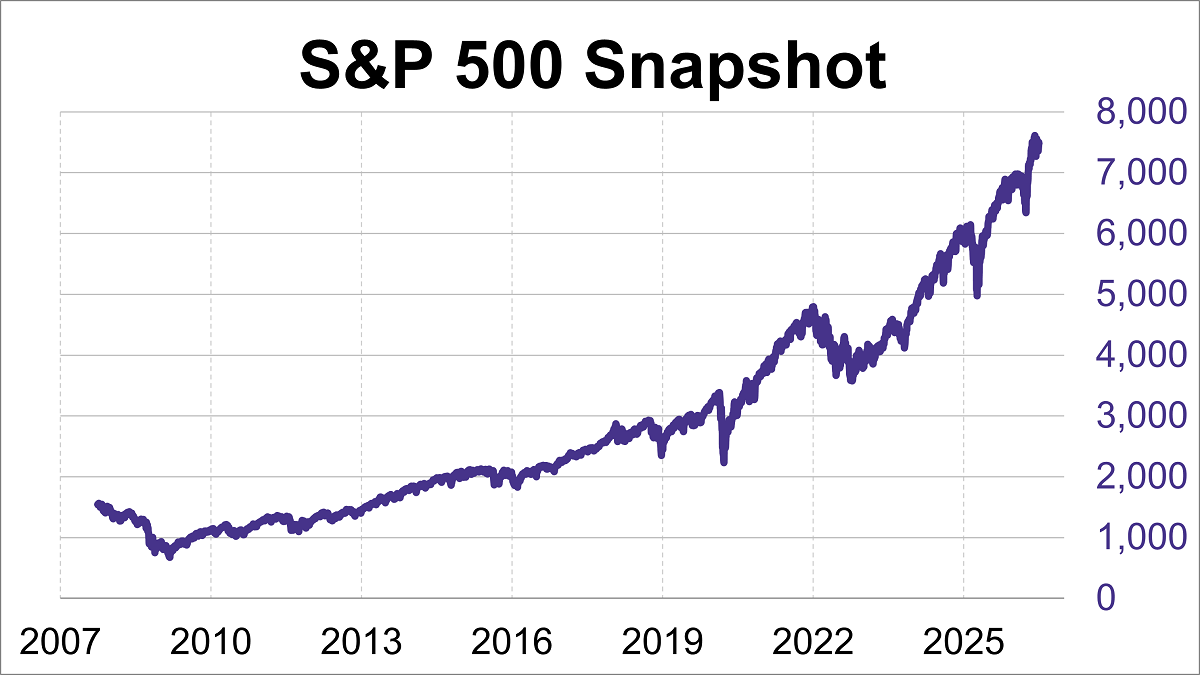
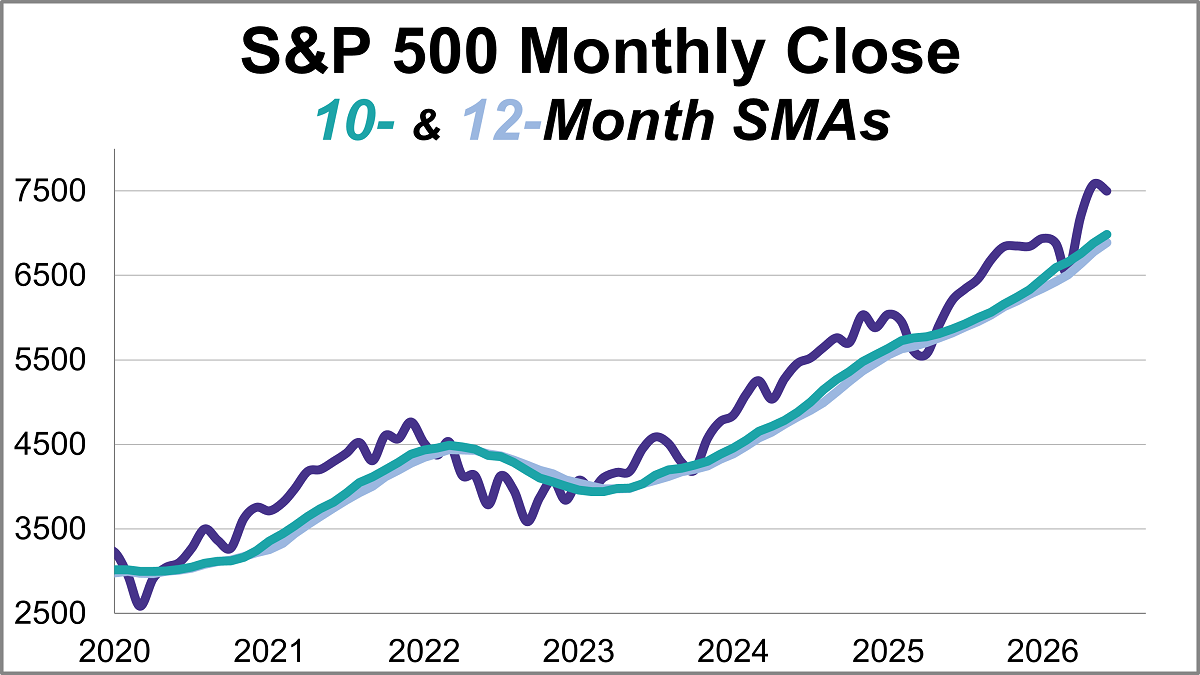
The S&P 500 experienced its best week in two months, finishing up 1.7% from last Friday.
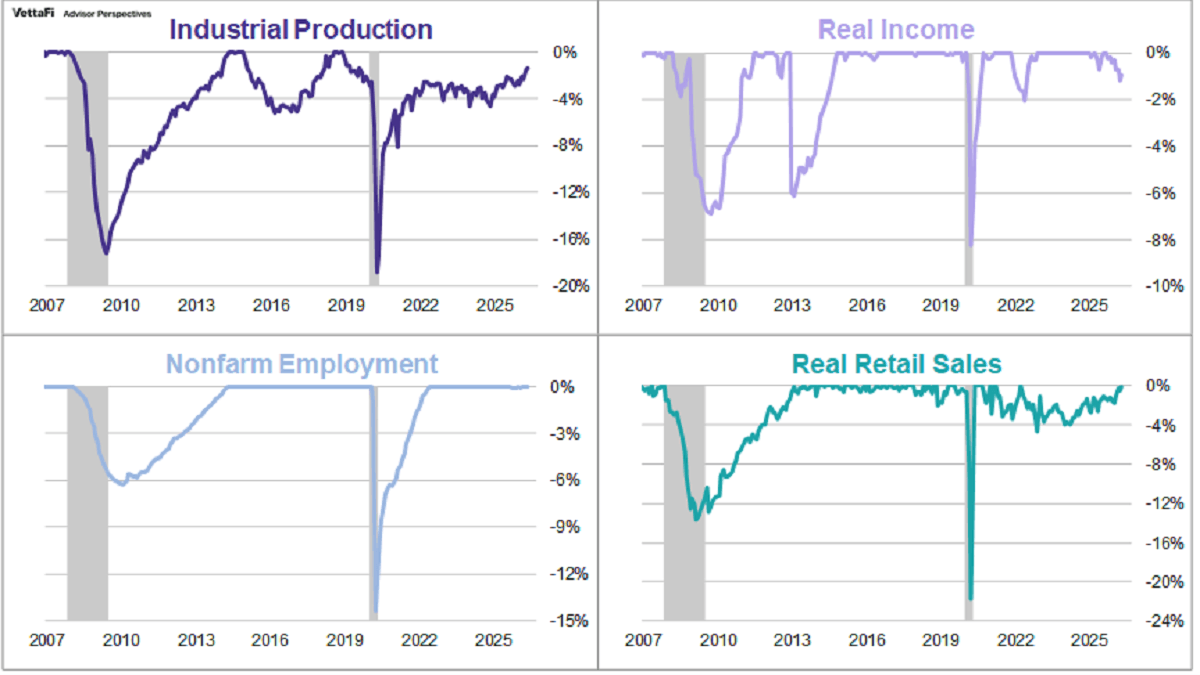
Official recession calls are the responsibility of the NBER Business Cycle Dating Committee, which is understandably vague about the specific indicators on which they base their decisions. There is, however, a general belief that there are four big indicators that the committee weighs heavily in their cycle identification process.
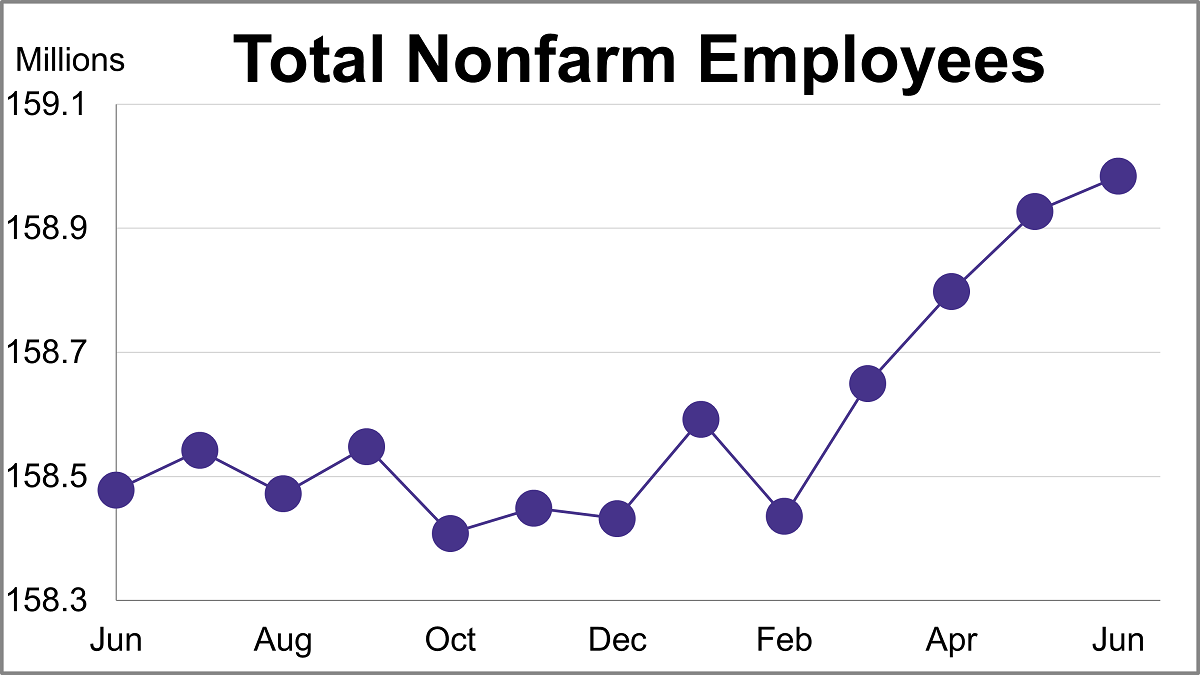
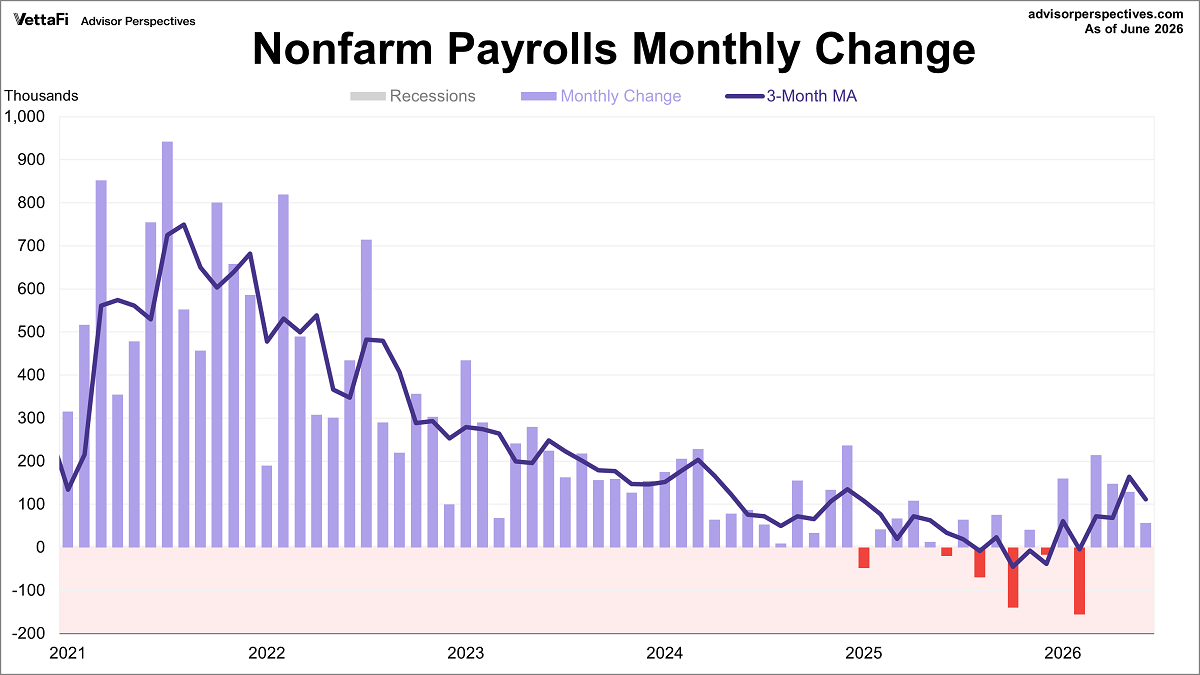
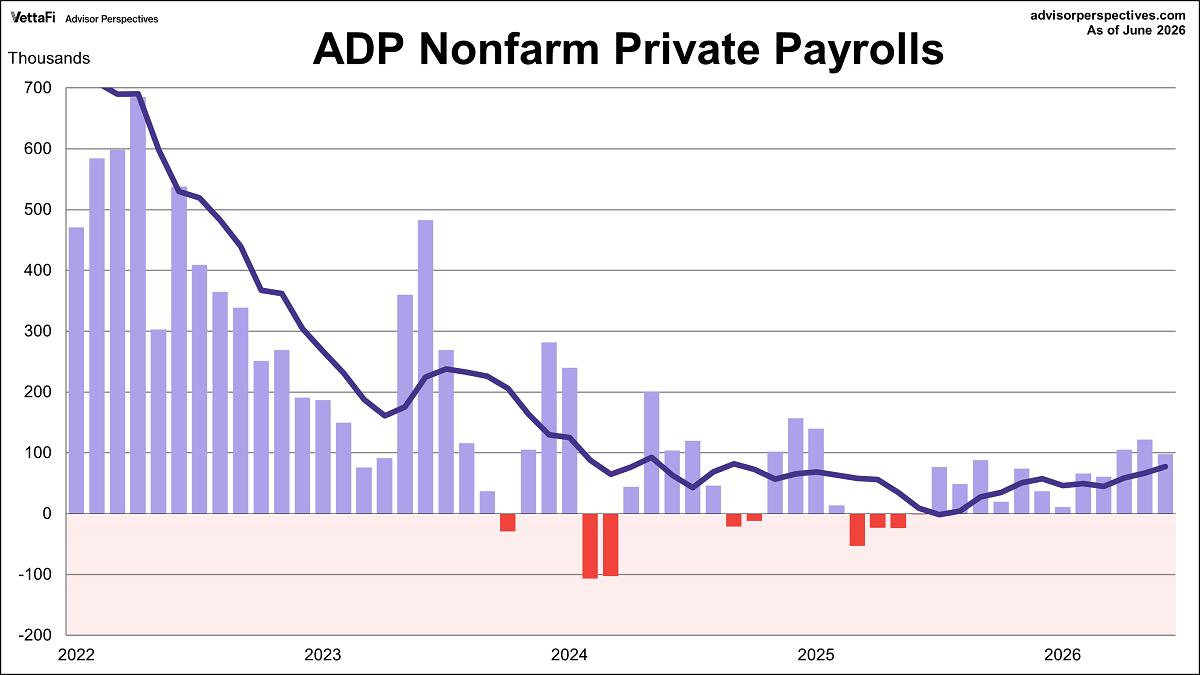
There is a general belief that there are four big indicators that the NBER Business Cycle Dating Committee weighs heavily in their cycle identification process. This commentary focuses on one of these indicators: nonfarm employment. In June, total nonfarm payrolls increased by 57,000 while the unemployment rate ticked down to 4.2%.
The latest employment report showed that 57,000 jobs were added in June, down from May's 129,000 gain. This figure was significantly lower than the projected addition of 114,000 jobs. Meanwhile, the unemployment rate unexpectedly ticked down to 4.2%.
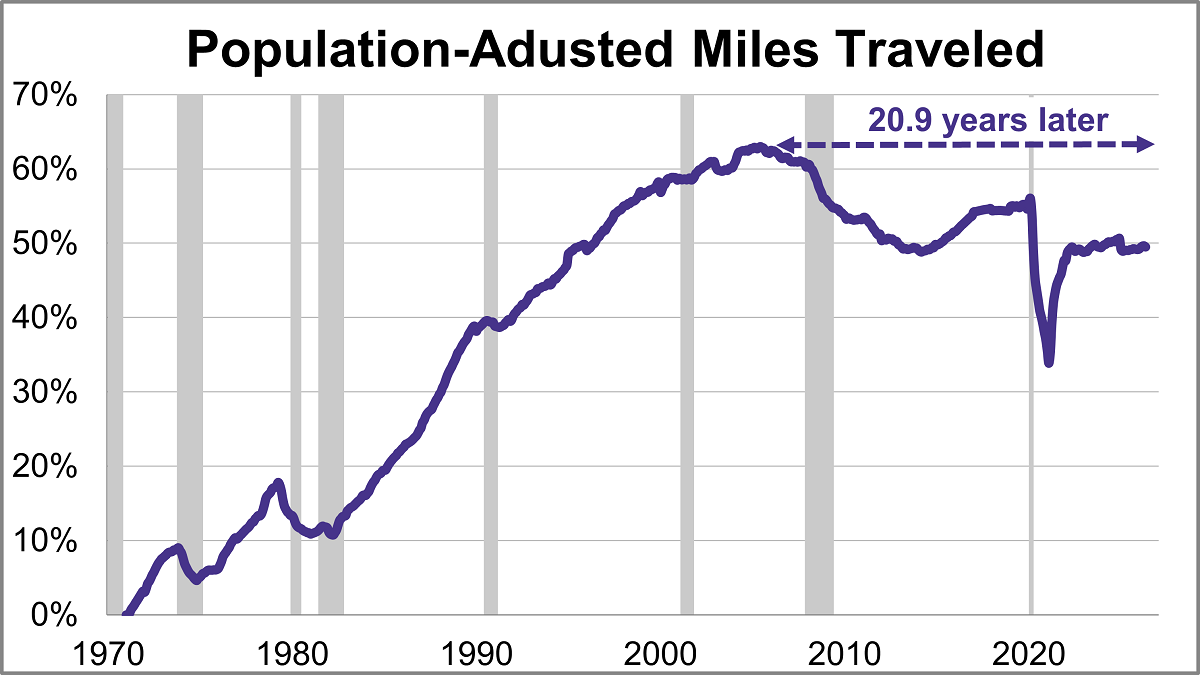
Travel on all roads and streets decreased in May. The 12-month moving average was down 0.06% month-over-month but was up 0.93% year-over-year. However, if we factor in population growth, the 12-month MA of the civilian population-adjusted data (age 16-and-over) was down 0.10% month-over-month and up 0.32% year-over-year.
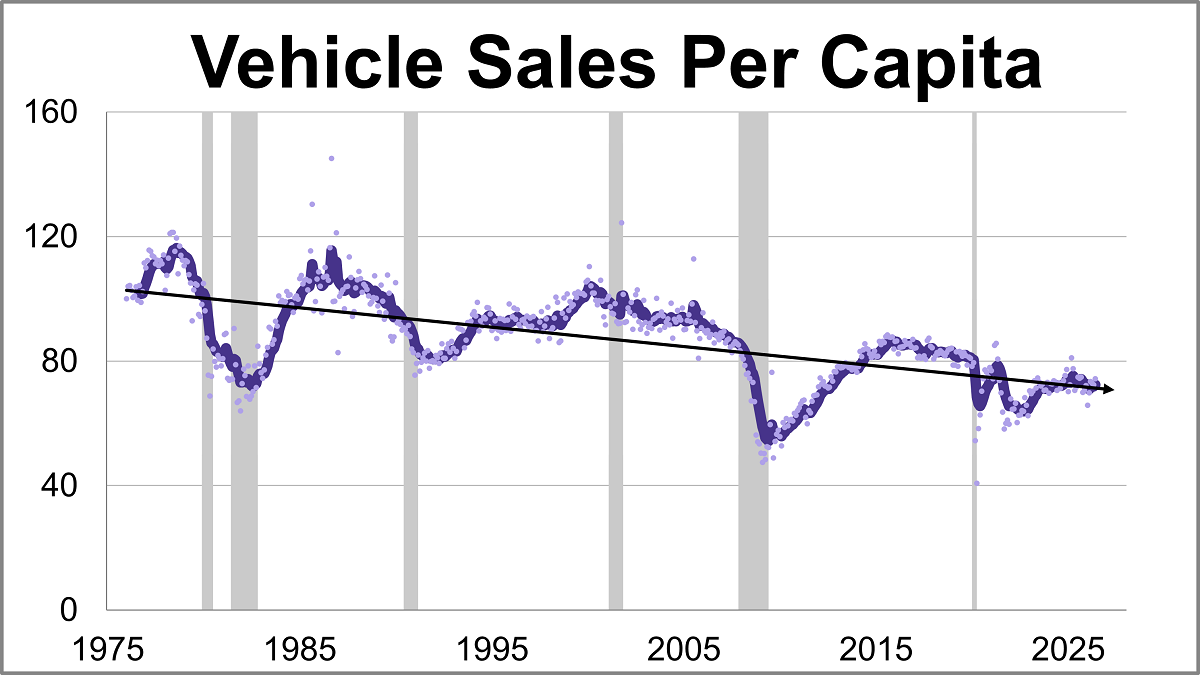
Vehicle sales rose to their highest level in nine months in June, coming in at a seasonally adjusted annual rate of 16.523 million units. This represents a 2.8% increase from the previous month and a 4.4% rise from one year ago.
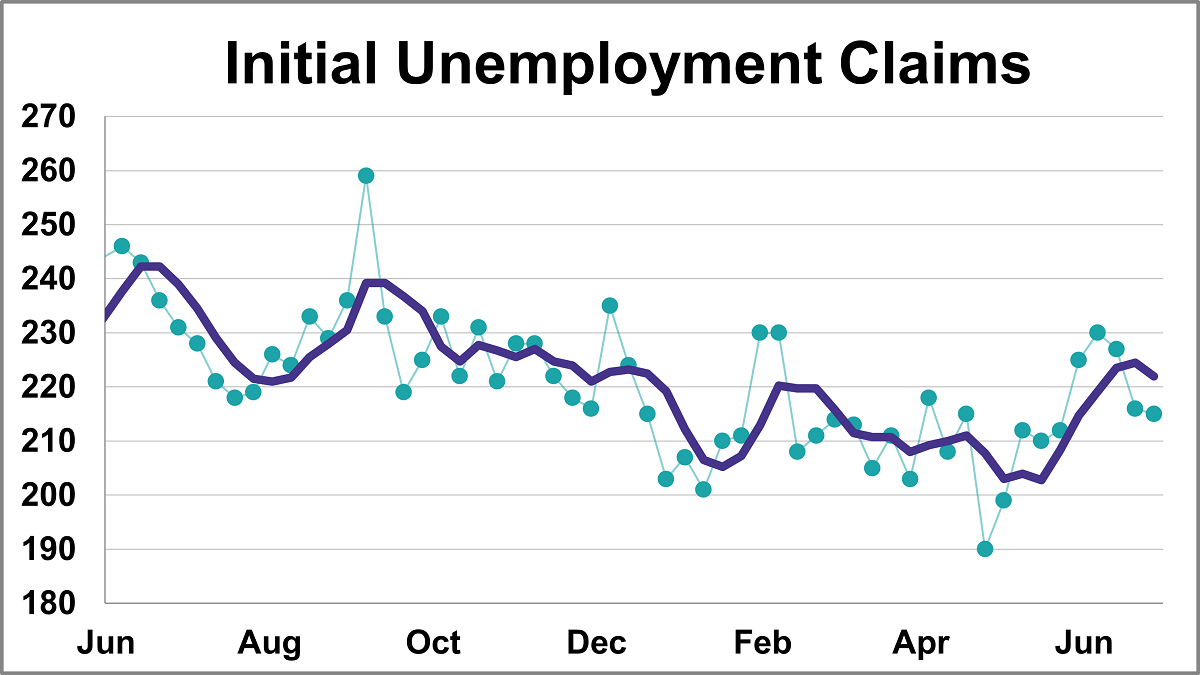
In the week ending June 27th, initial jobless claims were at a seasonally adjusted level of 215,000. This represents a decrease of 1,000 from the previous week's figure and was lower than the forecast of 219,000.
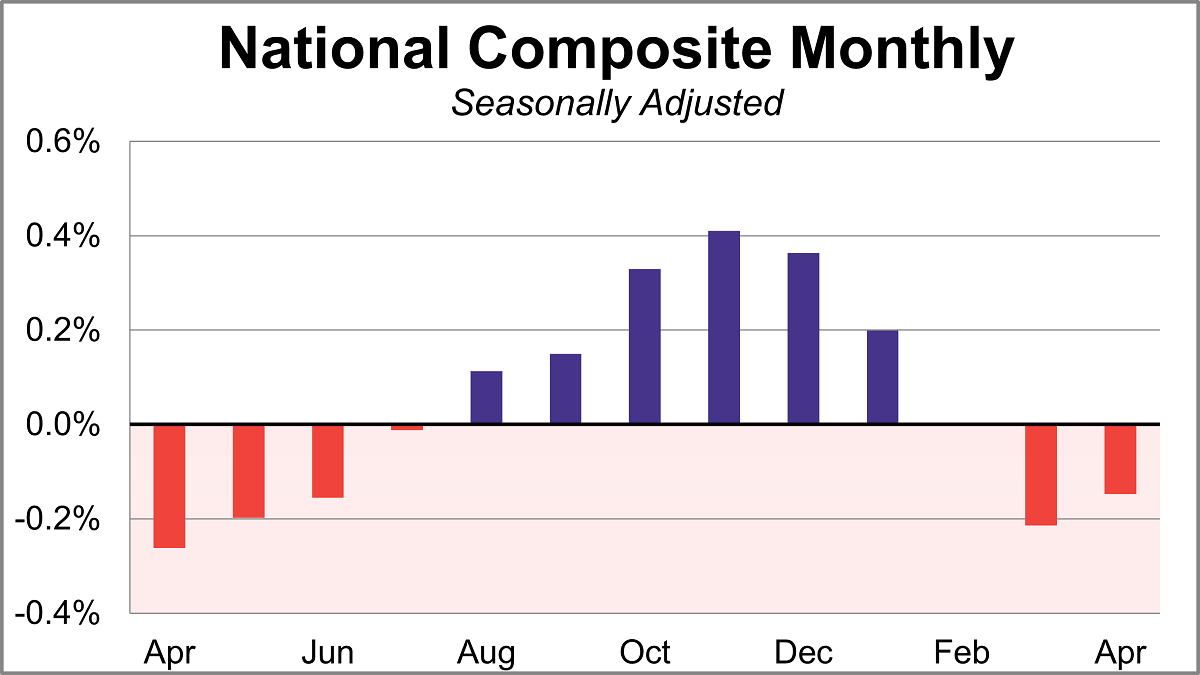
Home prices fell for a second straight month in April according to the S&P Cotality Case-Shiller index, as the housing slowdown intensifies. On a seasonally adjusted basis, the national index dropped 0.1% month-over-month and was up 0.8% year-over-year.
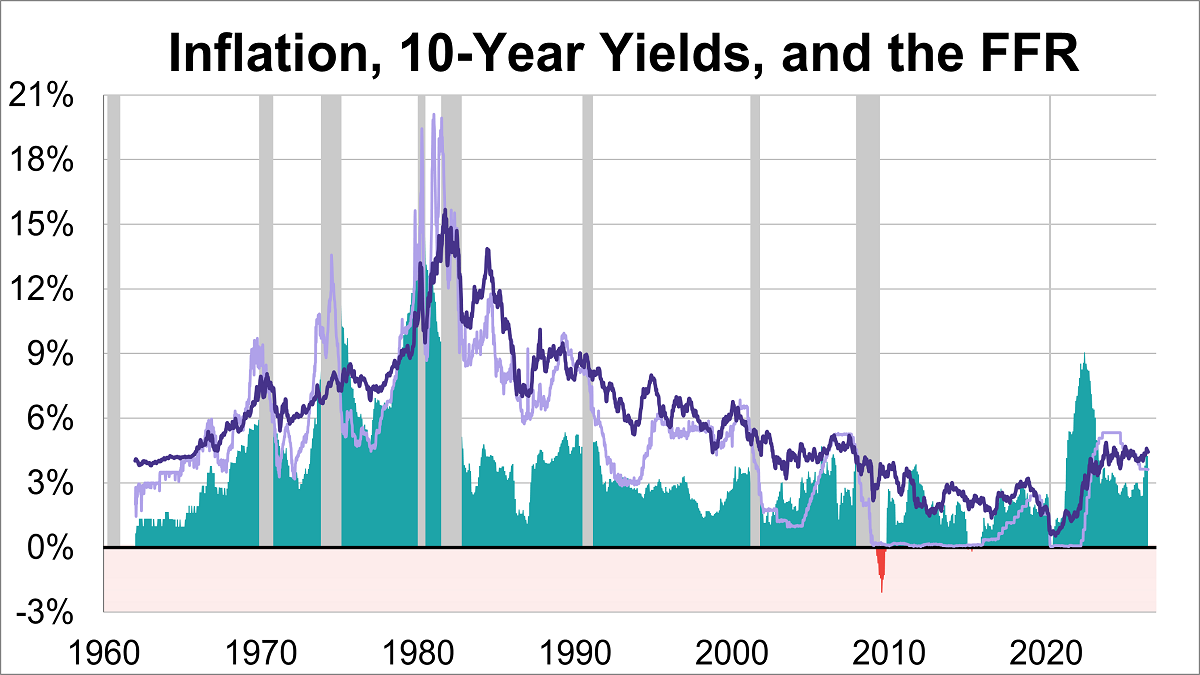
The 10-year Treasury yield has experienced dramatic fluctuations, ranging from a peak of 15.68% in October 1981, during the height of the Volcker era, to a historic low of 0.55% in August 2020, amidst the economic uncertainty of the pandemic. At the end of June 2026, the weekly average stood at 4.44%.
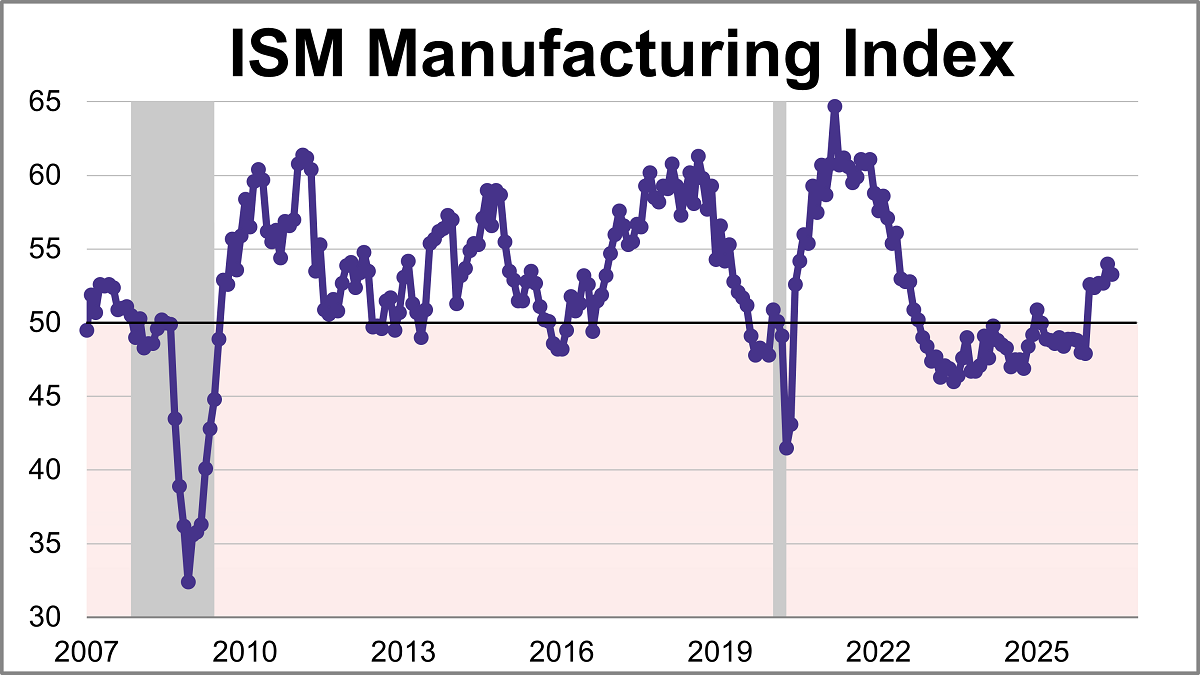
The Institute for Supply Management (ISM) manufacturing purchasing managers index (PMI) came in at 53.3 in June, down from 54.0 in May, marking slightly slower growth. The latest reading was just below the 53.8 forecast and is the index's sixth straight month in expansion territory.
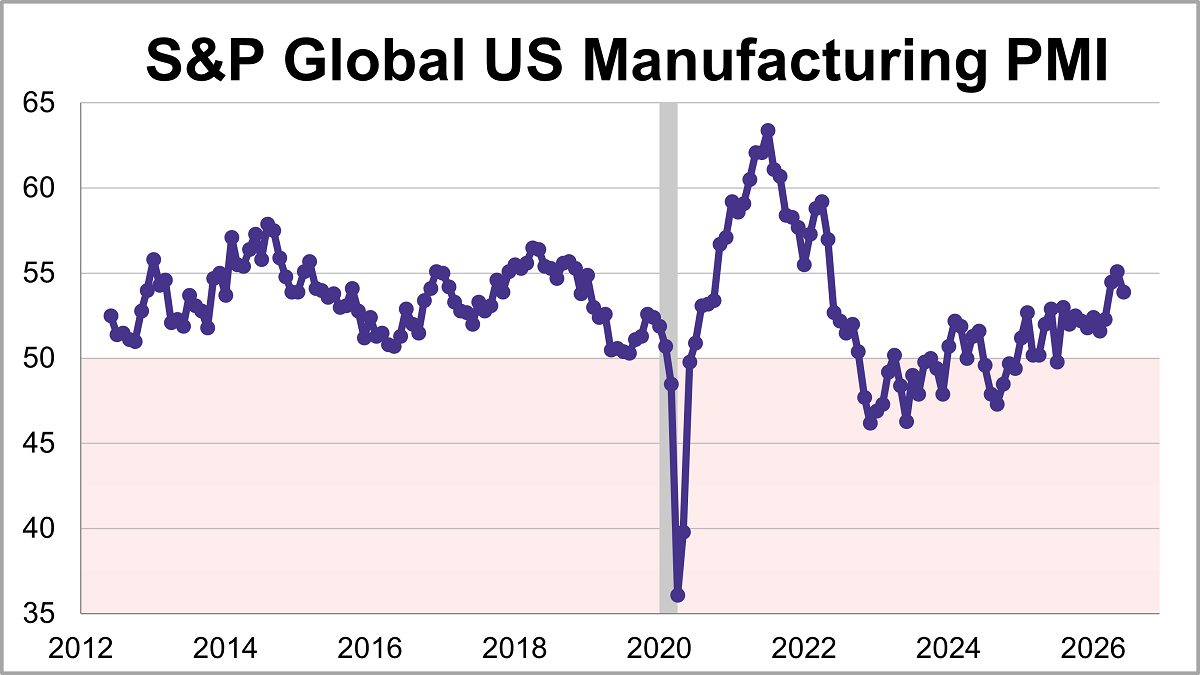
U.S. manufacturing expanded for an eleventh straight month in June but the growth eased to its lowest level in three months. The S&P Global PMI fell 1.2 points to 53.9 last month, falling short of the 55.7 forecast.
The ADP employment report revealed that 98,000 nonfarm private jobs were added in June, the twelfth straight month of growth. However, the latest figure was below the projected 118,000 addition.
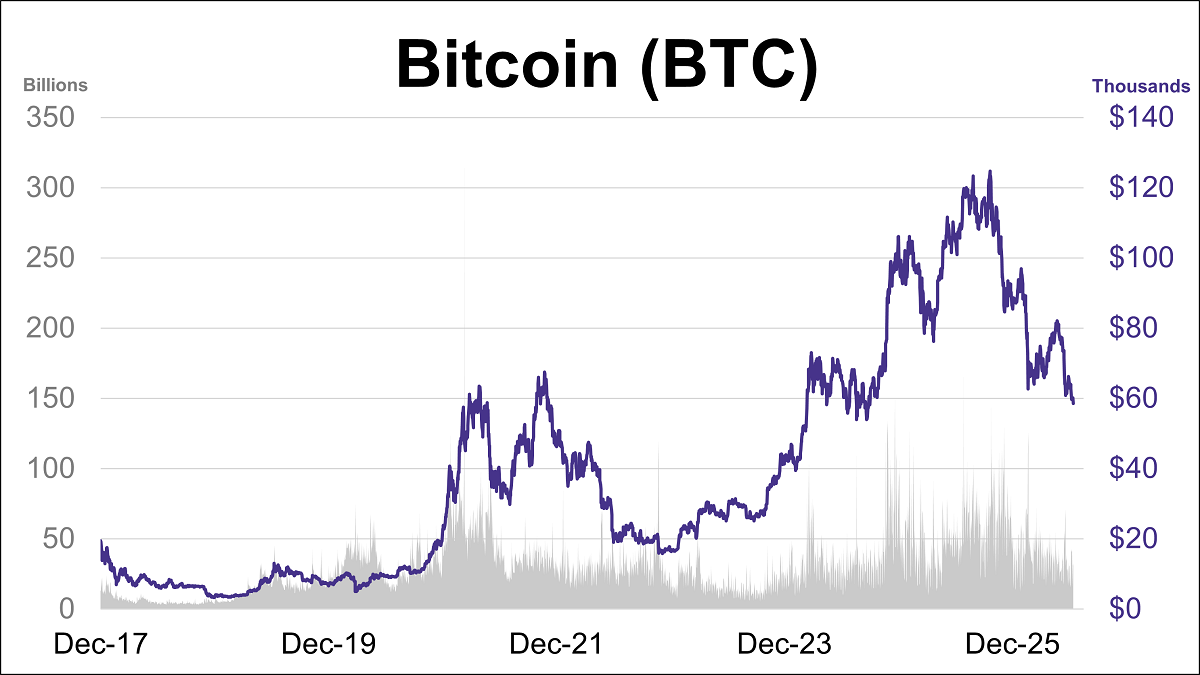
Bitcoin's struggles continued this week as it reached its lowest level since September 2024. BTC is currently down approximately 33% midway through the year and sits about 53% below its October 2025 record high.
Valid until the market close on July 31, 2026
This article provides an update on the monthly moving averages we track for the S&P 500 and the Ivy Portfolio after the close of the last business day of the month.
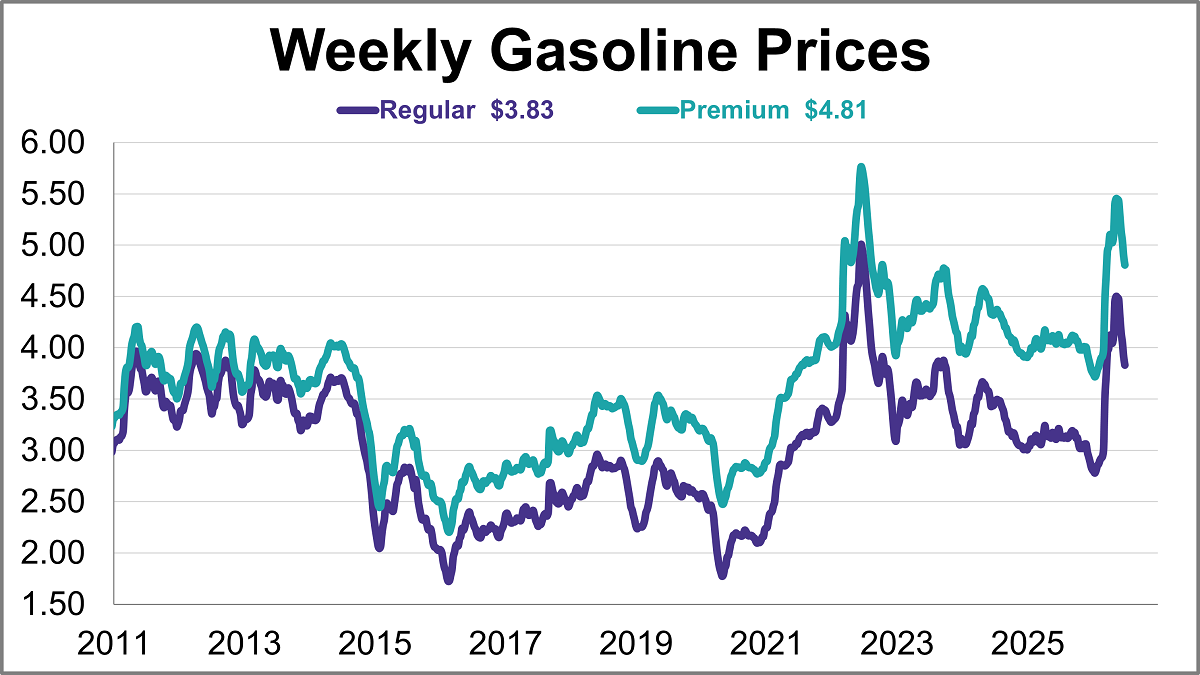
Gasoline prices fell for a seventh straight week, reaching their lowest level in 3.5 months. As of June 29th, weekly prices were down 8 cents for regular and down 9 cents for premium gasoline.
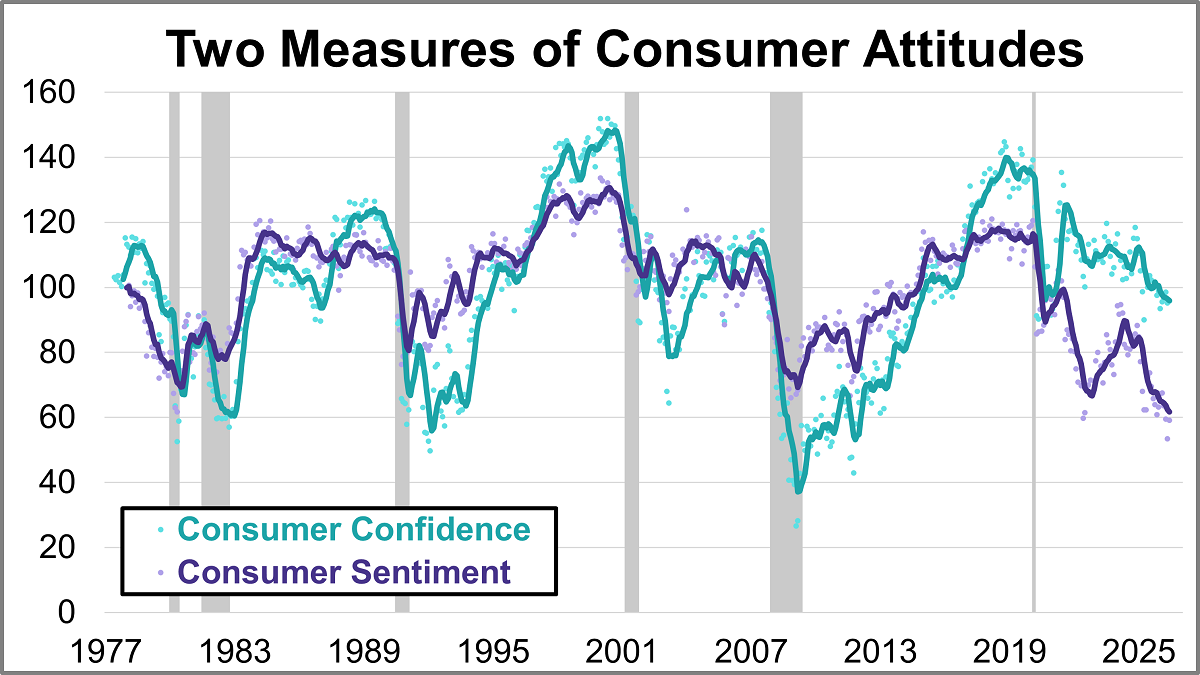
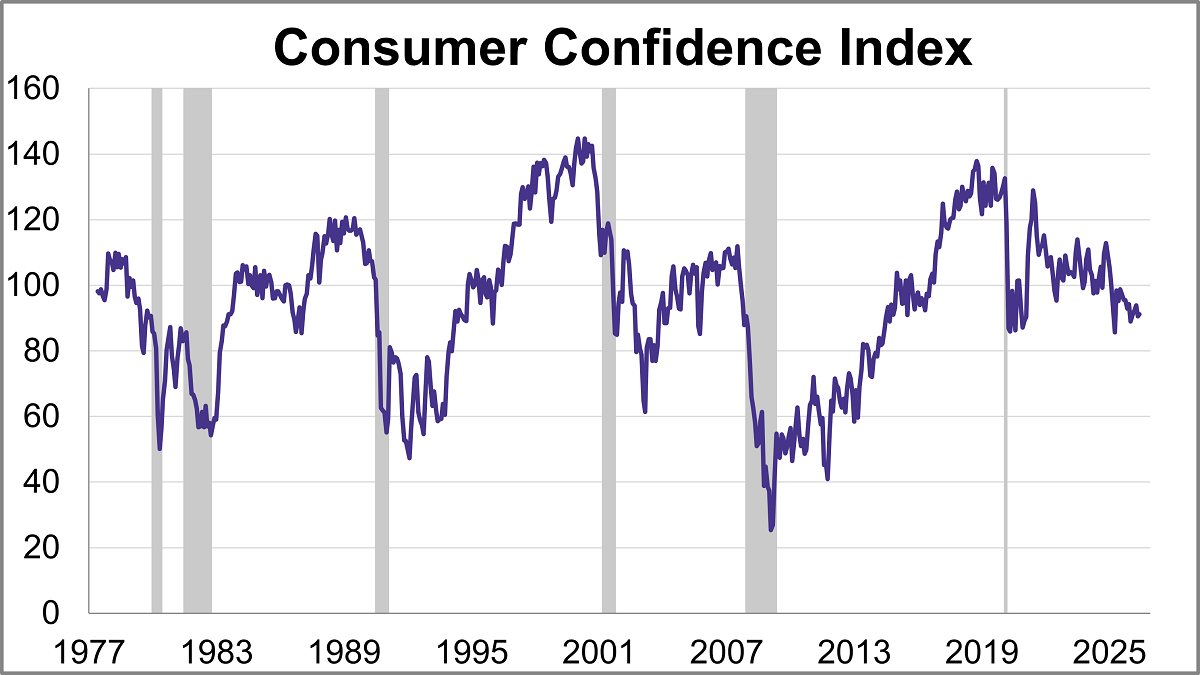
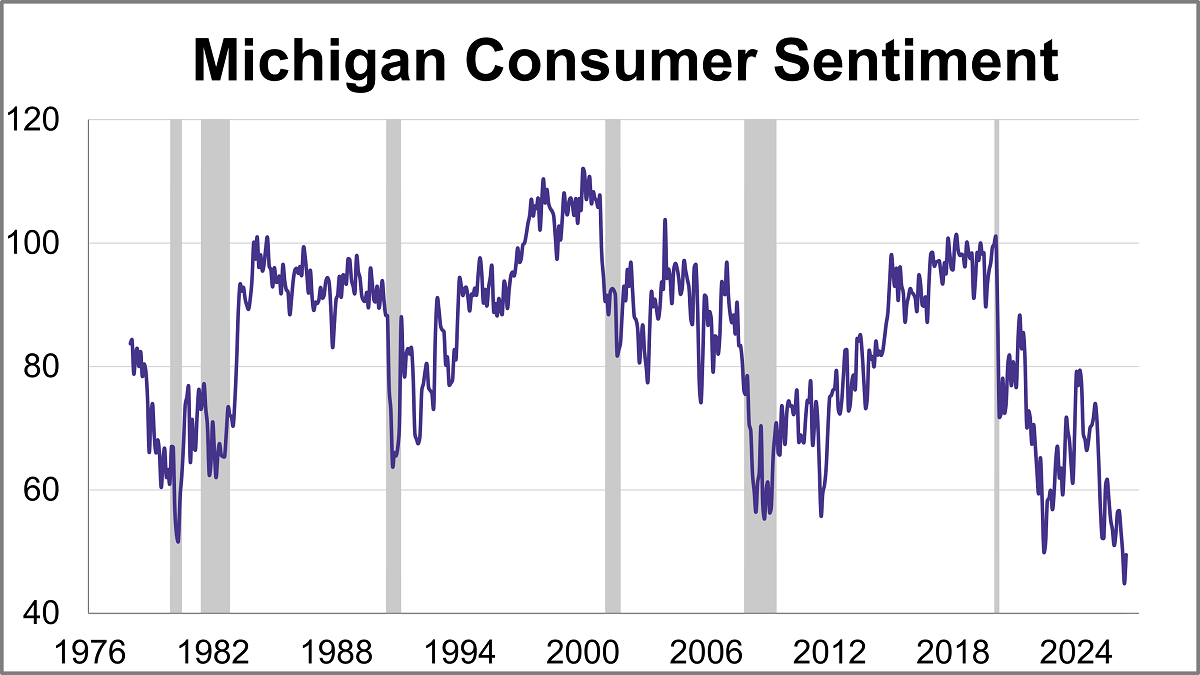
What are consumers thinking about the economy? Their collective mood offers crucial clues for businesses, investors, and policymakers alike. In June, the two leading benchmarks, the University of Michigan’s Consumer Sentiment Index (MCSI) and the Conference Board’s Consumer Confidence Index (CCI), offered similar views with both showing slight improvement despite ongoing inflation concerns.
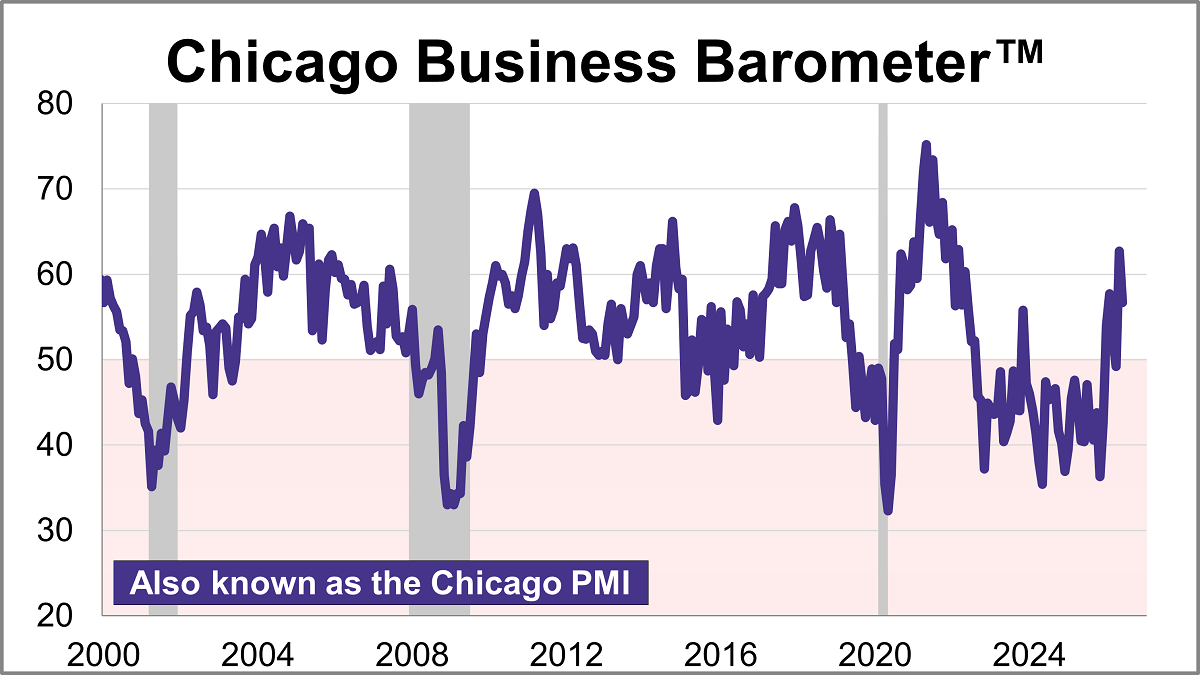
The Chicago Purchasing Managers’ Index cooled 6.0 points in June to 56.7, signaling an expansion in regional business activity for a second straight month. The latest reading was higher than the projected 55.7.
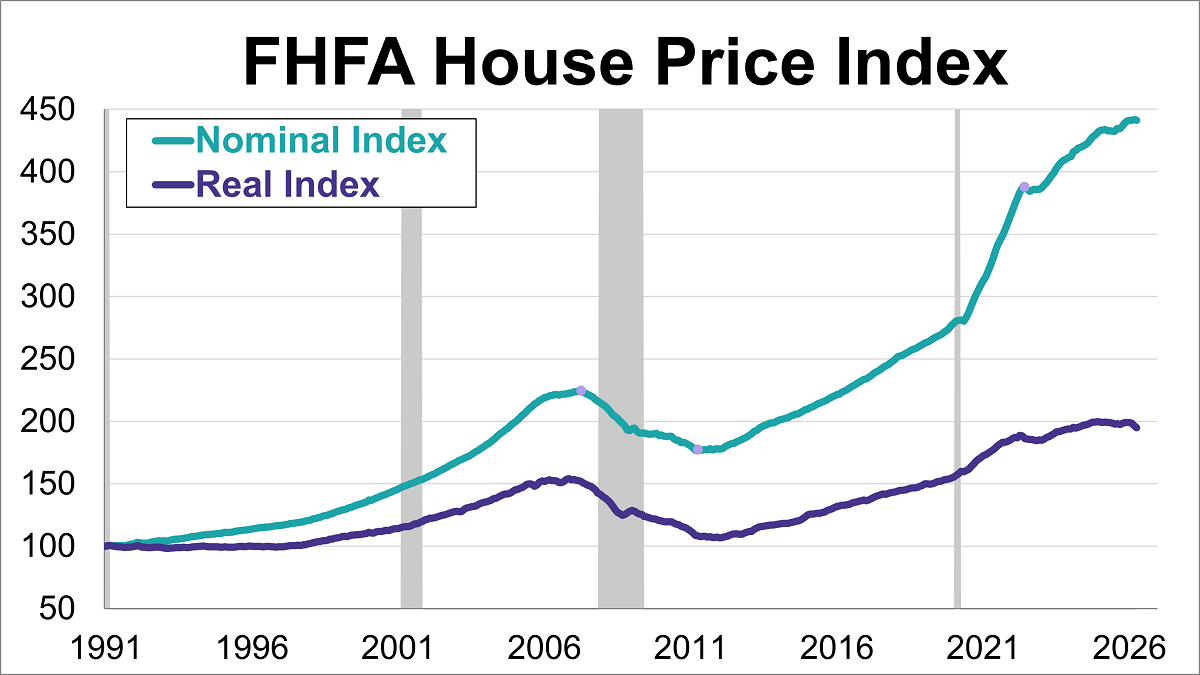
The Federal Housing Finance Agency (FHFA) House Price Index (HPI) retreated in April, falling 0.1% from the previous month's record high to 441.4.
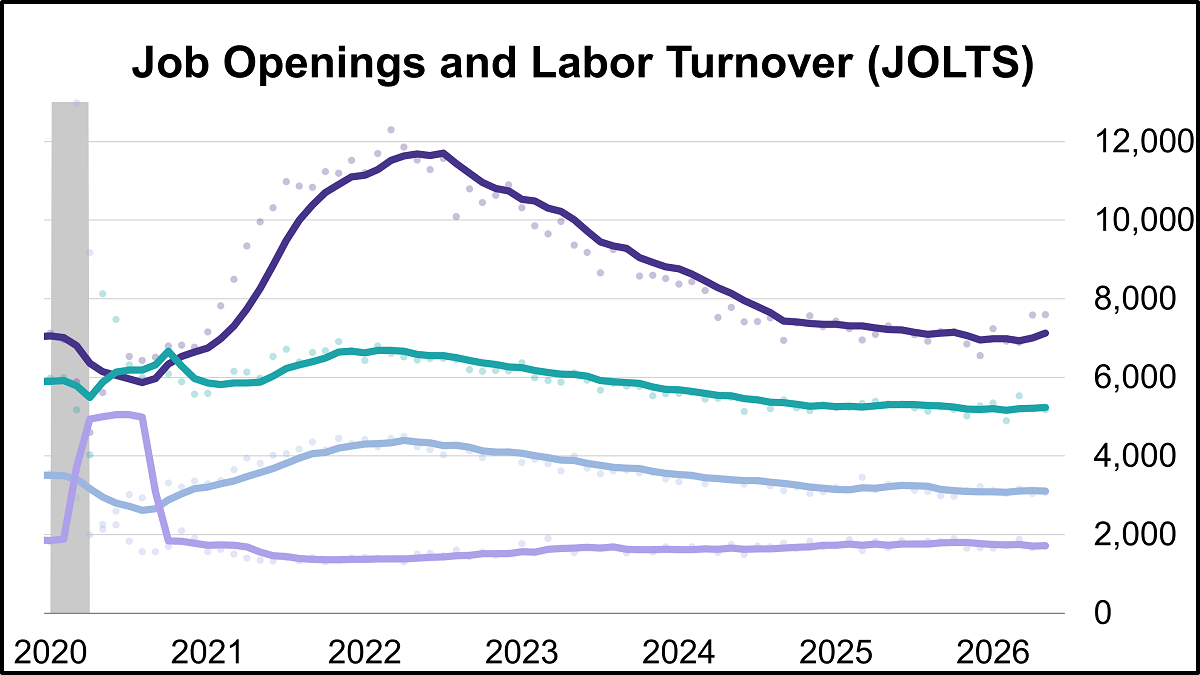
Job openings reached their highest level in two years in May, hitting 7.594 million vacancies according to the latest Job Openings and Labor Turnover Survey (JOLTS). The latest reading was higher than the projected 7.280 million openings.
The Conference Board's Consumer Confidence Index® inched up in June, rising 0.6 points to 91.2. Despite the improvement, the index came in below the forecast of 94.4.
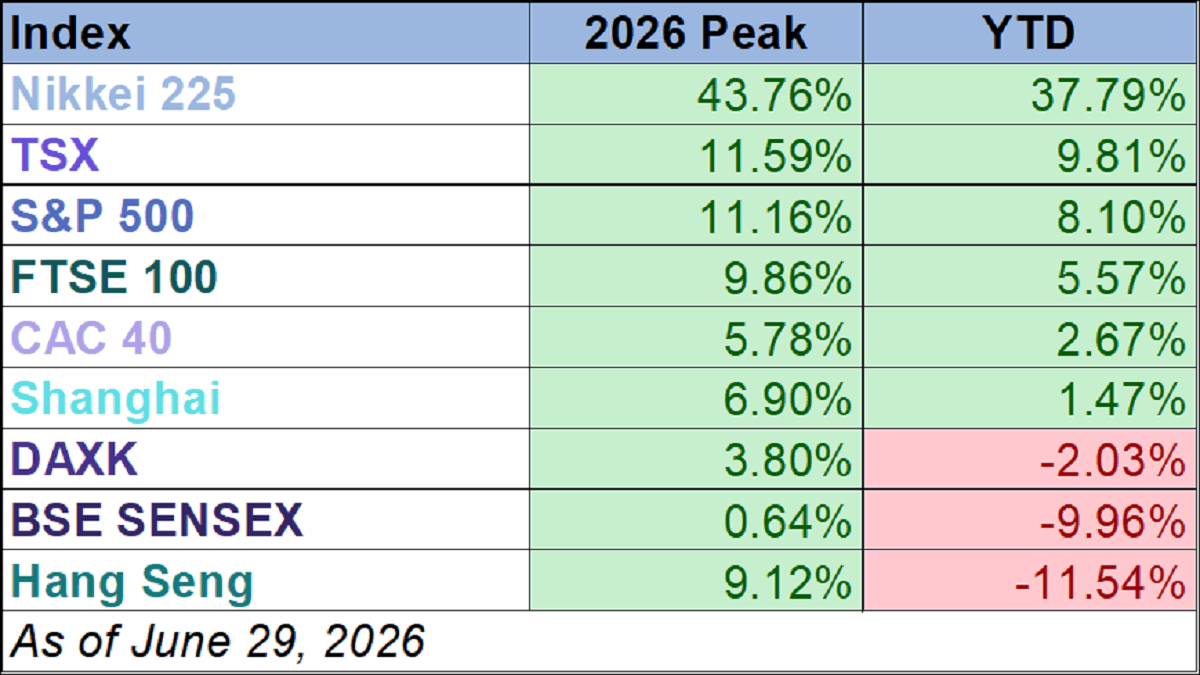
Six of the nine indexes on our world markets watch list posted year-to-date gains through June 29, 2026.
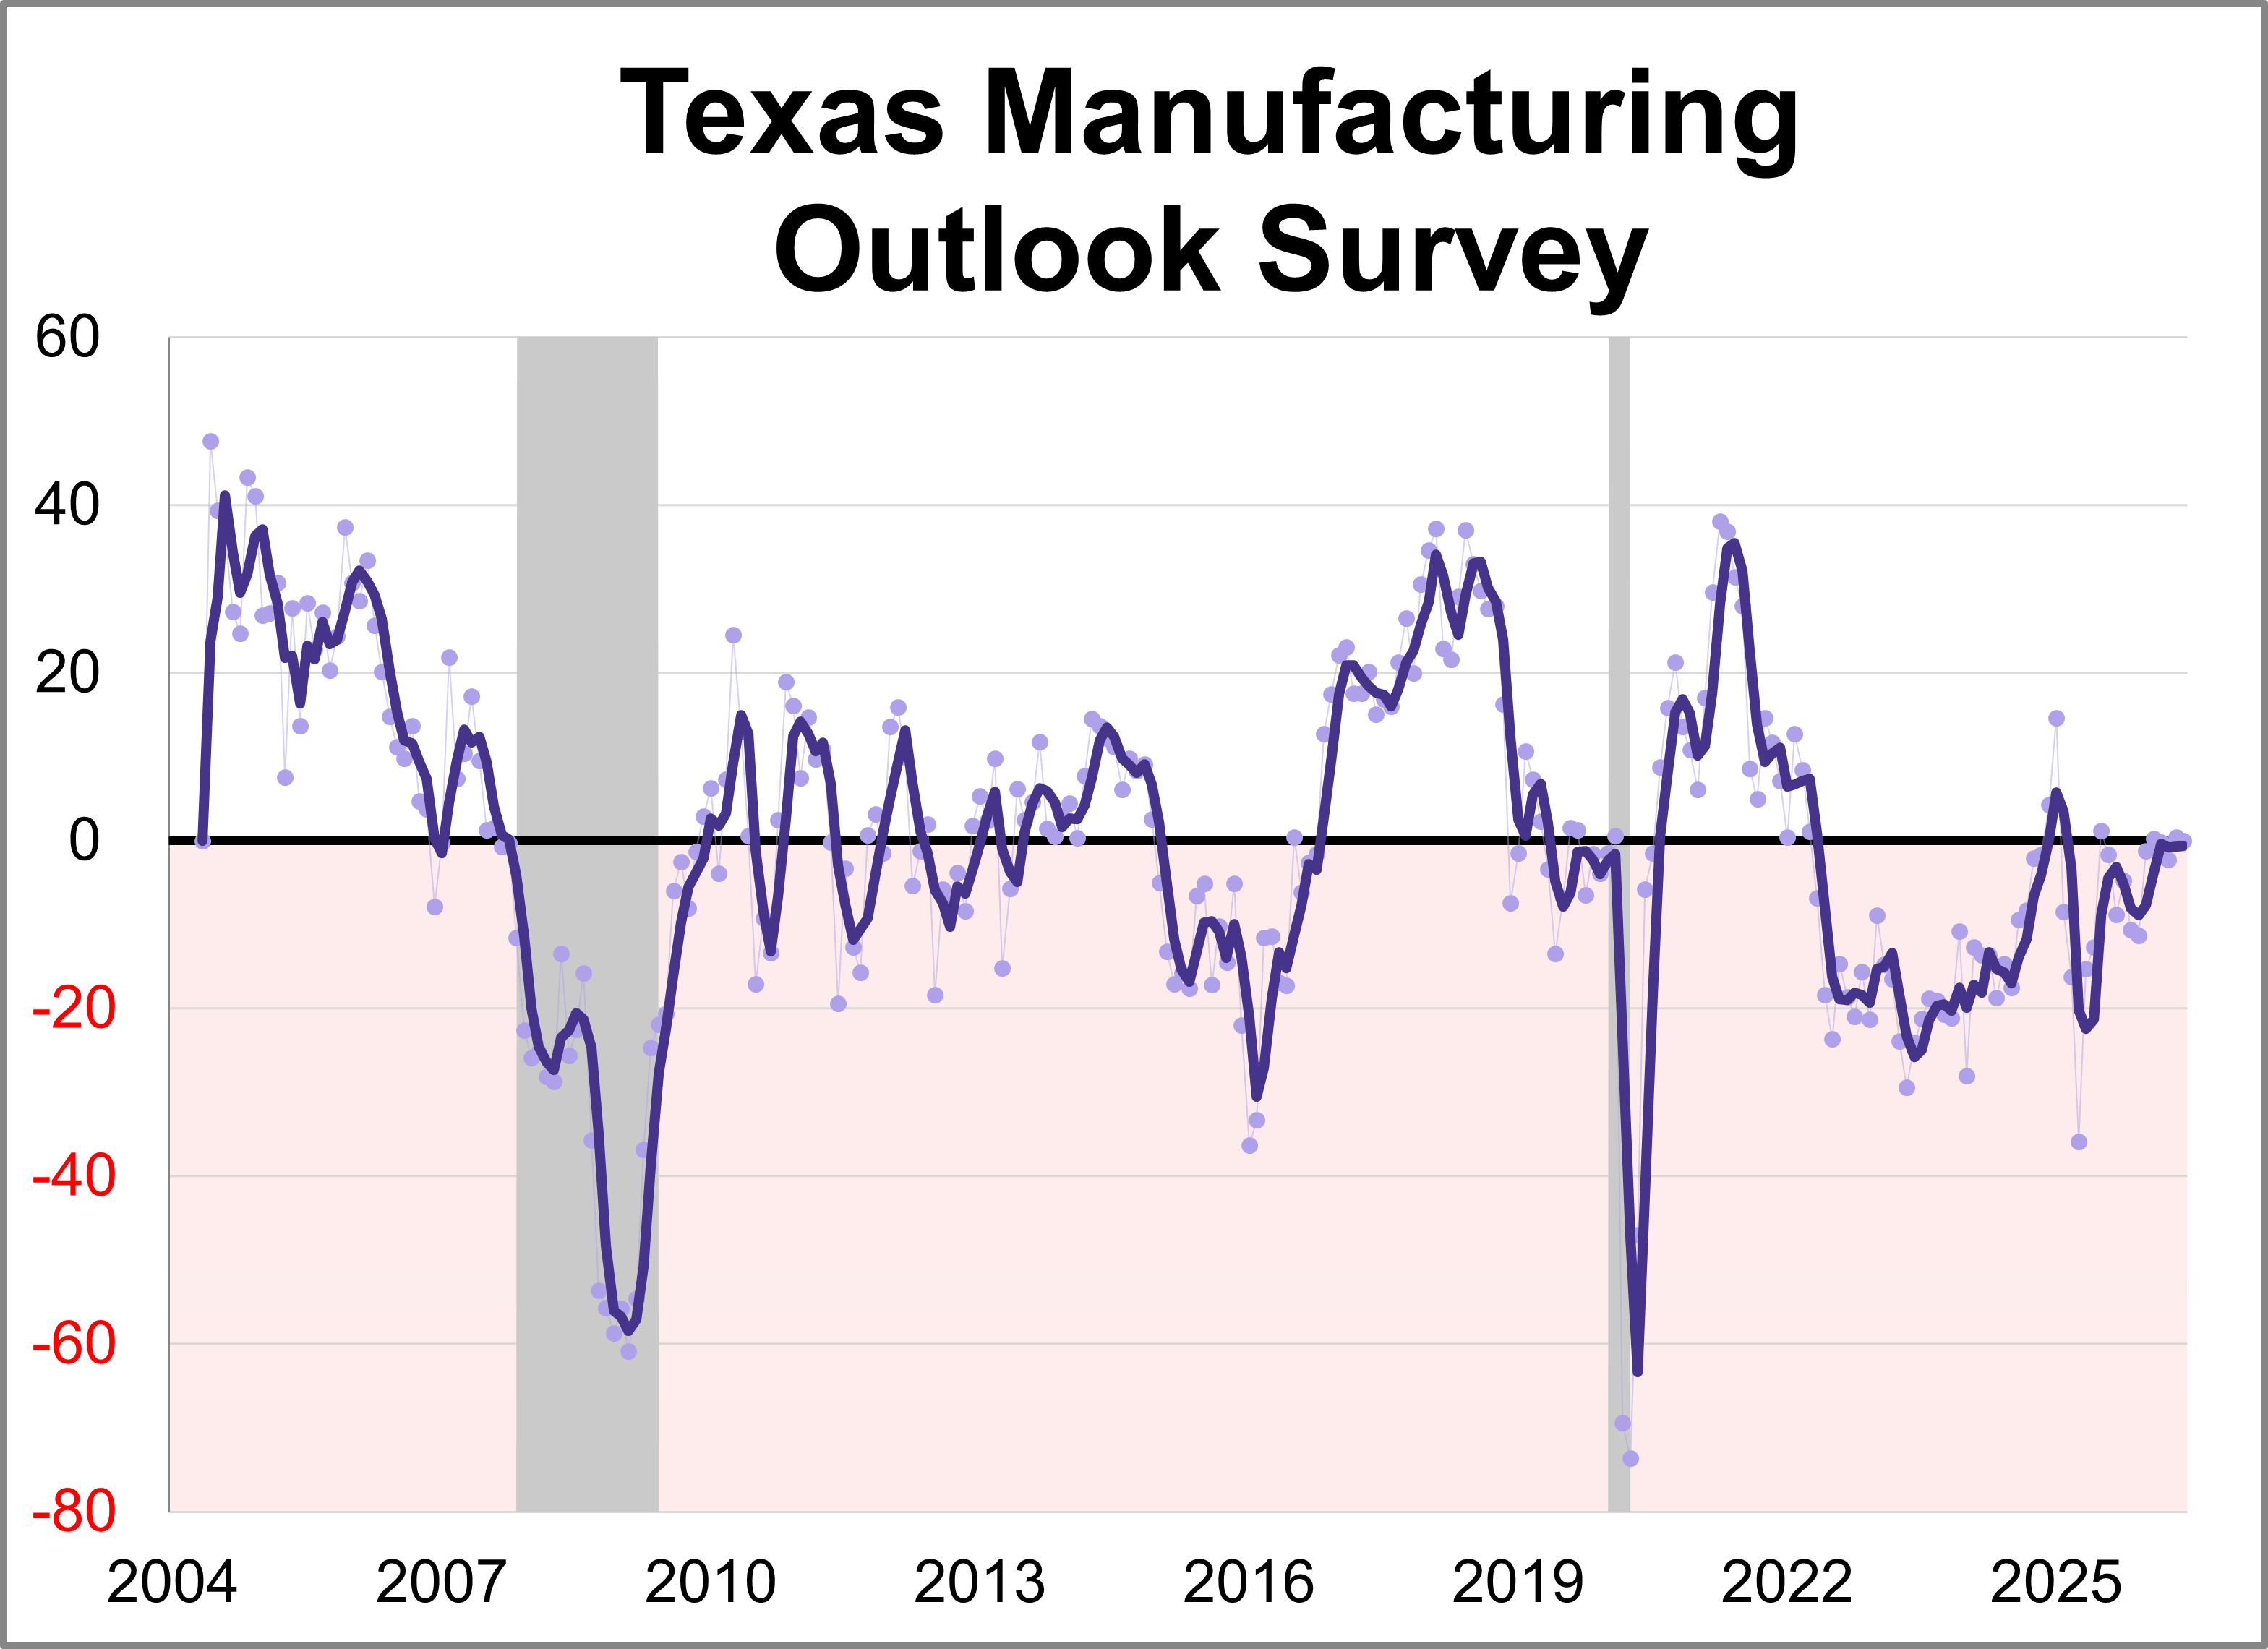
The Dallas Fed released its Texas Manufacturing Outlook Survey (TMOS) for June. The general business activity index fell 0.4 points to 0.0, indicating slower growth of manufacturing activity and stable business conditions perceptions.
Last week’s data reaffirmed that inflation pressures remain the defining narrative across the economic landscape.
Consumer sentiment improved for the first time in four months as gas prices eased but remains historically low amid ongoing inflation concerns. The final June reading for the University of Michigan Consumer Sentiment Index came in at 49.5 marking a 10.5% (4.7 points) increase from April and beating the expected reading of 48.9.
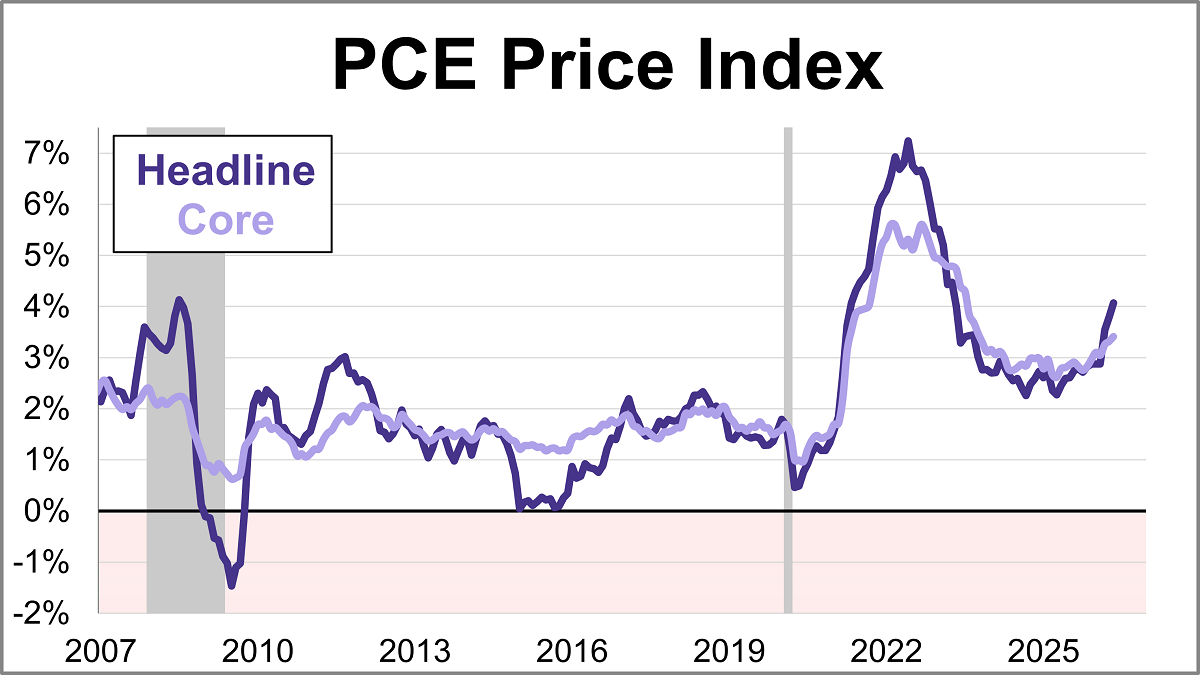
The Federal Reserve’s preferred inflation gauge, the core PCE price index, climbed 3.4% year-over-year in May. This marks the highest level since October 2023 and marks a pickup from April's 3.3% reading. On a monthly basis, core prices rose 0.3%.
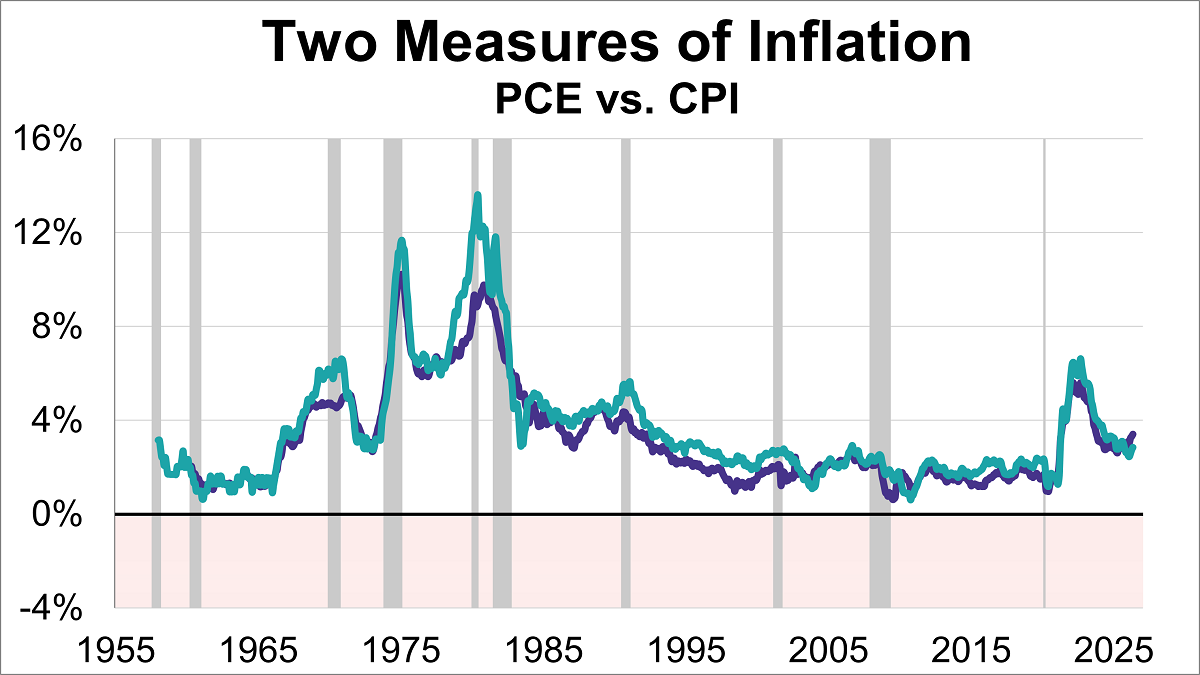
Inflation remains a hot topic, directly impacting everything from your grocery bill to interest rates. As of the latest data, two key inflation gauges — the Personal Consumption Expenditures (PCE) Price Index and the Consumer Price Index (CPI) — show that prices are still above the Federal Reserve's 2% target, with the core PCE at 3.4% and core CPI at 2.9%.
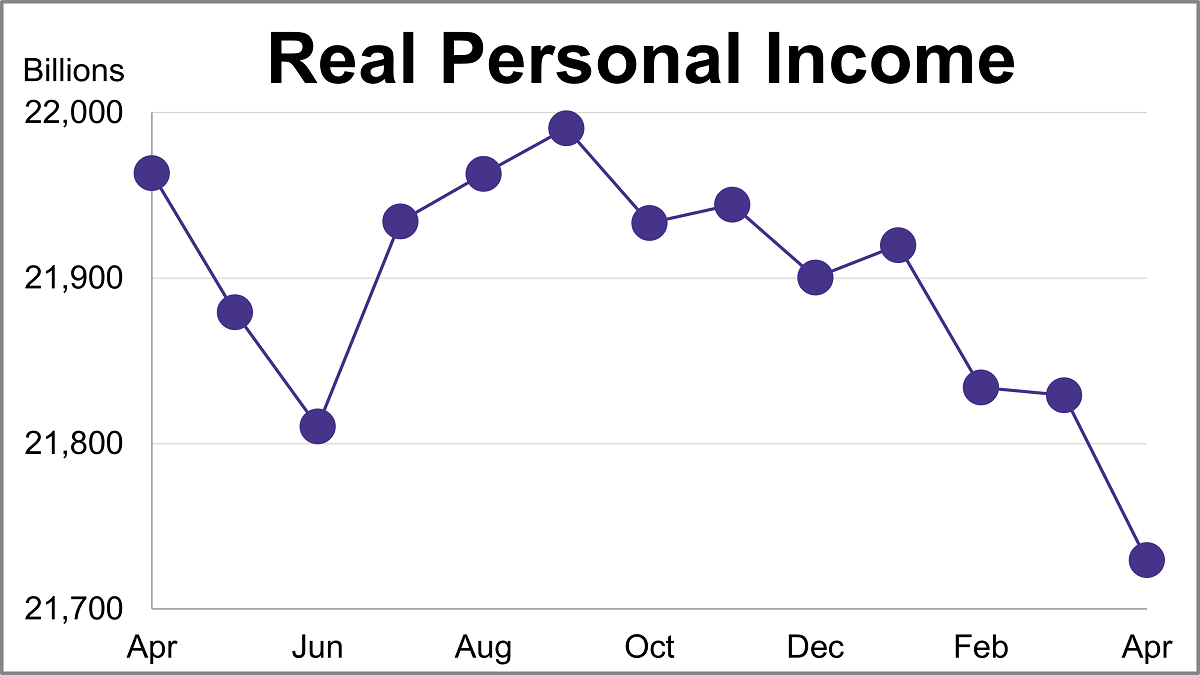
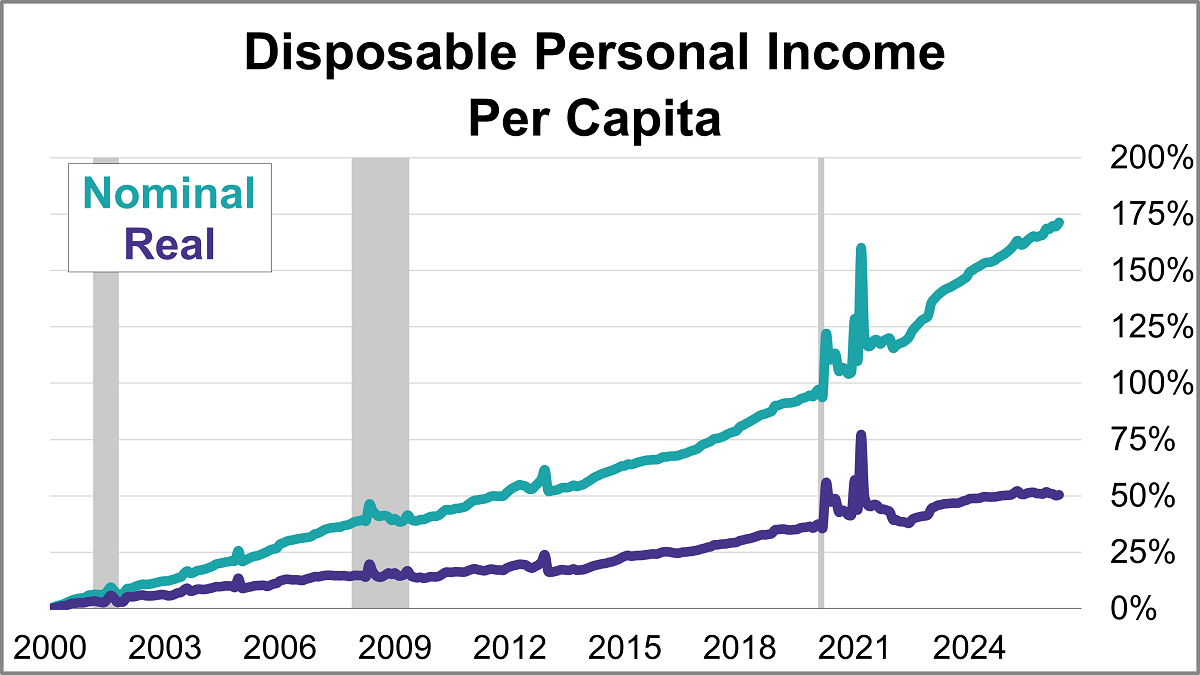
Personal income (excluding transfer receipts) was up 0.70% in May and was up 3.62% year-over-year. However, when adjusted for inflation using the BEA's PCE Price Index, real personal income (excluding transfer receipts) was up 0.25% month-over-month and down 0.43% year-over-year.
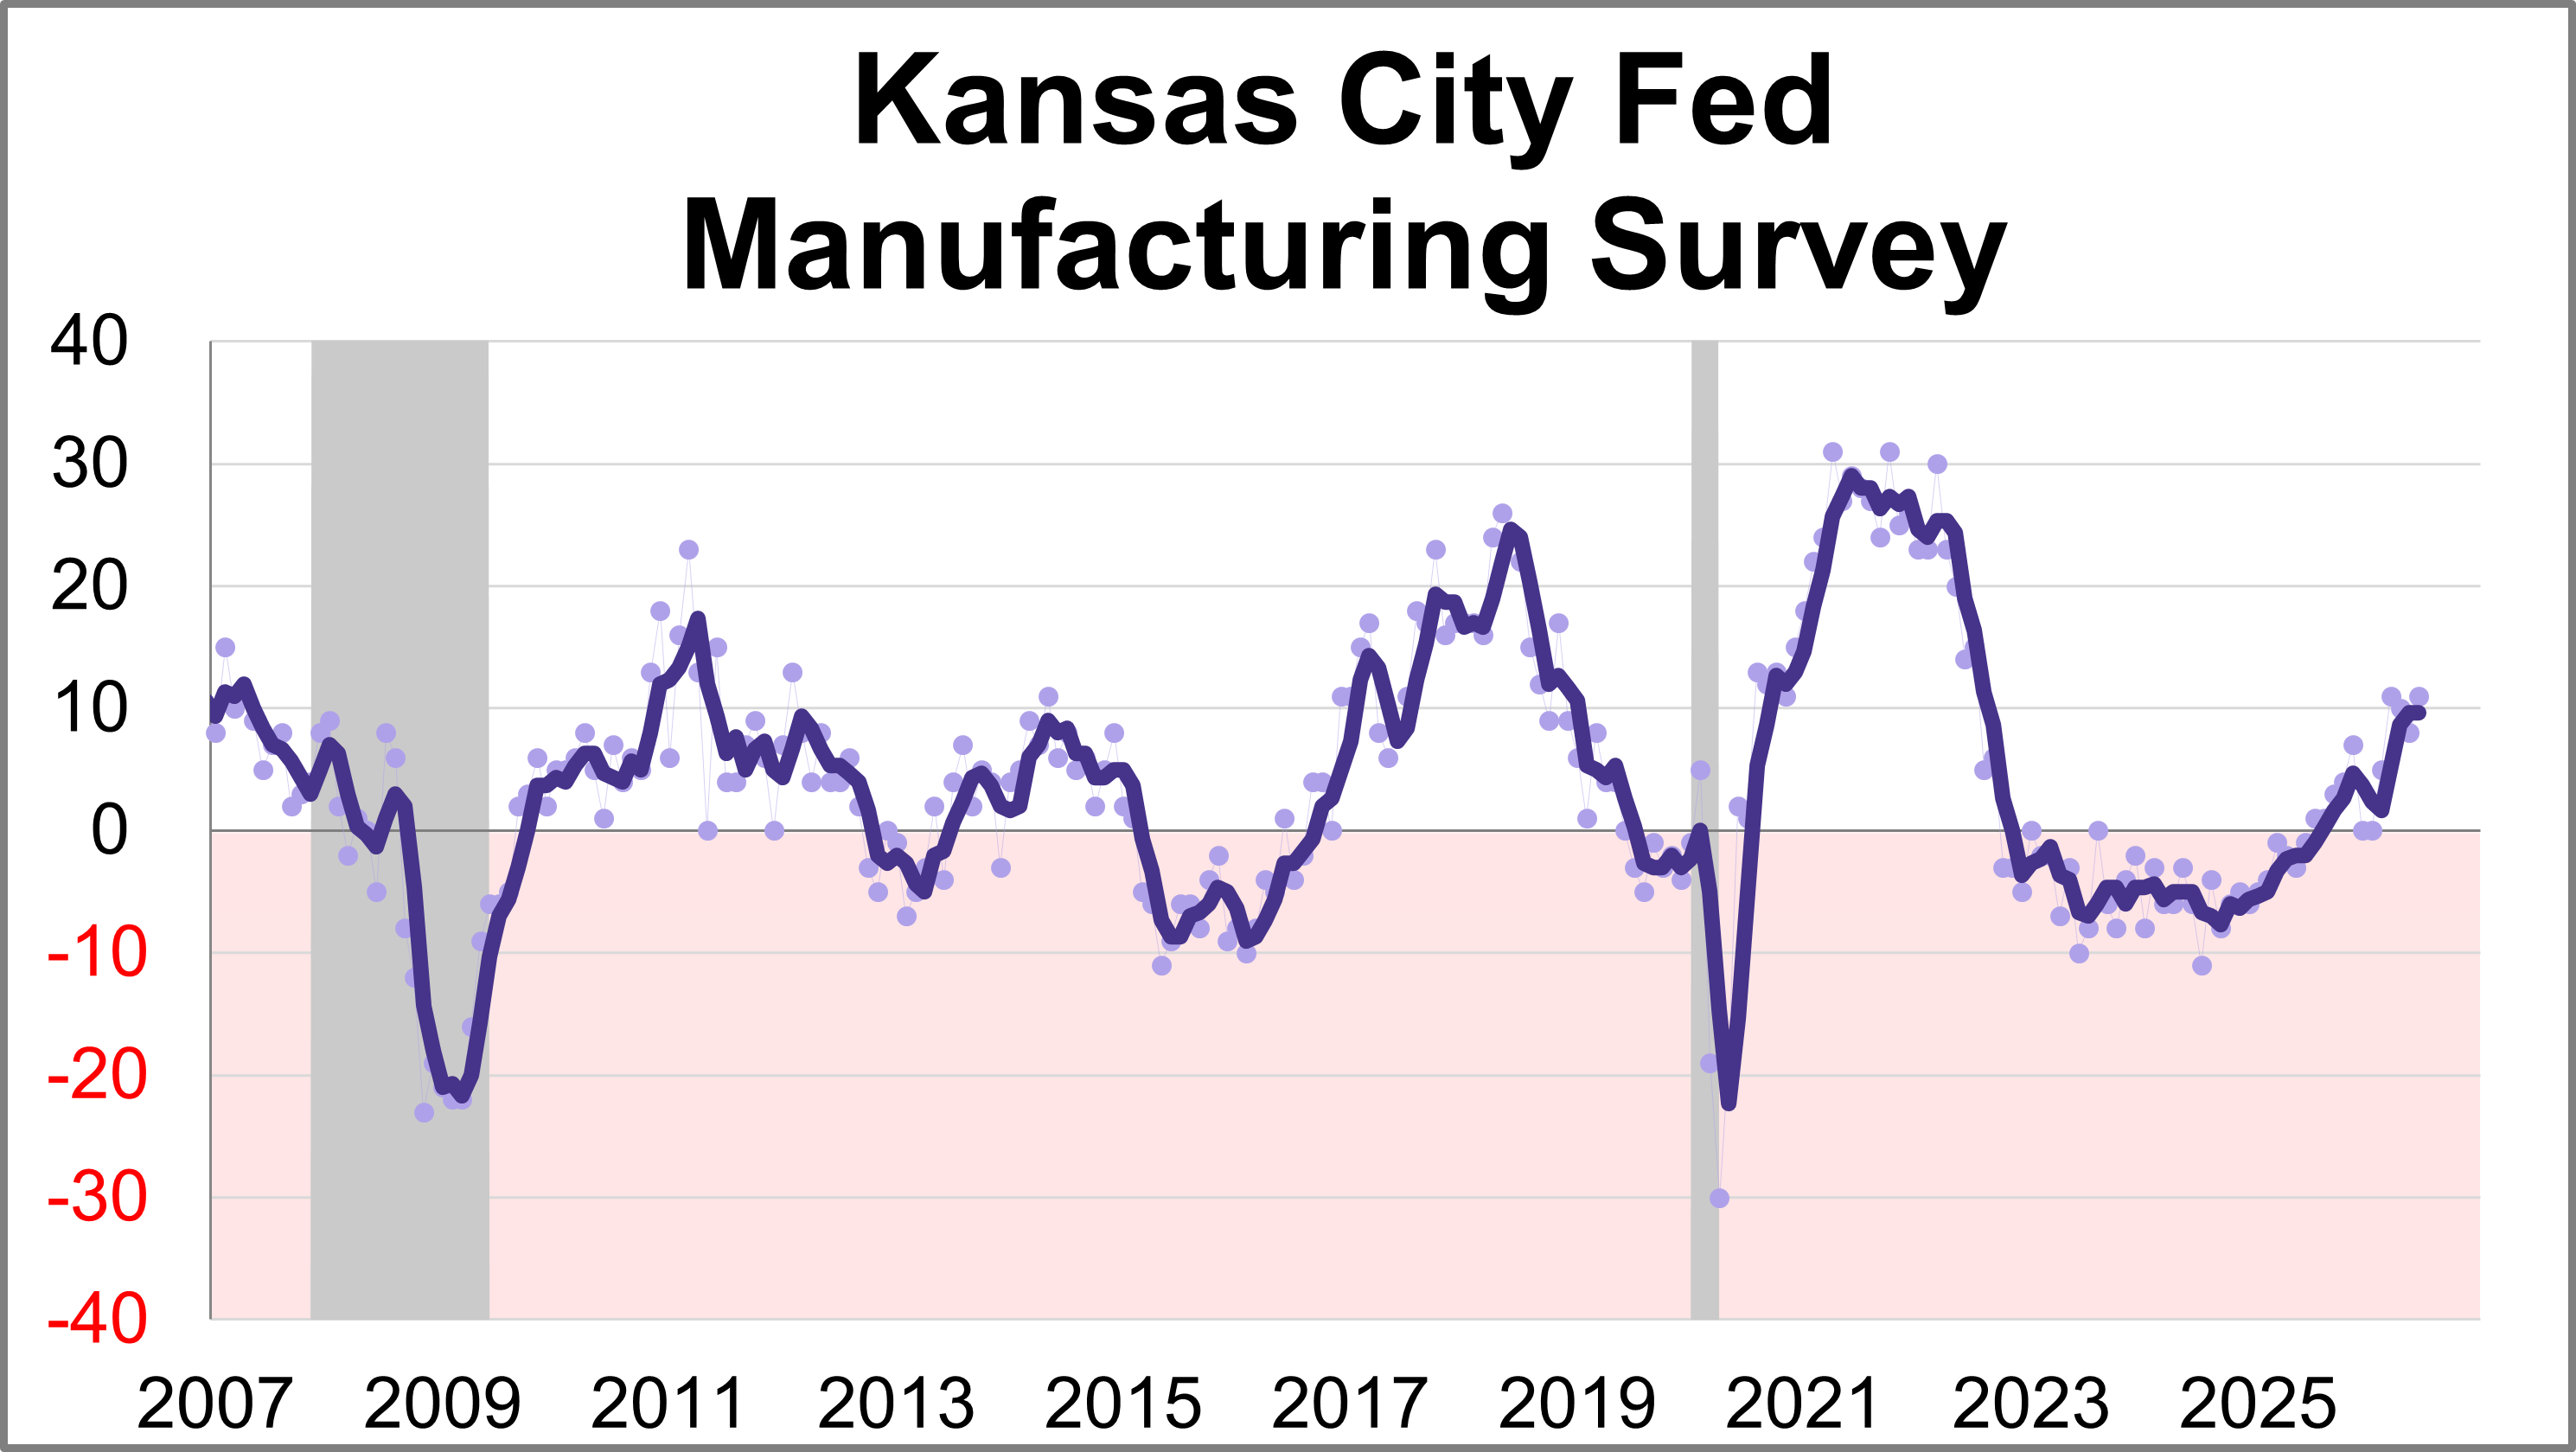
The Kansas City Fed Manufacturing Survey revealed regional activity continued to increase in May. The composite index came in at 8 this month, down slightly from 10 in April but still indicating continued expansion.
With the release of May's report on personal incomes and outlays, we can now take a closer look at "real" disposable personal income per capita. To two decimal places, disposable income per capita was up up 0.68% month-over-month. But when adjusted for inflation, real disposable income per capita was up 0.23%.
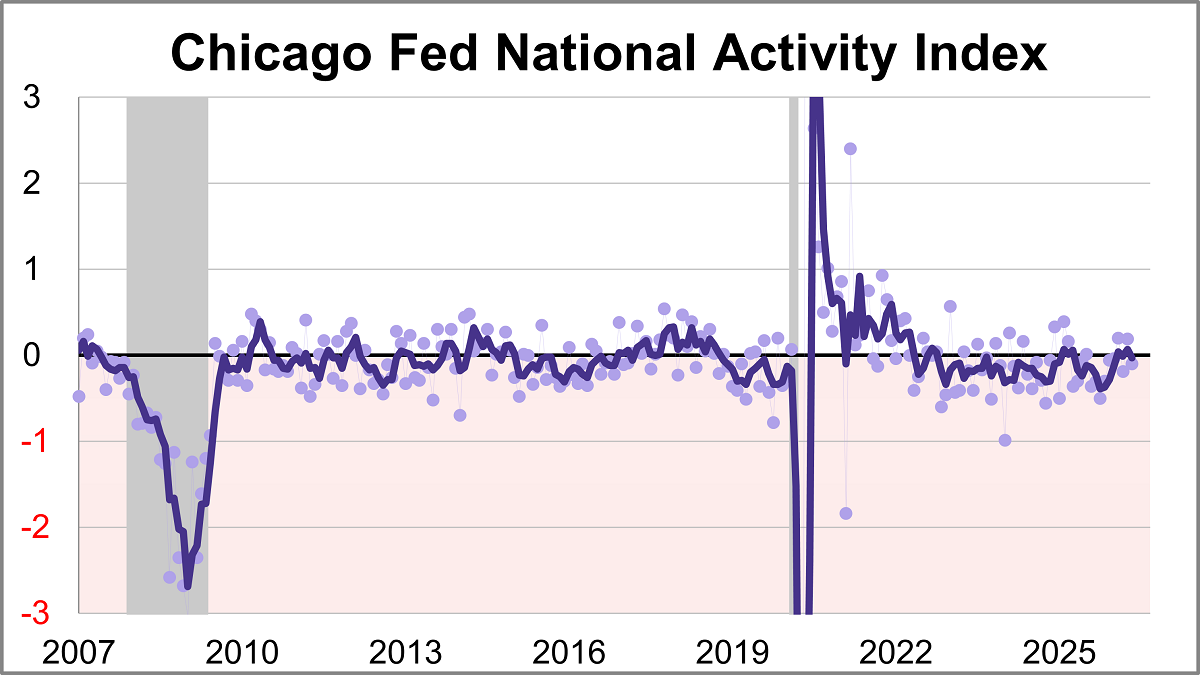
The Chicago Fed National Activity Index (CFNAI) fell to -0.10 in May from +0.19 in April. Two of the four broad categories of indicators used to construct the index decreased from April, and three categories made negative contributions.
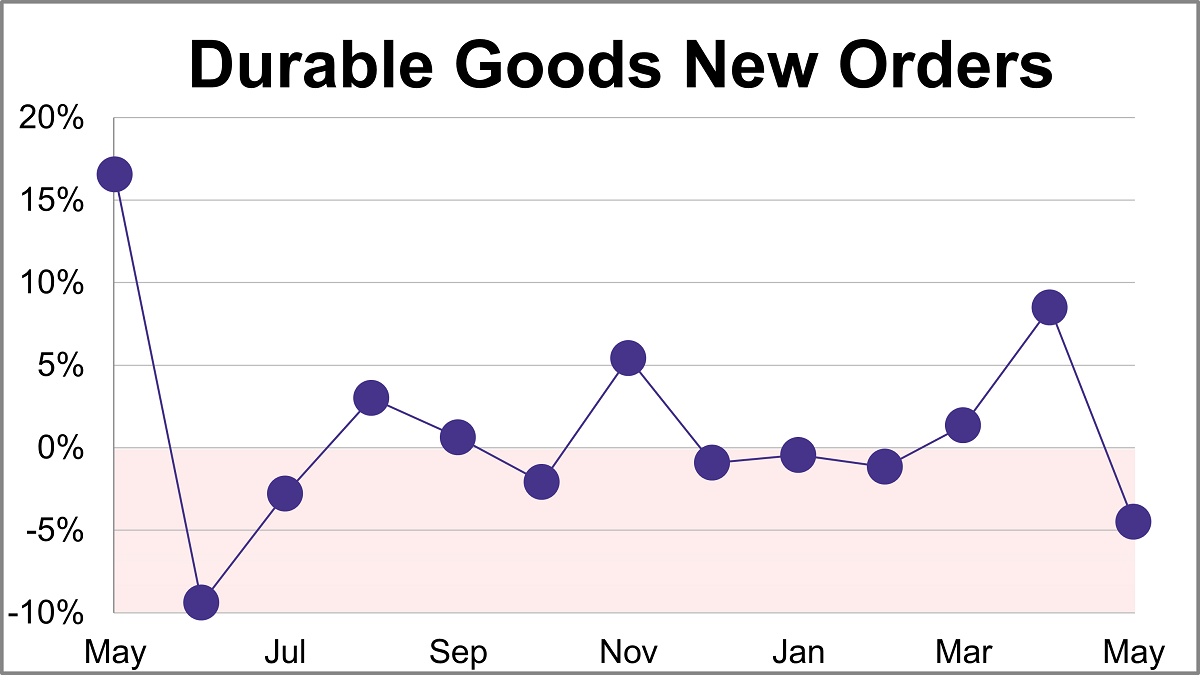
New orders for manufactured durable goods sank 4.5% in May to $332.05B, slightly less than the projected 5.0% monthly decline.
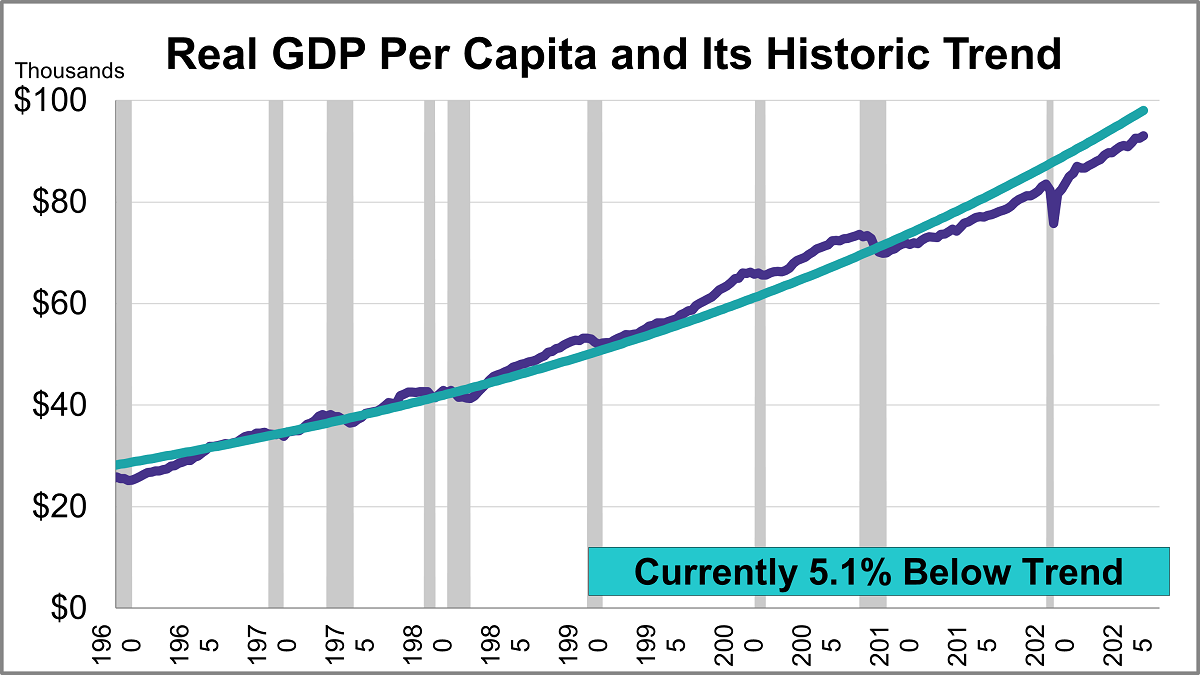
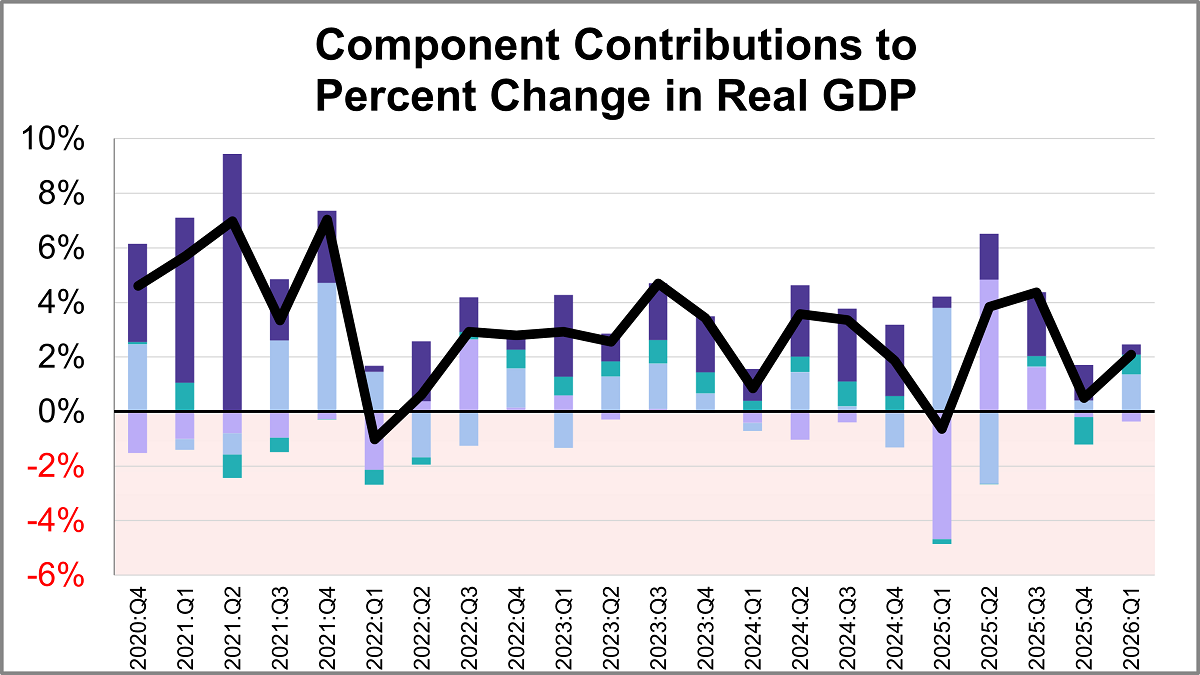
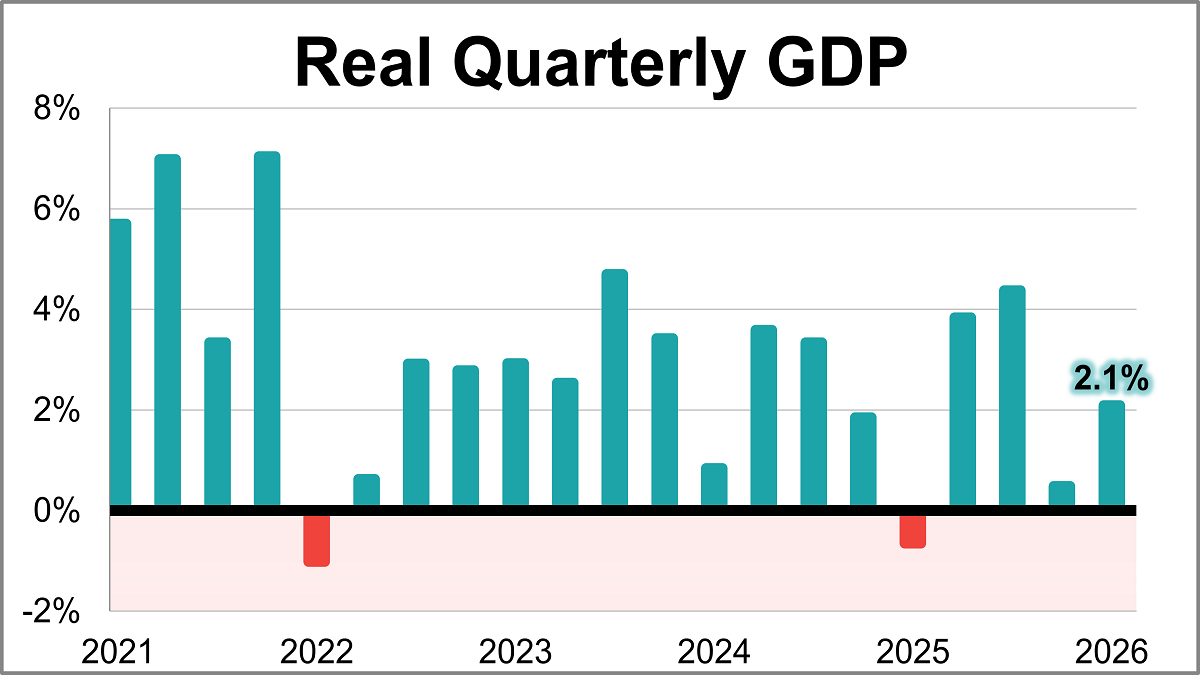
The third estimate for Q1 GDP came in at 2.09%, an acceleration from 0.48% for the Q4 final estimate. With a per-capita adjustment, the headline number is lower at 1.91%, a pickup from 0.18% for the Q4 headline number.
Real gross domestic product (GDP) is comprised of four major subcomponents. In the Q1 2026 GDP third estimate, three of the four components made positive contributions.
U.S. economic growth rebounded at the beginning of 2026, according to the BEA’s latest estimate. Real GDP rose at a 2.1% annual rate in Q1, exceeding the 1.6% forecast and marking a sharp acceleration from the 0.5% final estimate seen in Q4 of last year.
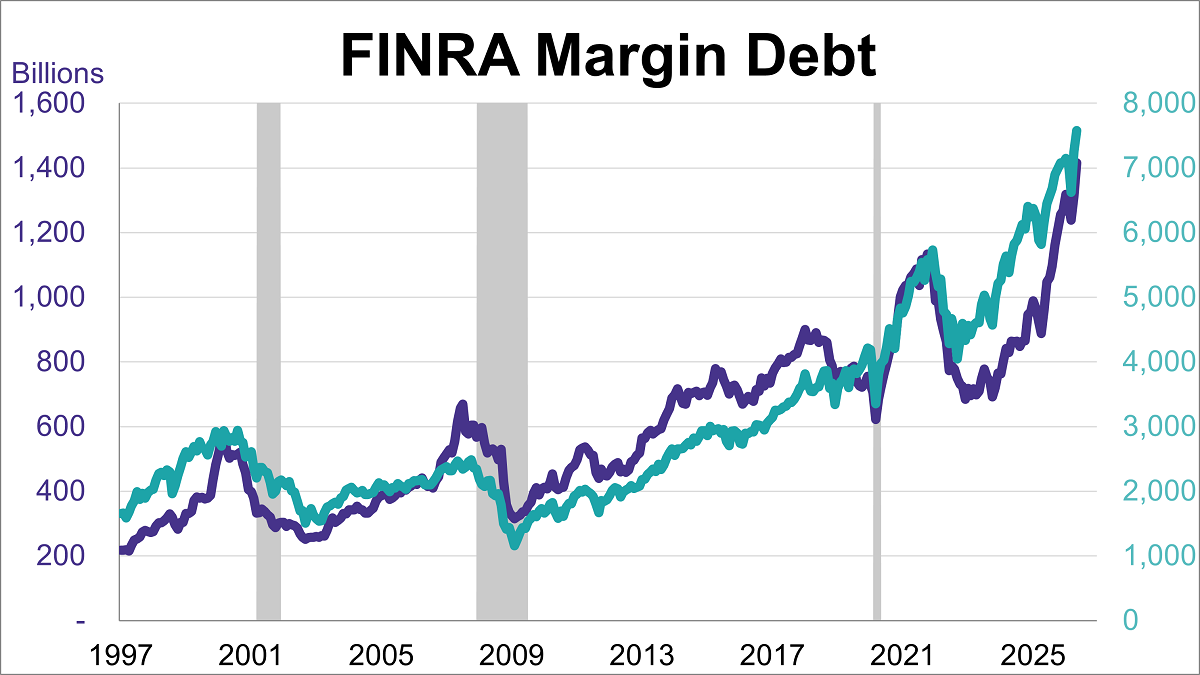
Margin debt rose for a second straight month in May, reaching a new record high of $1.42 trillion. This marked an 8.5% increase from April and a 53.7% rise compared to the previous year.
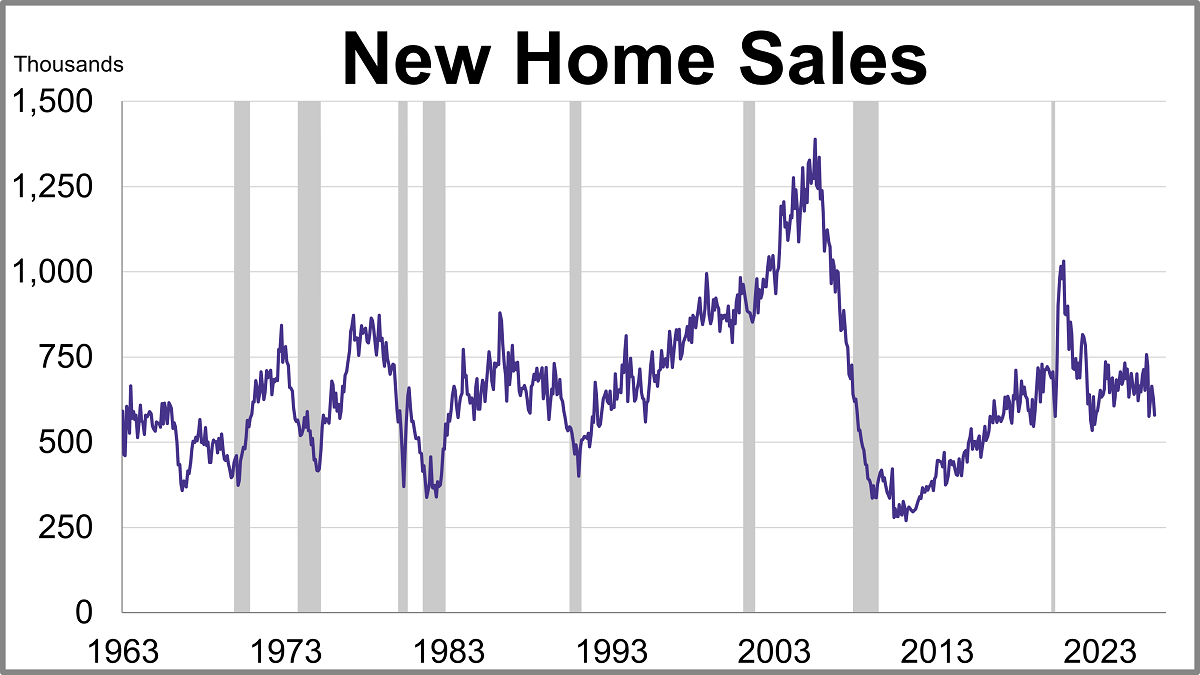
New home sales fell more than expected in May while the median price rose for a second straight month.
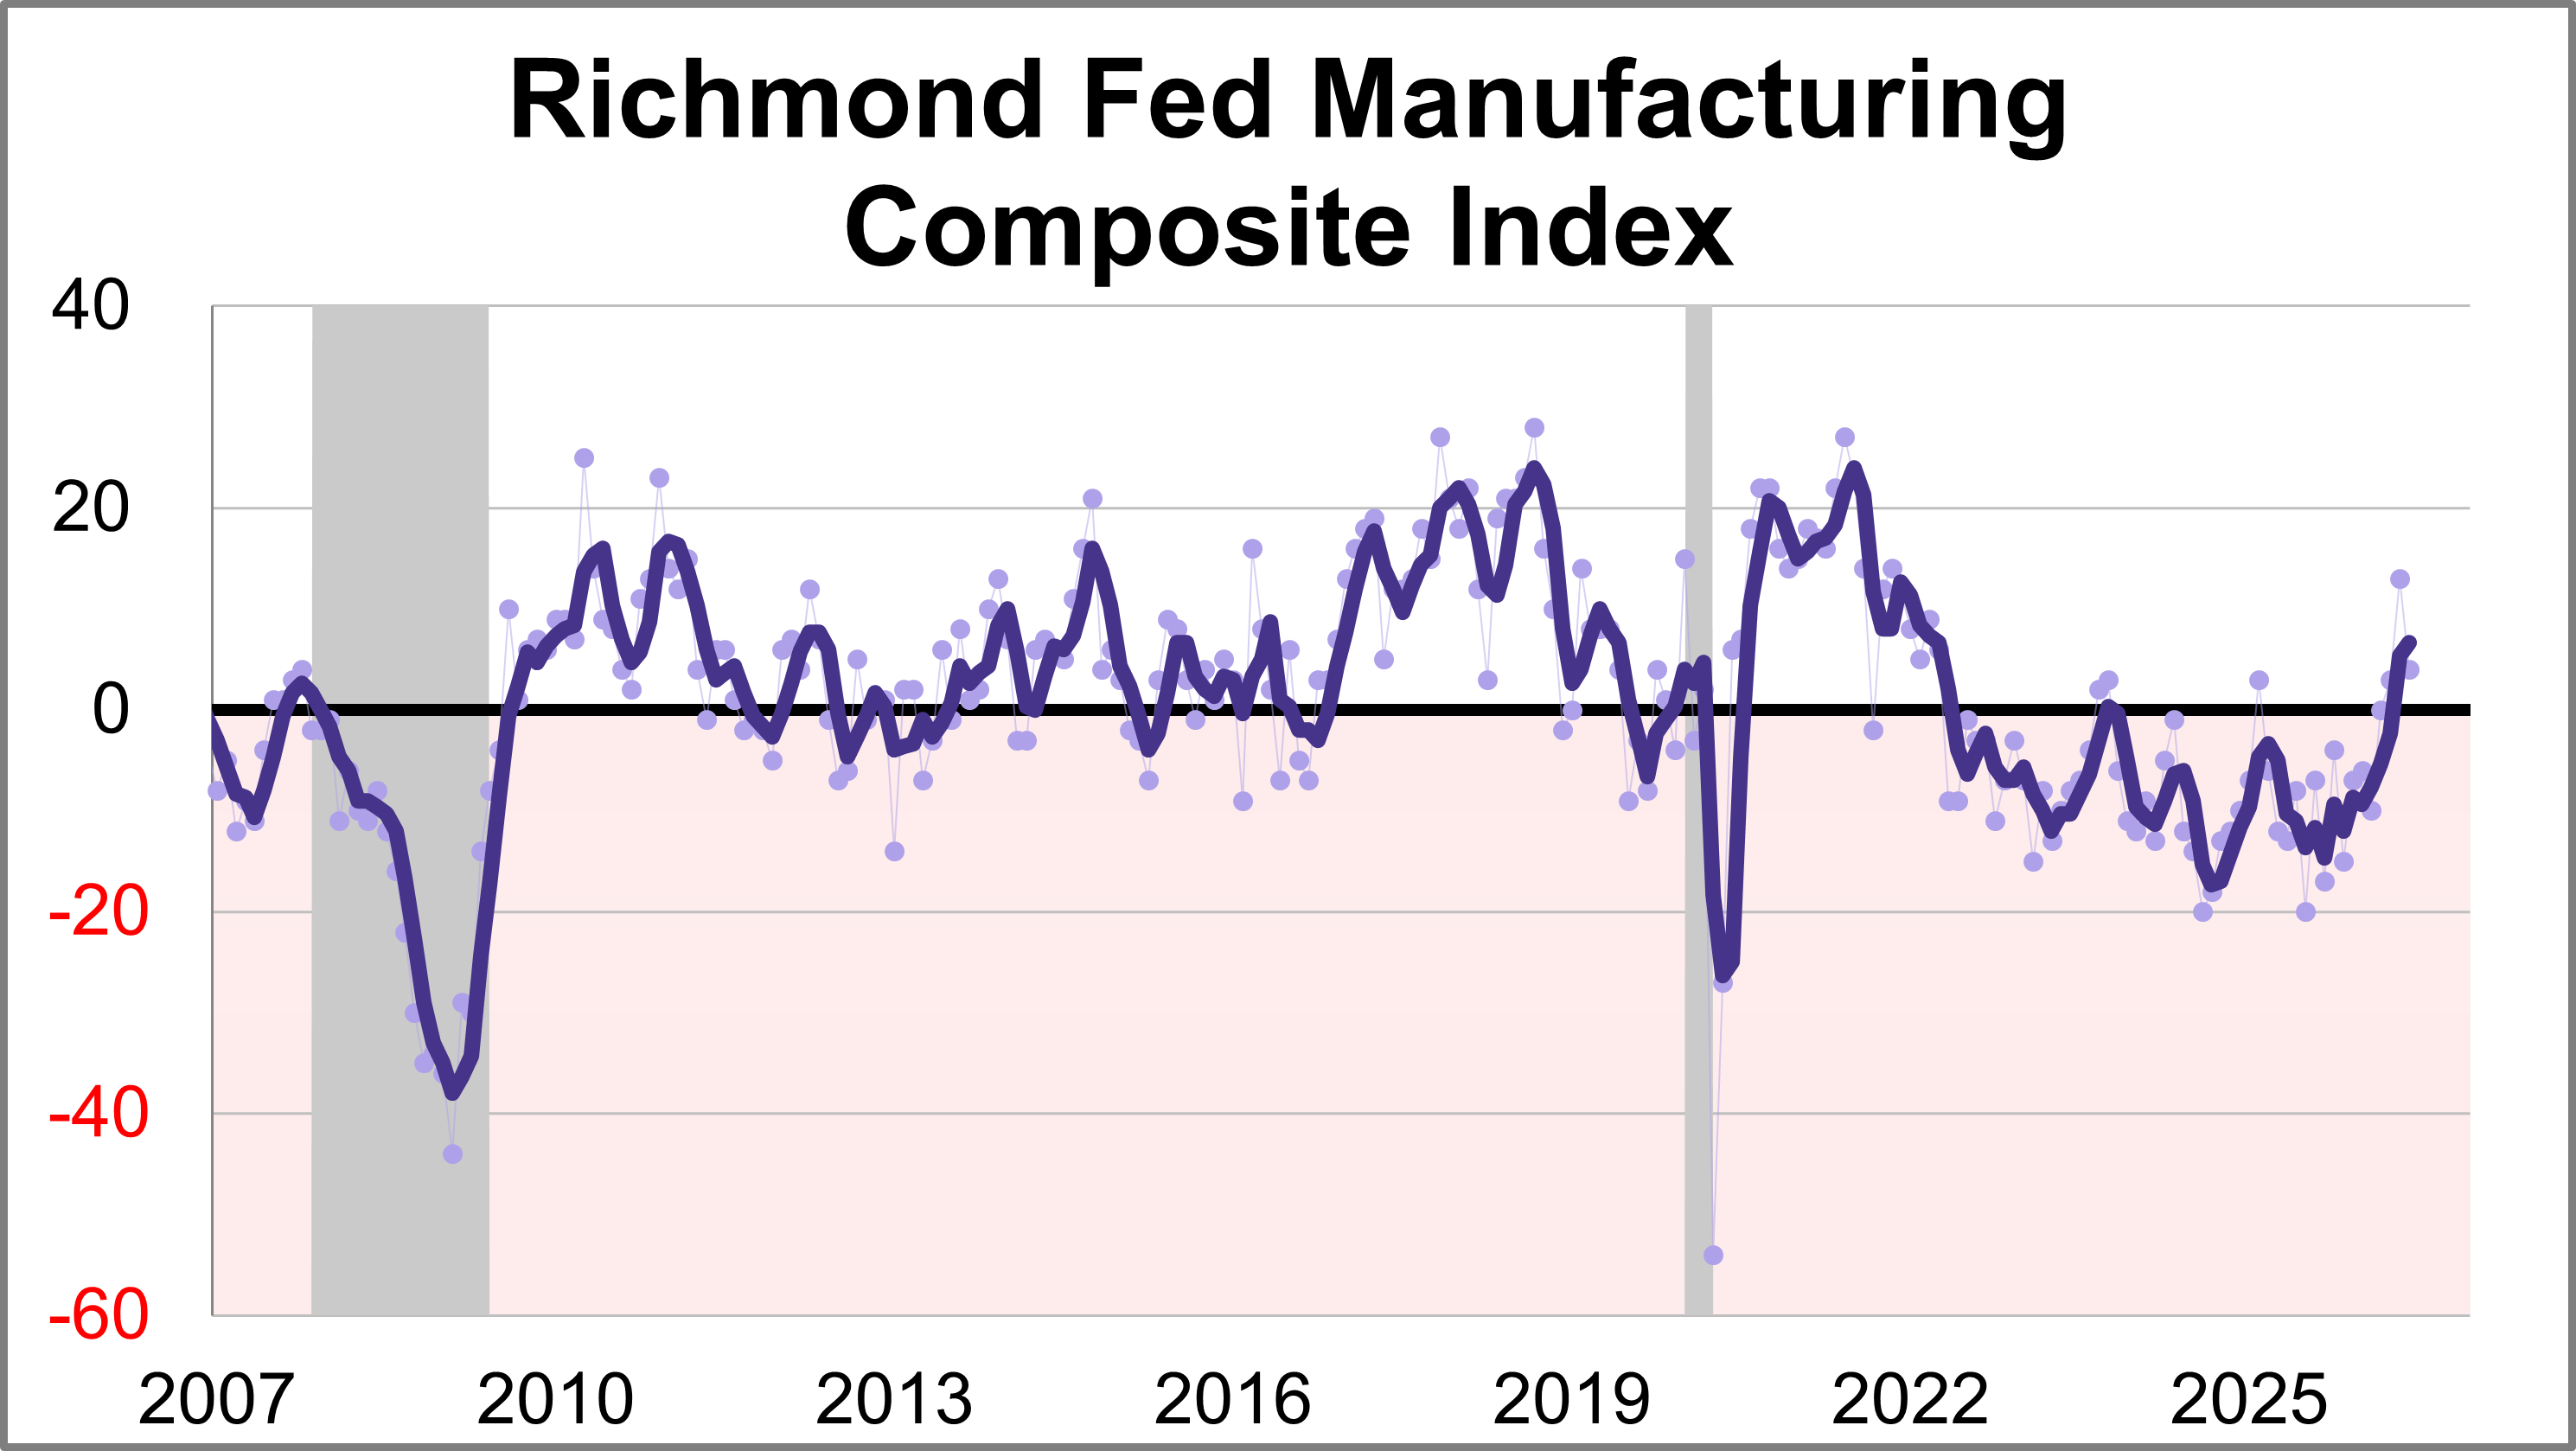
Fifth district manufacturing activity was flat in June, according to the most recent survey from the Federal Reserve Bank of Richmond. The composite manufacturing index fell nine points points to 4, marking the third consecutive positive reading. This month's reading was below the forecast of 8.
As the summer economic landscape takes shape, investors are navigating shifting monetary policy, stubborn inflation pressures, and unexpected market momentum. This week’s snapshot breaks down the most critical updates and data releases from the past week to give you a clear view of where the economy is heading.
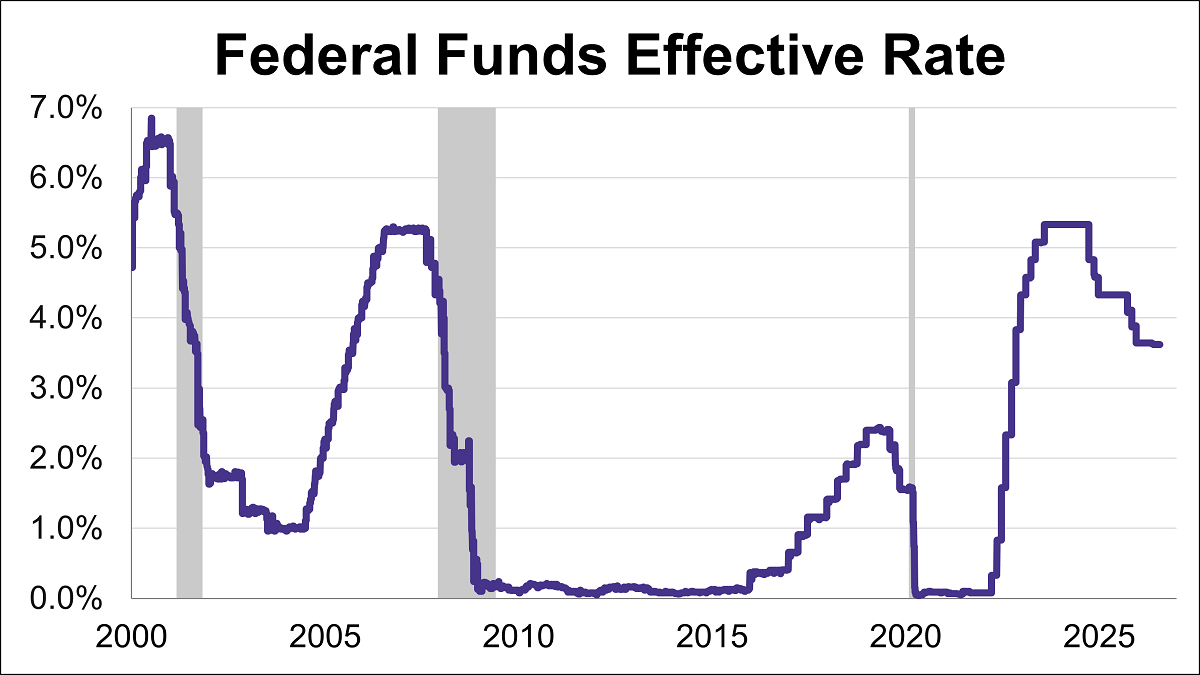
The Federal Reserve concluded its fourth meeting of the year by holding the federal funds rate (FFR) steady in the 3.50%-3.75% range.
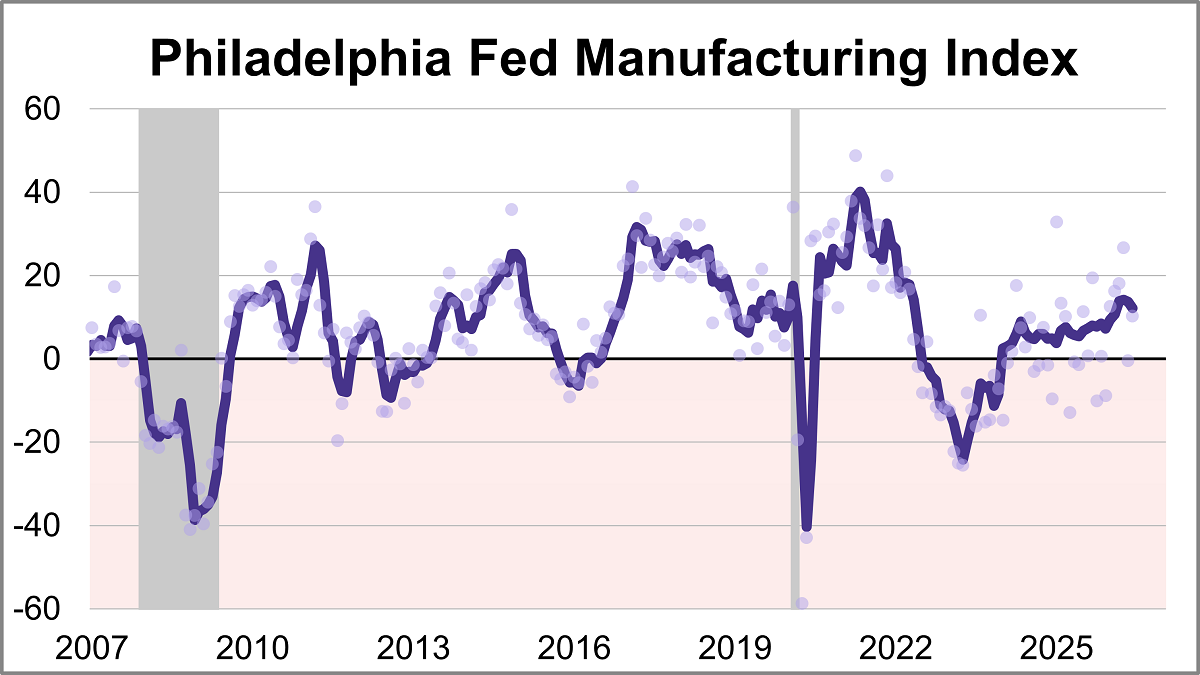
The latest Philadelphia Fed manufacturing index showed activity rebounded in June, with the index rising 10.7 points to 10.3. The latest reading marks the fifth positive reading in the past six months and was better than the forecast of 9.8.
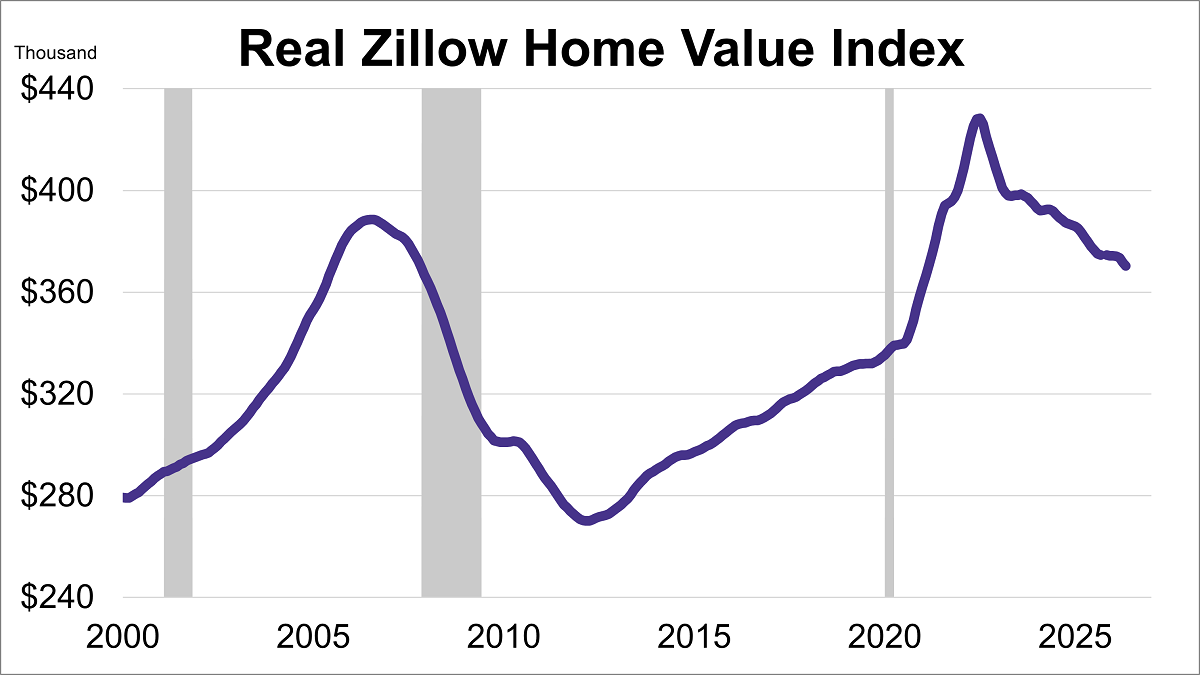
Home values fell for the first time in nine months in May, according to the Zillow Home Value Index. Additionally, after adjusting for inflation, real home values dropped even more sharply, remaining at their lowest level in over five years.
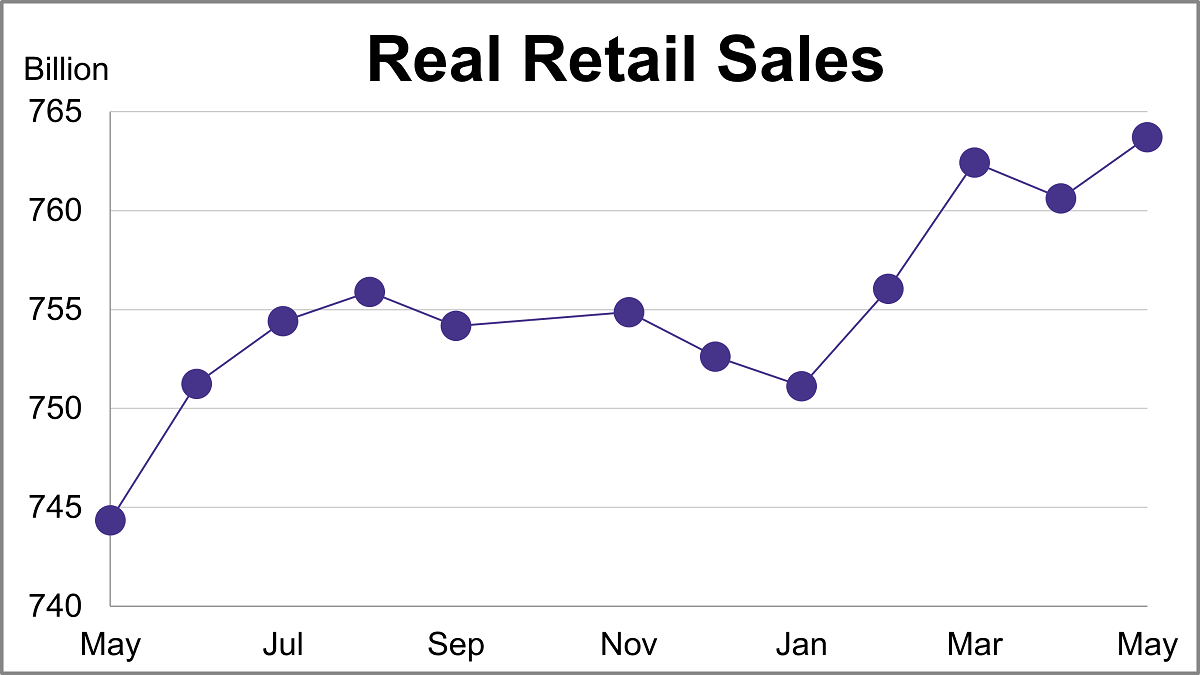
Nominal retail sales were up 0.88% month-over-month and up 6.88% year-over-year in May. However, after adjusting for inflation, real retail sales were up 0.41% month-over-month and up 2.60% year-over-year.
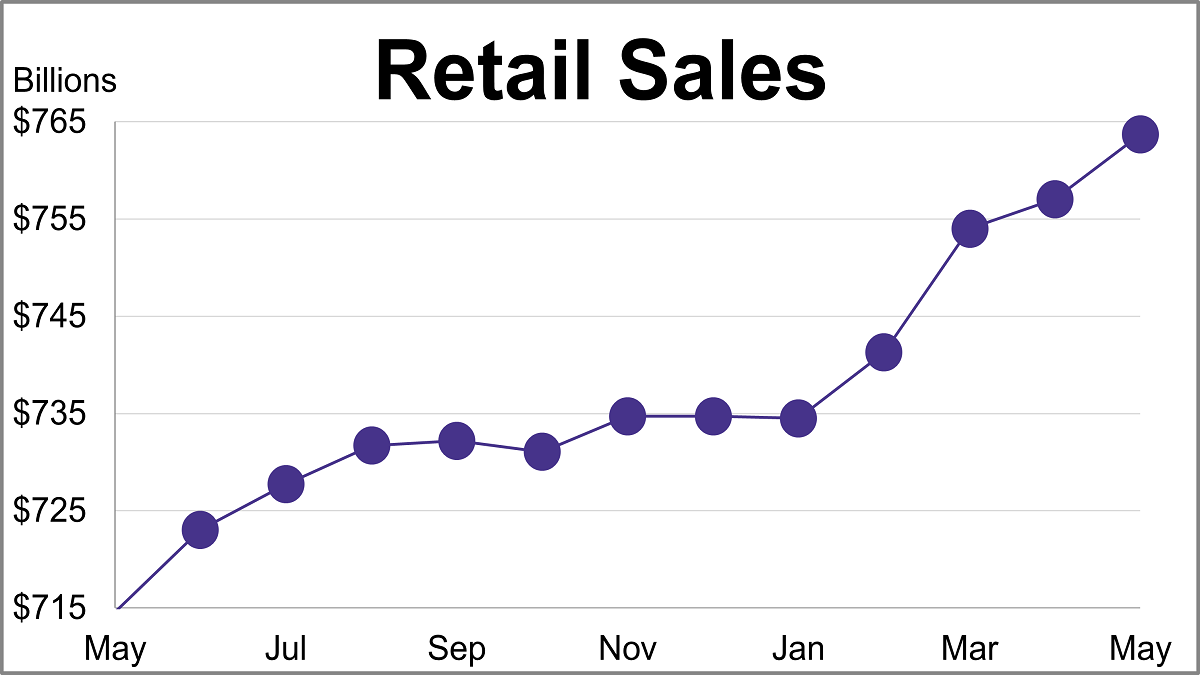
According to the Census Bureau’s Advance Retail Sales Report, consumer spending climbed for the fourth straight month in May. Headline sales rose 0.9%, almost double the projected 0.5% growth and marking an acceleration from April's 0.4% rise.
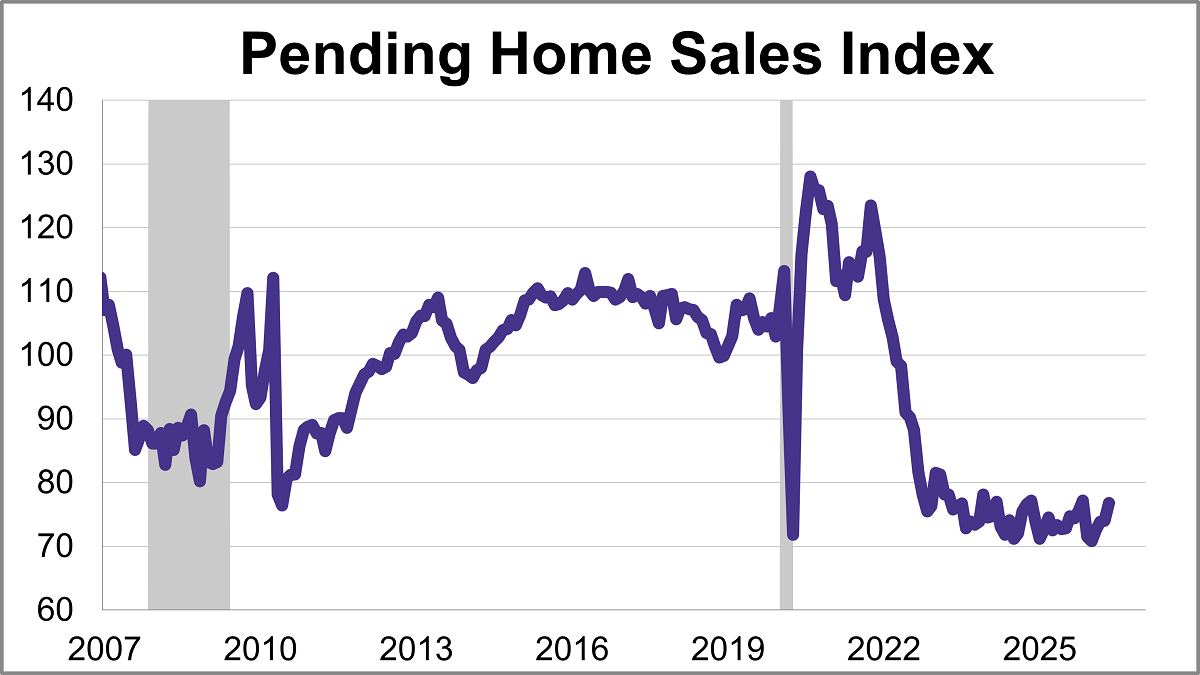
The National Association of Realtors® (NAR) pending home sales index jumped 3.8% in May to 76.8, marking its fourth consecutive monthly gain and highest level in six months.
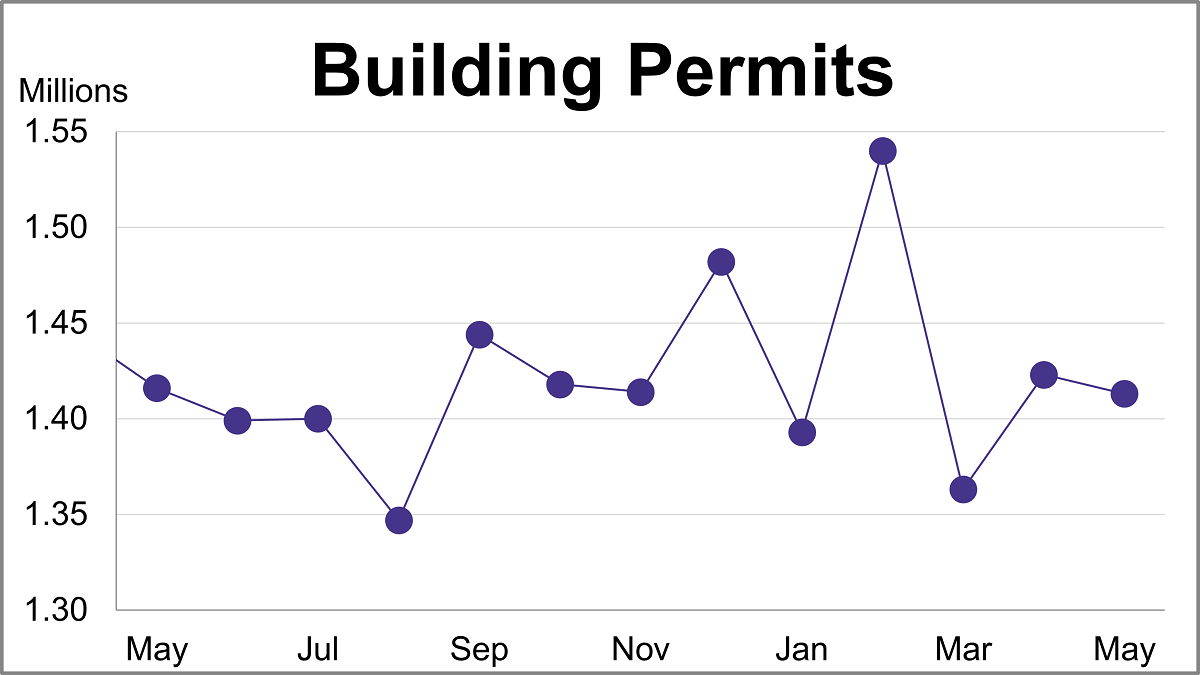
Building permits inched down 0.7% to a seasonally adjusted annual rate of 1.413 million in May. The latest reading missed the forecast of 1.420 million.
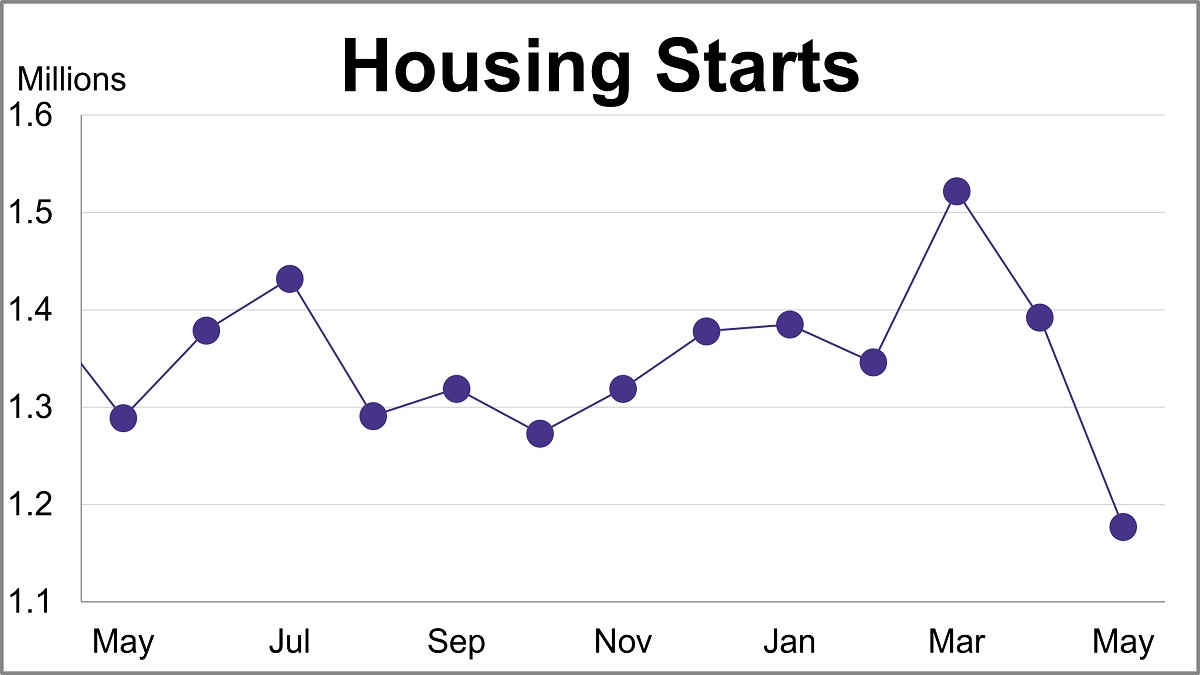
Housing starts sank 15.4% in May to a seasonally adjusted annual rate of 1.177 million, the lowest level in six years. The latest reading was significantly lower than the projected 1.430 million.
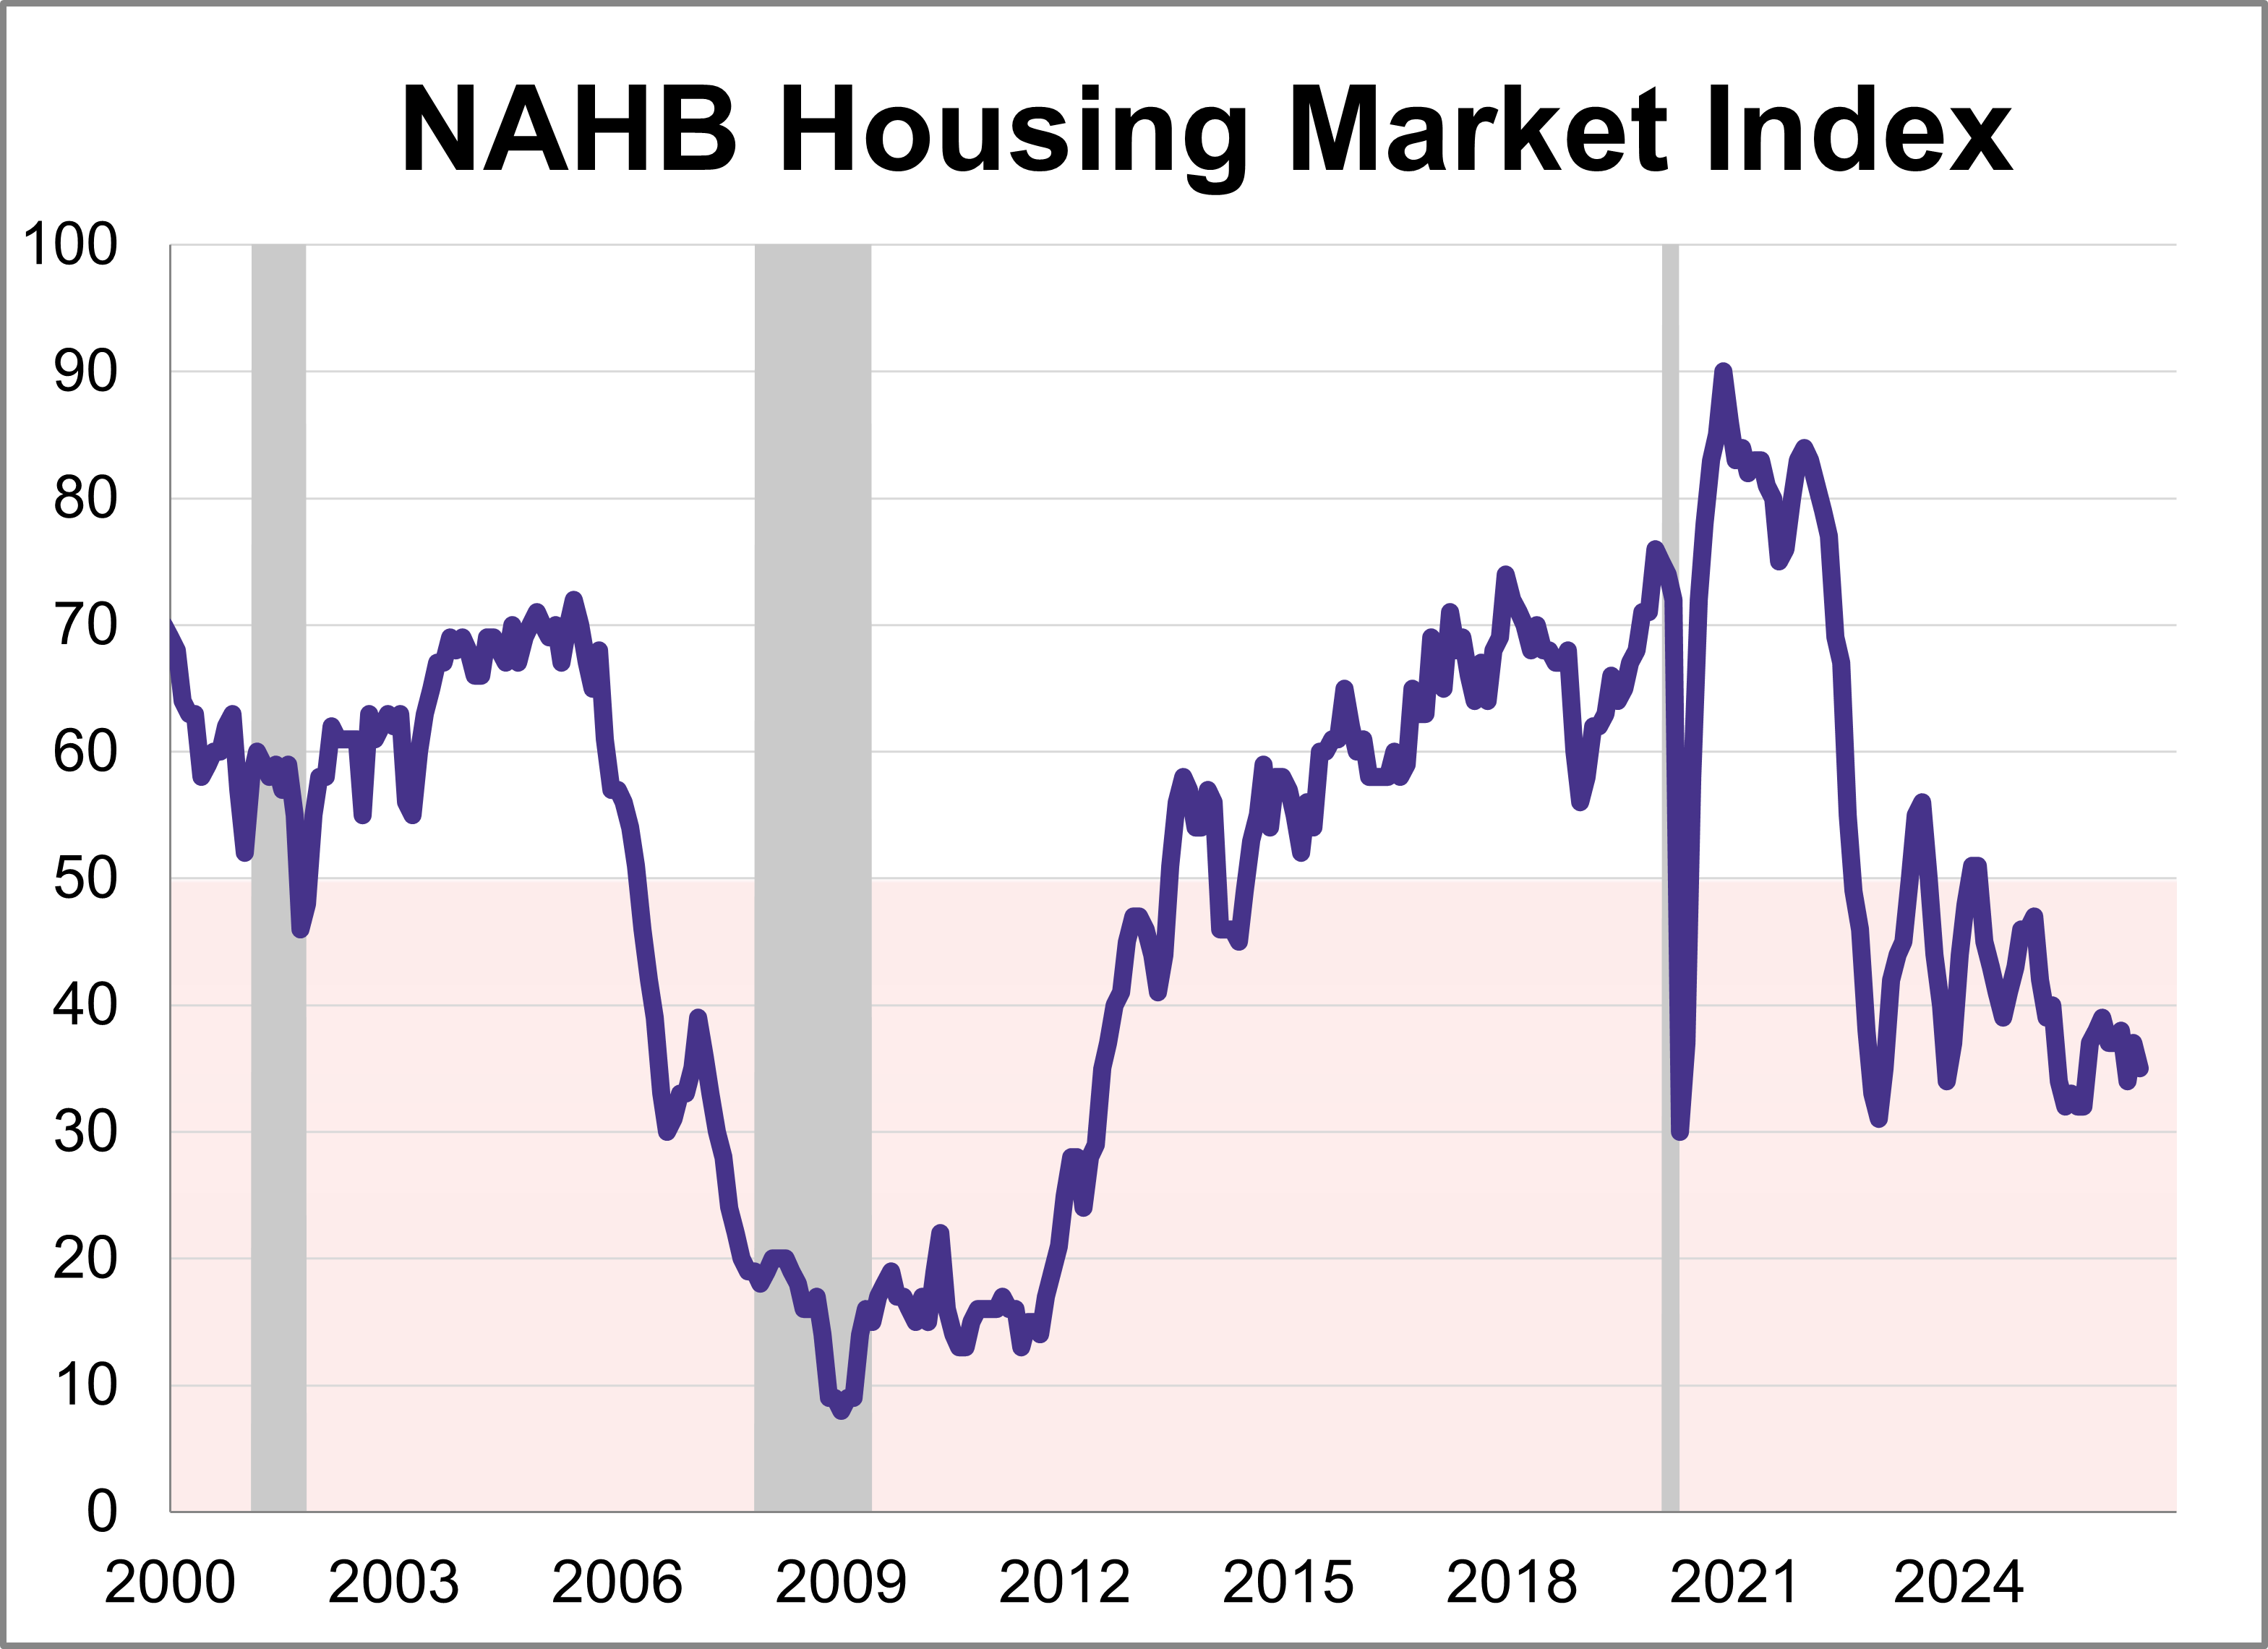
Builder confidence edged lower in June as ongoing affordability challenges continue to affect the housing market. The National Association of Home Builders (NAHB) Housing Market Index (HMI) fell 2 points from May to 35 this month, marking the 26th consecutive negative reading.
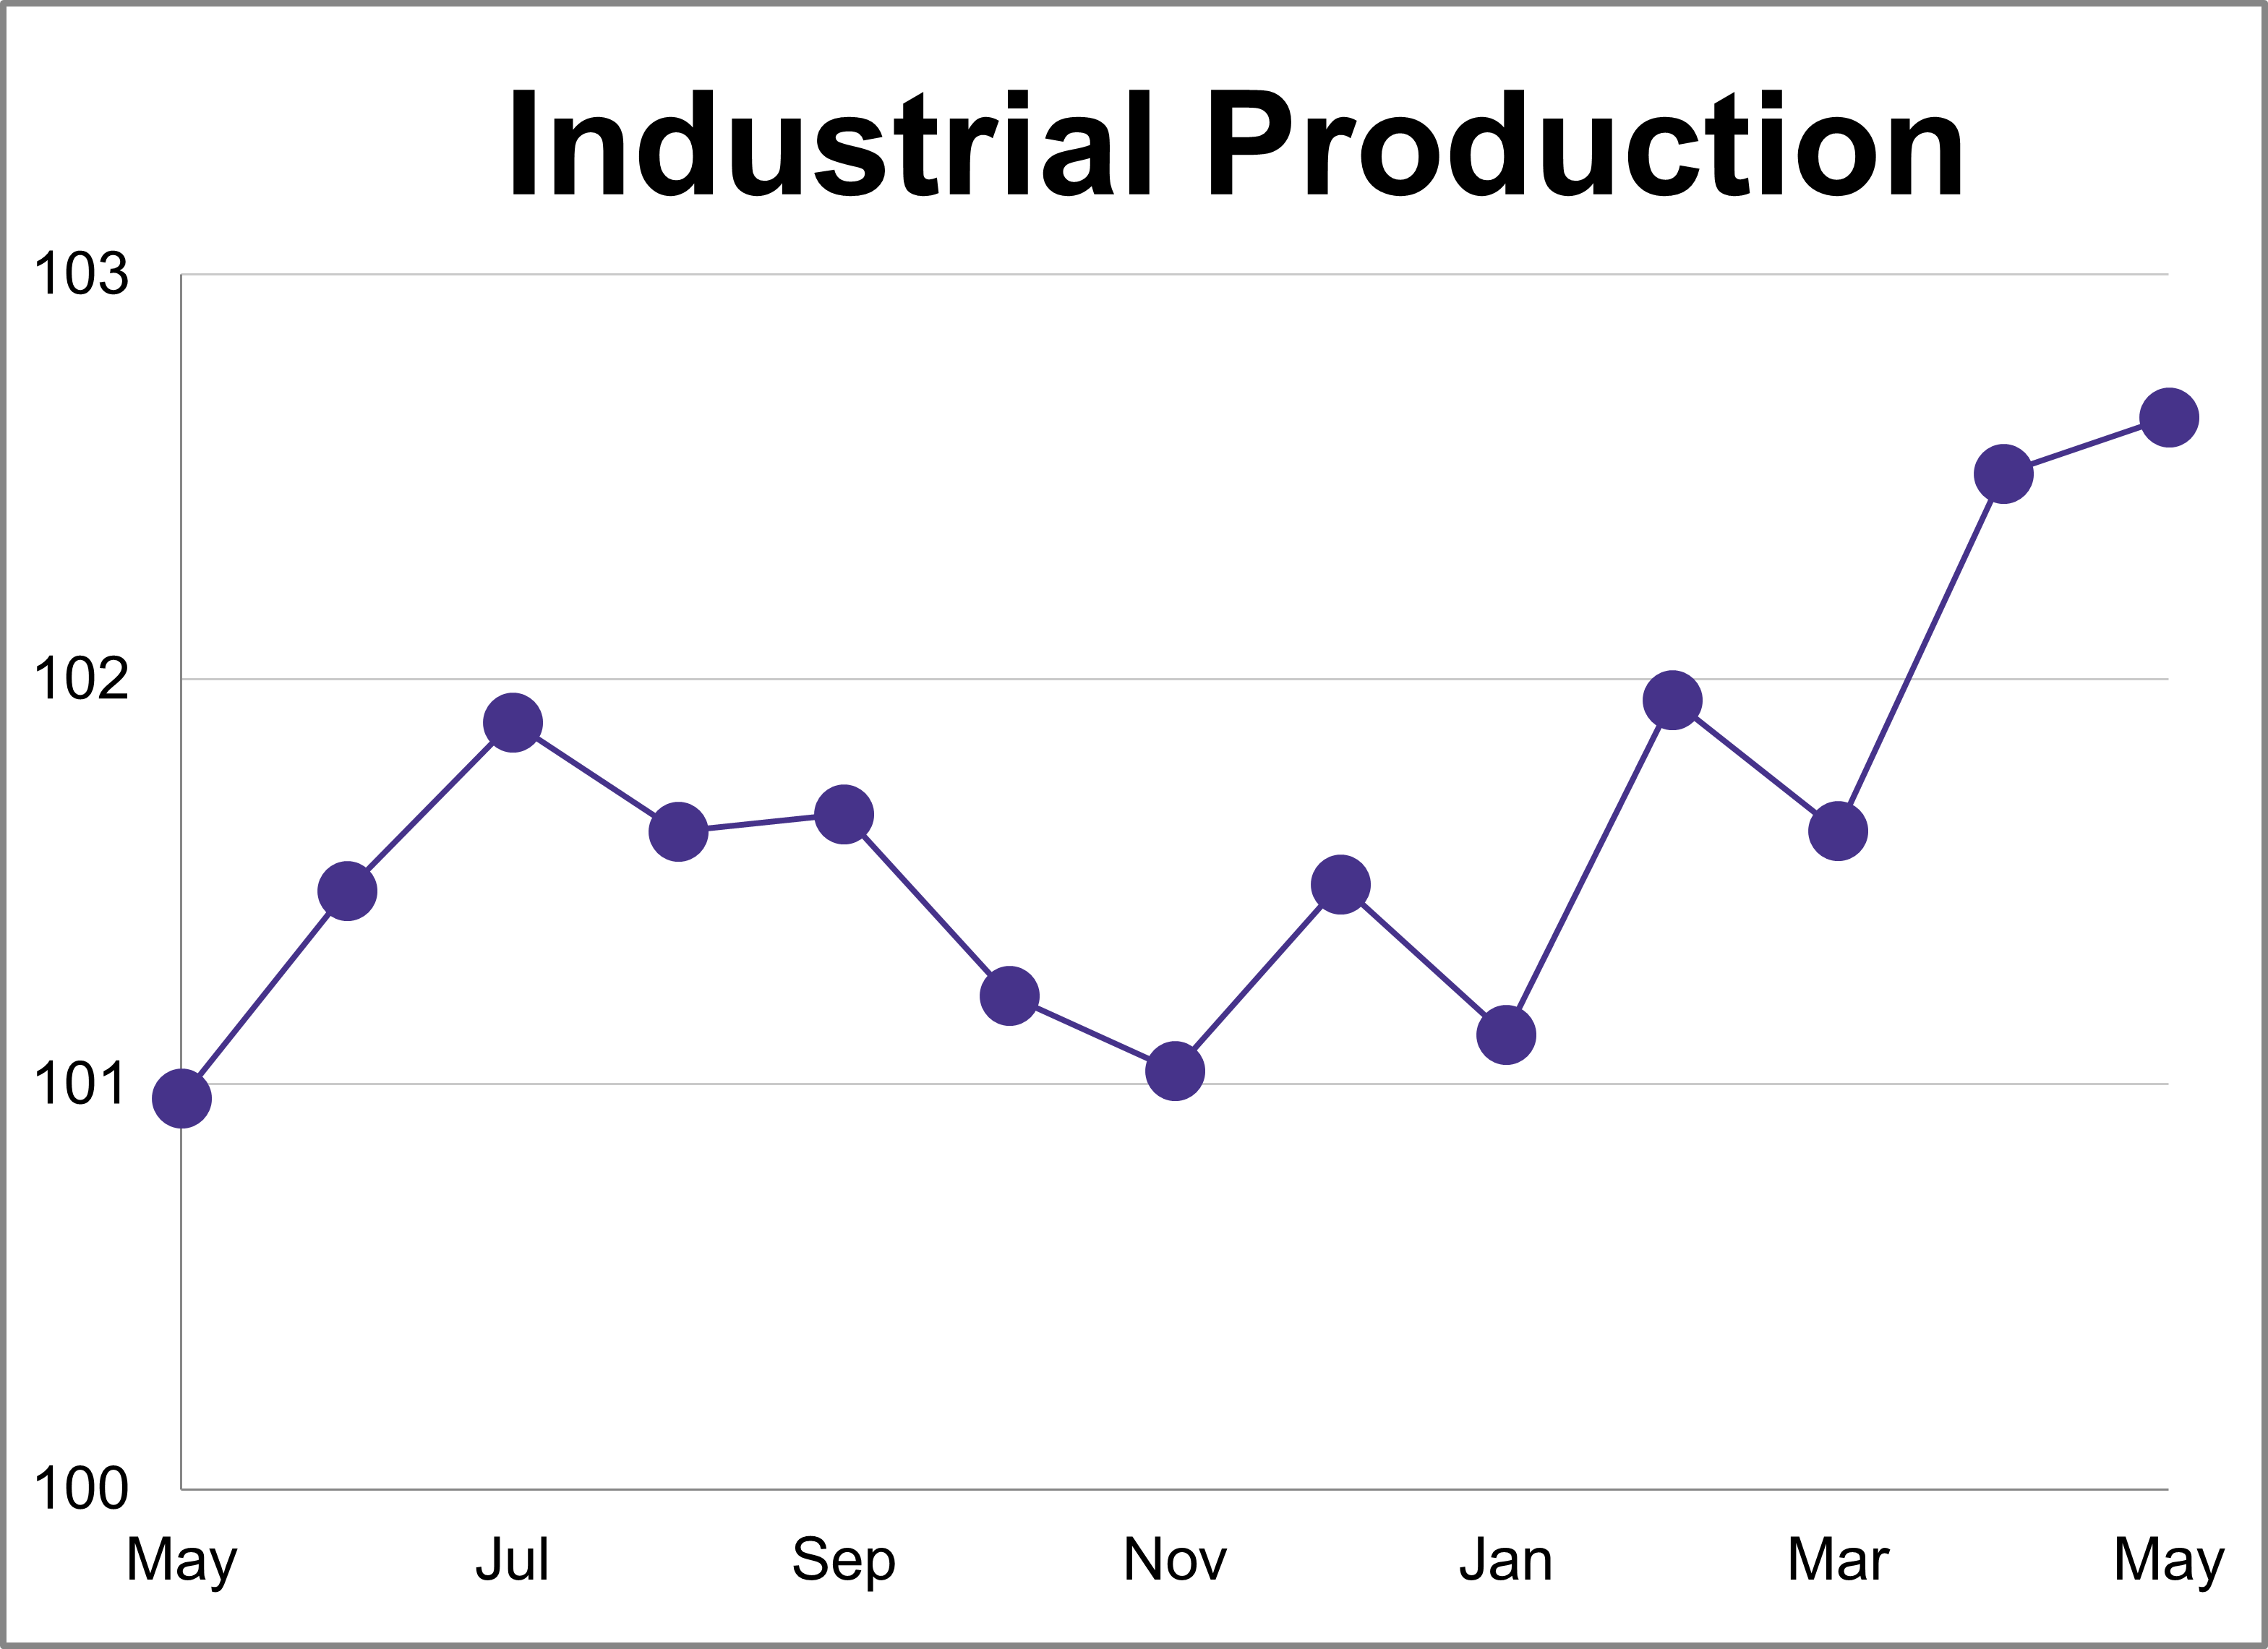
Industrial production rose less than expected in May, increasing 0.1% after a 0.9% jump in April. This was lower than the expected 0.3% growth and marks a 1.7% increase compared to one year ago.
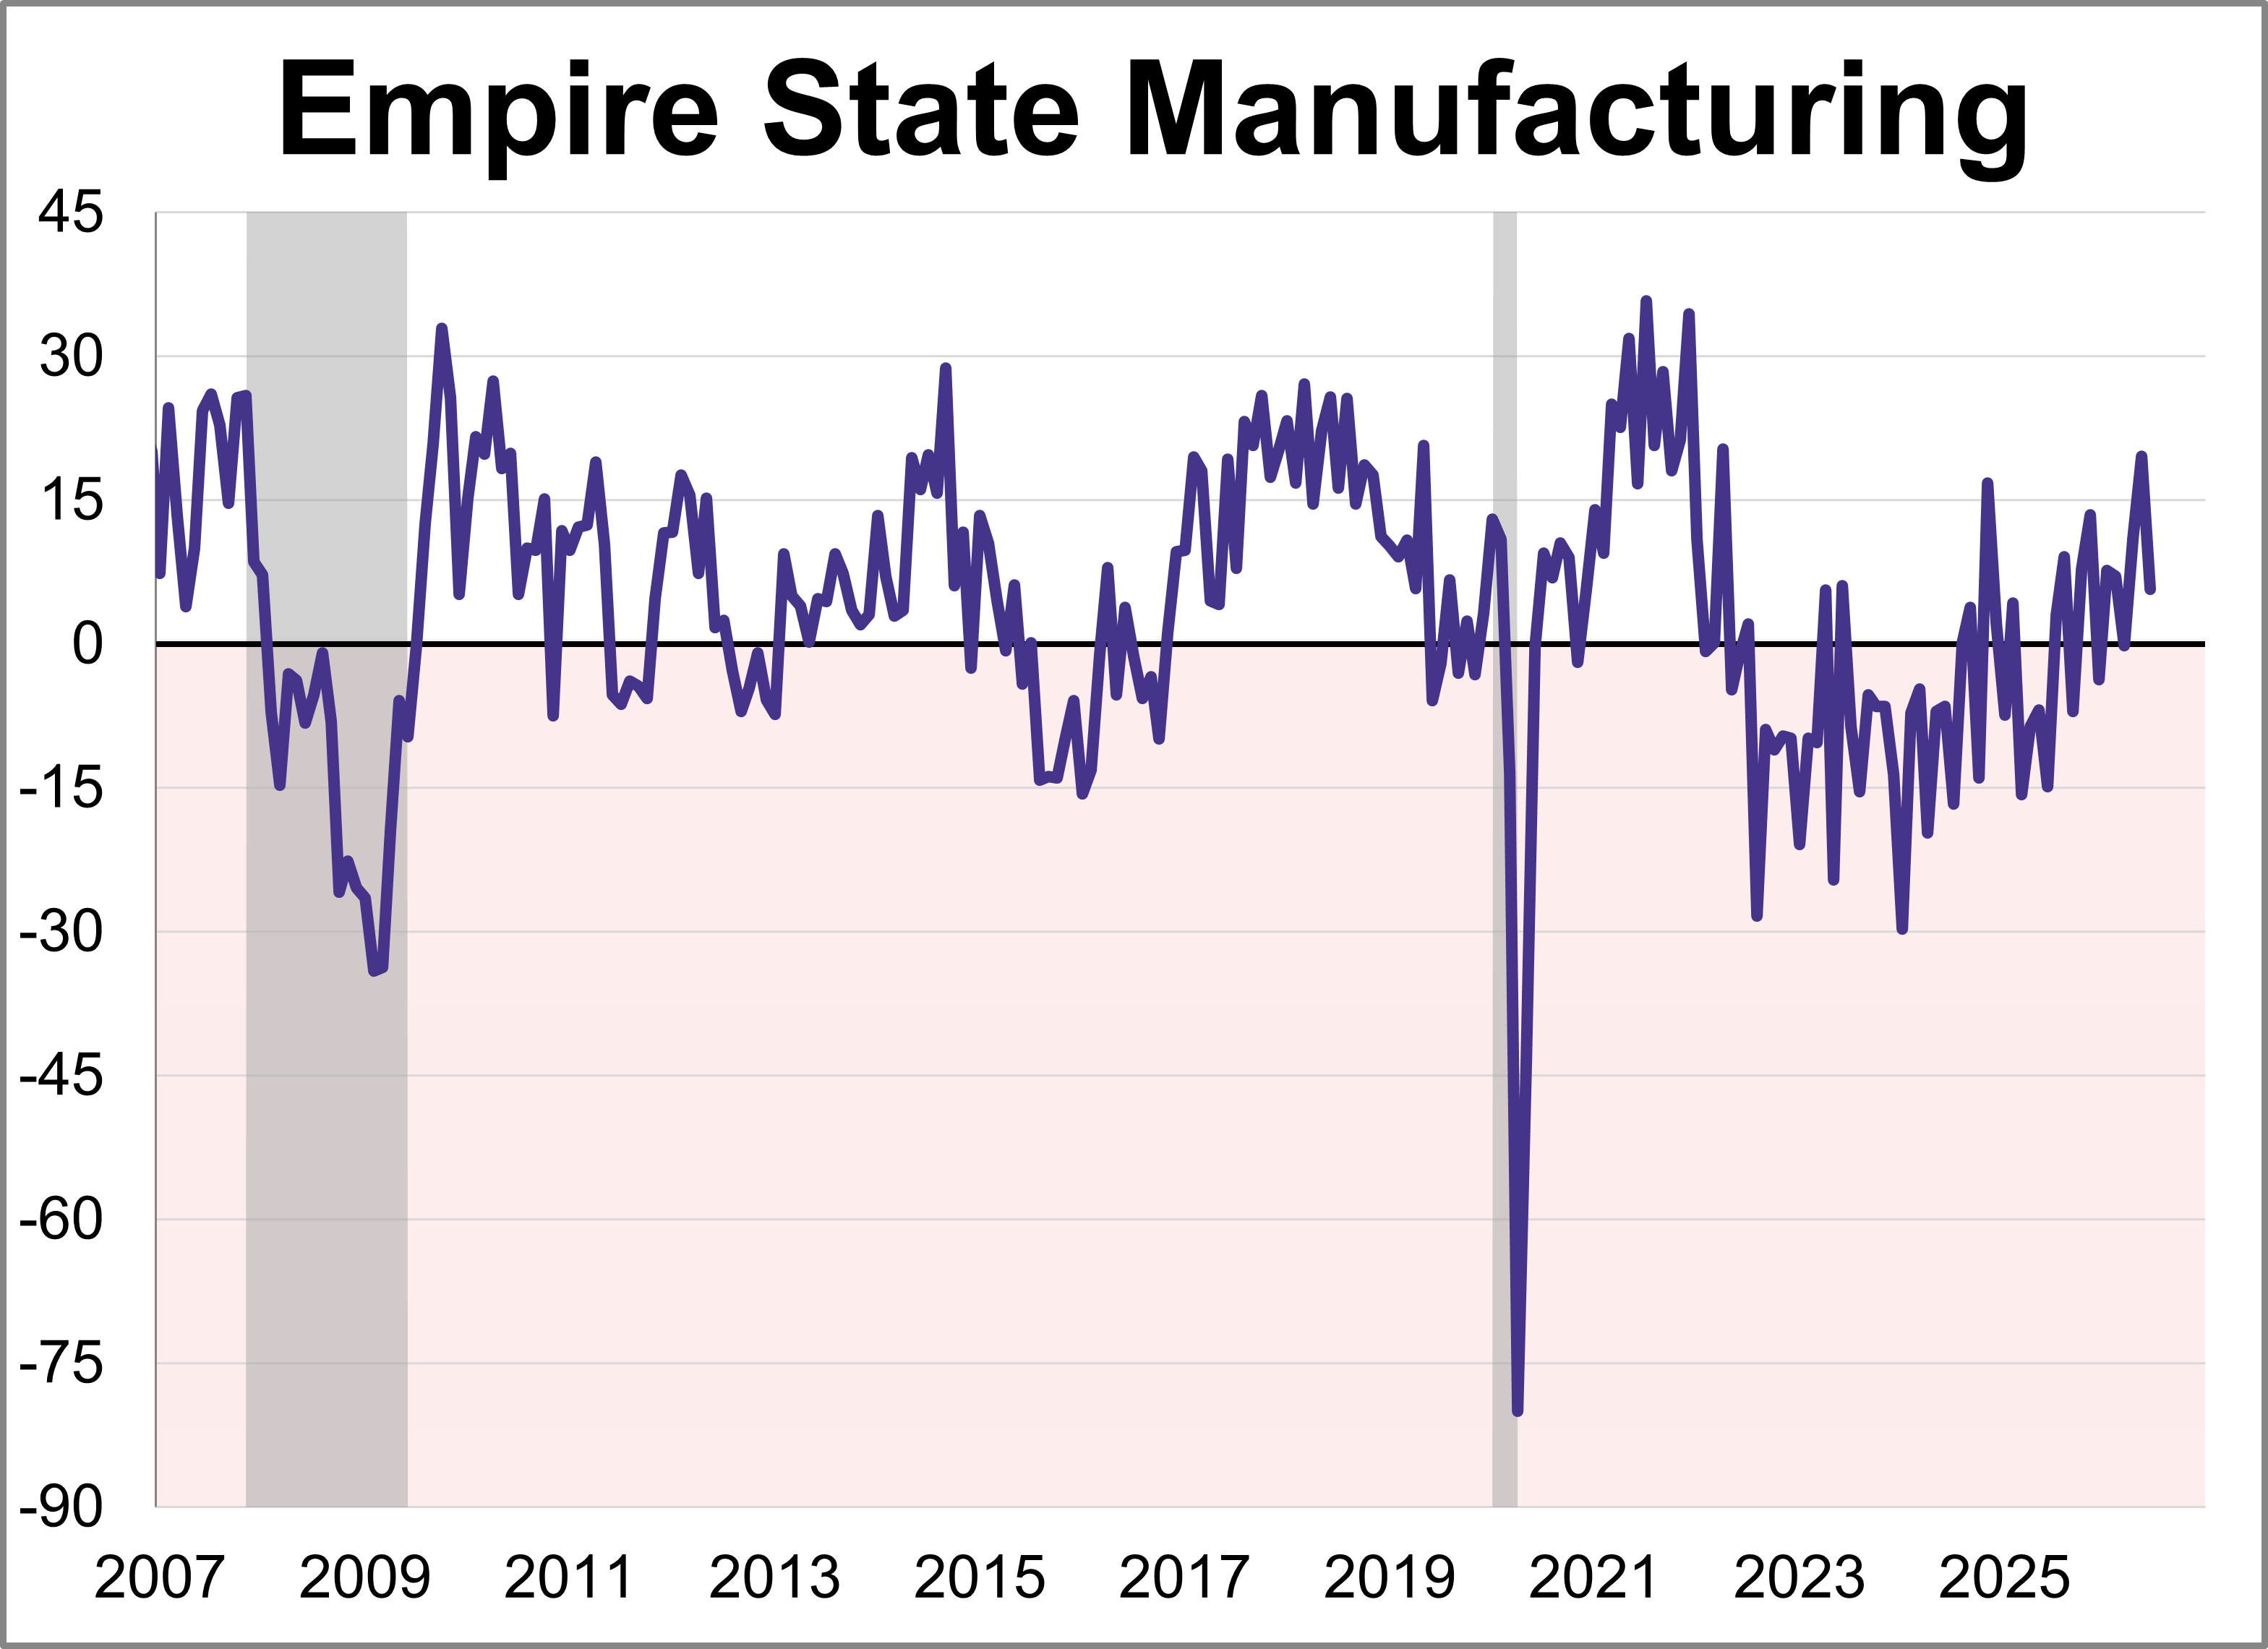
Manufacturing activity rose modestly in New York State, according to the Empire State Manufacturing June survey. The diffusion index for General Business Conditions remained positive but dropped 13.9 points to 5.7, falling short of the 13.2 forecast.